Tide Gauge Evidence: Sea Levels
Rose Faster Before 1950 Than Since
In recent years it has become increasingly apparent that tide gauge measurements of sea level rise often do not align with climate model expectations.
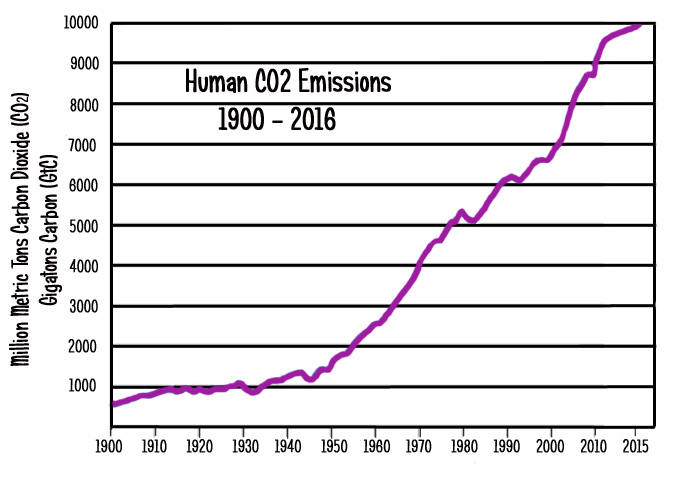
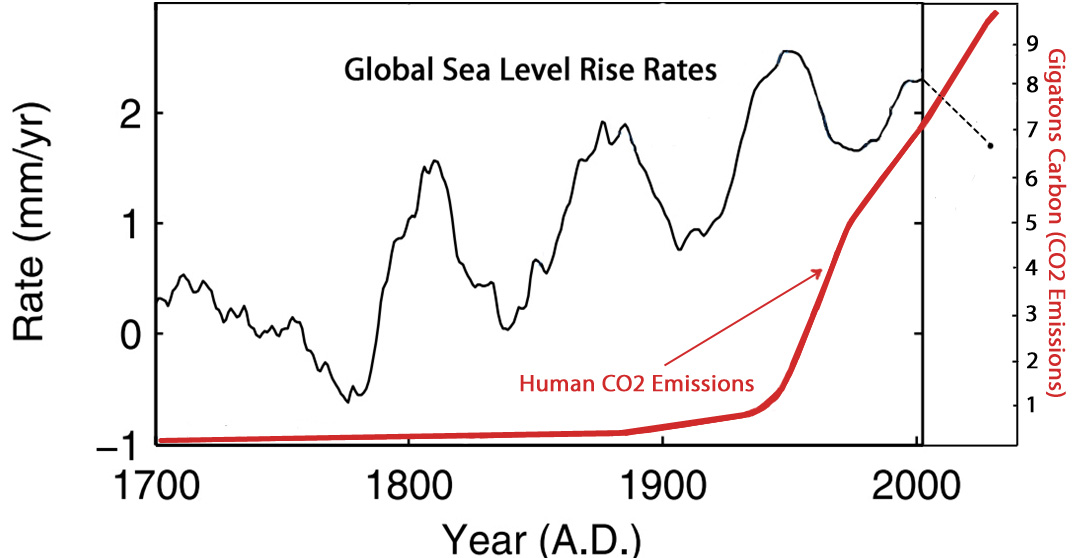
The models are predicated on the assumption that anthropogenic CO2 emissions, which have risen explosively since about 1950, are the drivers of modern sea level rise.
Evidence from observed sea level trends have not been cooperating with this narrative, however.
Tide gauges indicate there has been a substantial overall reduction in the rate of sea level rise since about 1950 rather than the expected substantial acceleration.
For example, UK oceanographer Simon Holgate reported a 29% deceleration in global sea level rise rates from the first half of the 20th century (1904-1953) to the second half (1954-2003)
Holgate, 2007 “The rate of sea level change was found to be larger in the early part of last century (2.03 ± 0.35 mm/yr 1904–1953), in comparison with the latter part (1.45 ± 0.34 mm/yr 1954–2003).”
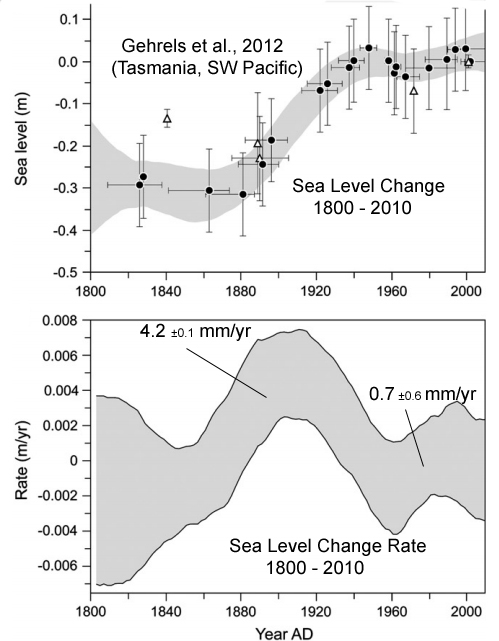
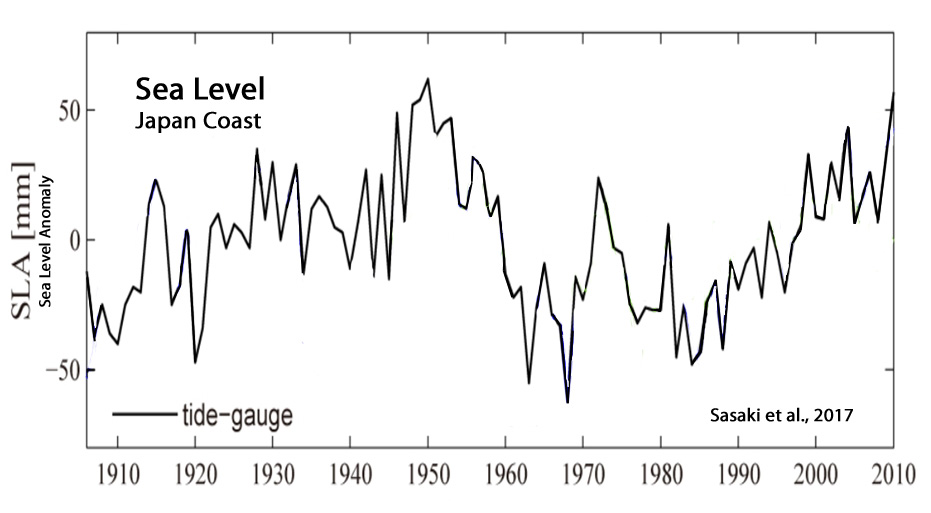
A small sampling of regional tide gauge results (SW Pacific, Japan) affirm the deceleration of sea level rise since the mid-20th century, and indicate the highest rates of sea level rise occurred before human CO2 emissions began accelerating rapidly.
Gehrels et al., 2012 “Between 1900 and 1950 relative sea level rose at an average rate of 4.2±0.1 mm/yr. During the latter half of the 20th century the reconstructed rate of relative sea-level rise was 0.7±0.6 mm/yr. Our study is consistent with a similar pattern of relative sea-level change recently reconstructed for southern New Zealand.”
Sasaki et al., 2017 “Sea level variability around Japan from 1906 to 2010 is examined using a regional ocean model, along with observational data and the CMIP5 historical simulations. The regional model reproduces observed interdecadal sea level variability, e.g., high sea level around 1950, low sea level in the 1970s, and sea level rise during the most recent three decades, along the Japanese coast. … That the wind-induced sea level rise along the Japanese coast around 1950 is as large as the recent sea level rise highlights the importance of natural variability in understanding regional sea level change on interdecadal timescales.”
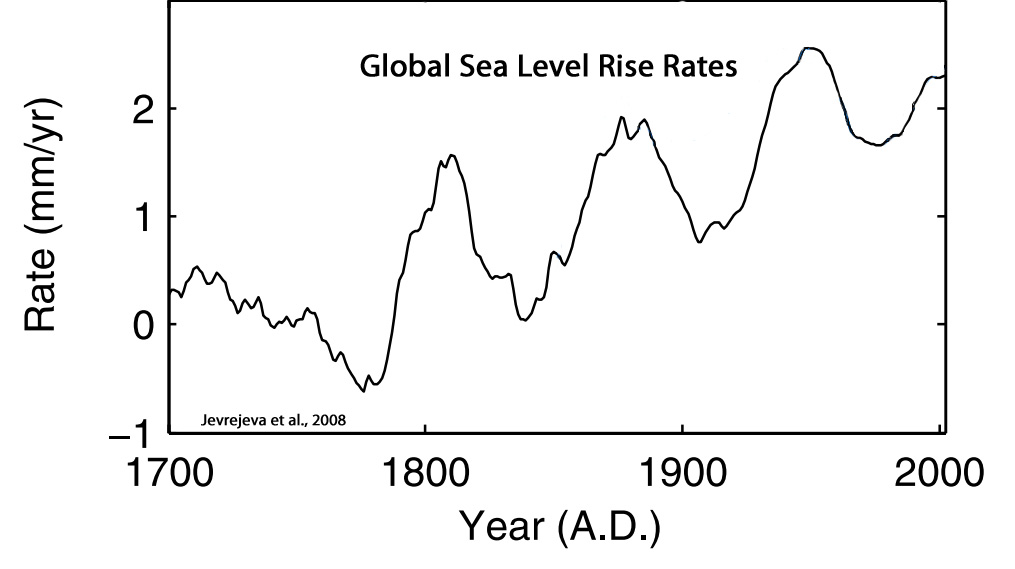
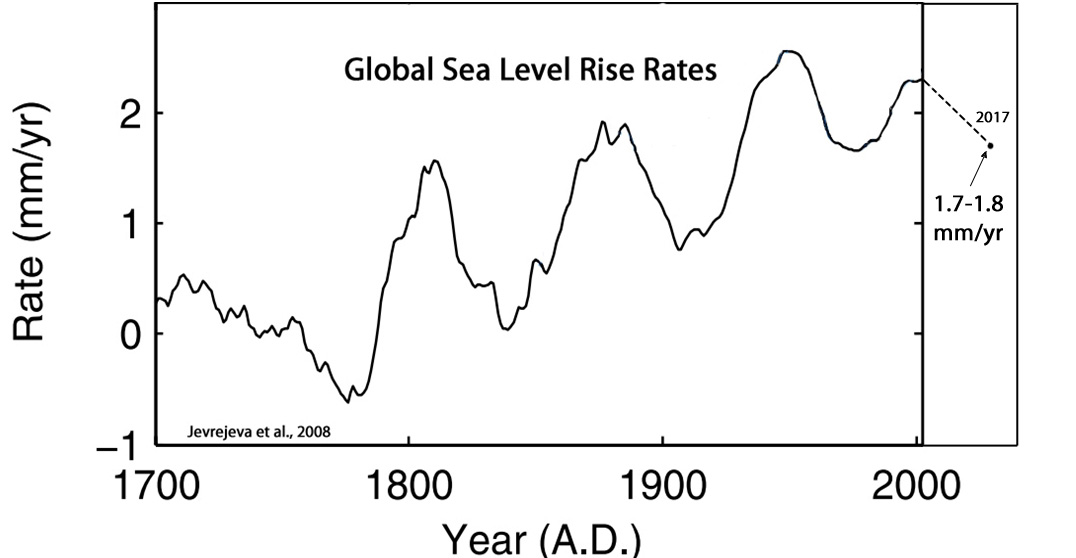
A reconstruction of global-scale rates from tide gauges (Jevrejeva et al., 2008) dating back to 1700 also reveals a deceleration in the rate of sea level increase since 1950.
Jevrejeva et al., 2008
Rates Of Recent Rise For 2,133 Global-Scale Tide Gauges: 1.04 mm/year
According to a comprehensive analysis (2,133 tide gauges) of Permanent Service for Mean Sea Level (PSMSL) data, the current (2014) global mean sea level rise rate is a little more than 1 mm/year.
Parker, 2015 “The nominal satellite altimeter-based determination of the absolute global mean sea level is actually a computational result rather than a direct observation. It is obtained by correcting the satellite altimeter raw signal with algorithms having many features in common with the climate models. Regardless of any modeling problems, Carter et al. (2014) pointed out that estimates of sea-level change from satellite-collected data remain problematic, because of the many uncertainties in data collection and processing. In particular, there is inconsistency between the results derived by different research groups, with all results depending upon the accuracy of complex adjustments, some of which lack in- dependent verification, plus the severe problem that the signal being sought may be less than the noise level of the data being used. Many corrections applied to all satellite altimeter measurements of sea-level since 2003 had the effect of changing a sea-level record that showed no trend or a gentle rise into one that projects high rates of rise.”
“The latest PSMSL Table of Relative Mean Sea Level Secular Trends update 14-Feb-2014 (www.psmsl.org) proposes the relative rates of rise computed for 2133 tide gauges of variable record length (maximum 183 [years], minimum 21 [years], average 56.5 years) with the more recent, shortest readings collected mostly in areas of subsidence and a strongly non uniform geographical coverage. The average relative rate of rise of the 2133 tide gauges is 1.04±0.45 mm/year“
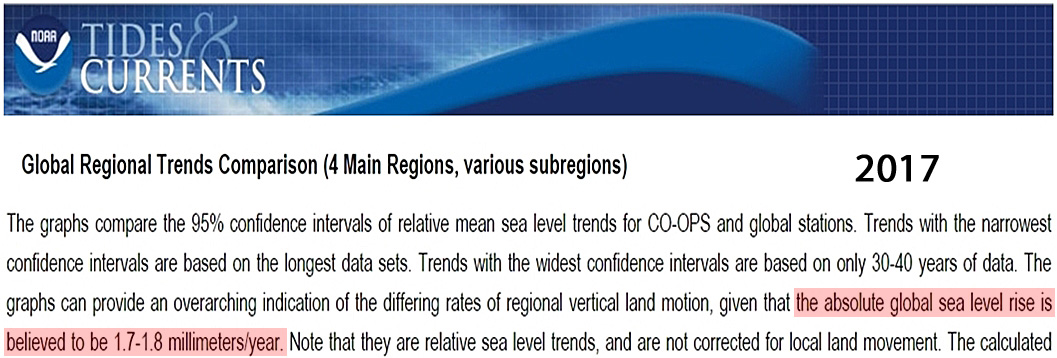
NOAA’s ‘Believed’ Rates Of Recent Rise From Tide Gauges: 1.7-1.8 mm/year
NOAA.gov
Adding NOAA’s ‘Believed’ Modern Rate To The Long-Term Rate Trend
Trends In Human CO2 Emissions Rates (GtC/year)
Non-Correlation: Sea Level Rise Rates & CO2 Emissions Rates
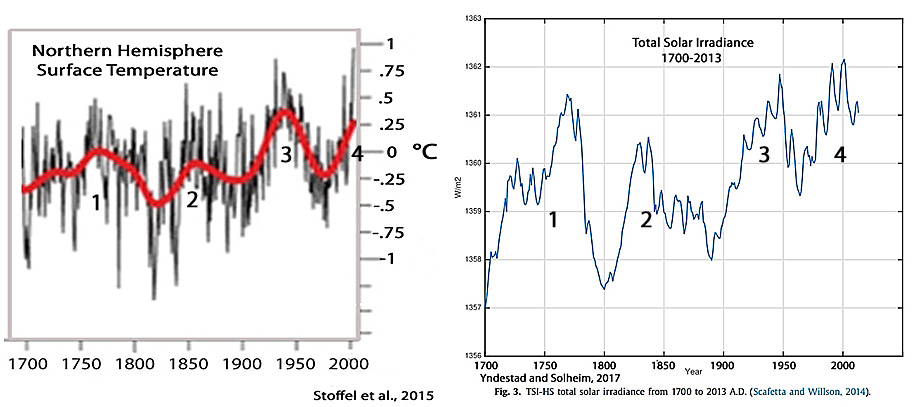
Reconstructed Trends In Total Solar Irradiance 1700-2013
Yndestad and Solheim, 2017
“Deterministic models based on the stationary periods confirm the results through a close relation to known long solar minima since 1000 A.D. and suggest a modern maximum period from 1940 to 2015. The model computes a new Dalton-type sunspot minimum from approximately 2025 to 2050 and a new Dalton-type period TSI minimum from approximately 2040 to 2065. … Periods with few sunspots are associated with low solar activity and cold climate periods. Periods with many sunspots are associated with high solar activity and warm climate periods.”
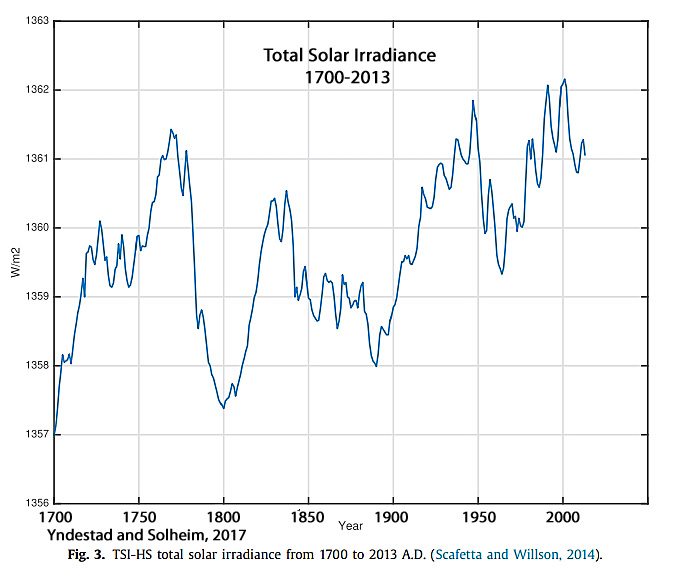
Apparent Correlation: TSI And (Lagged) Sea Level Rise Rate Changes

Apparent Correlation: TSI And Northern Hemisphere Temperatures
Stoffel et al., 2015



Gauges that is not reliable.
Satellites is better or?
Nasa think so and mixes gauges and satellites to get acceleration:
https://climate.nasa.gov/
As if gauges stopped to work after the satellites was launched!
Trump and I think NASA is unreliable.
http://www.sealevel.info/avgslr.html
Most fundamentally, satellite altimeters measure the wrong thing. Their measurements are distorted by “sea-level rise” caused by thermal expansion when the upper layer of the ocean warms. But that is a strictly local effect, which doesn’t affect the quantity of water in the oceans, and doesn’t affect sea-level elsewhere (e.g., at the coasts).
Sea-level rise only matters at the coasts, but satellite altimeters are incapable of measuring sea-level at the coasts. They can only measure sea-level in the open ocean. Only tide gauges measure sea-level at the coasts, where it matters.
Also, data from tide gauge measurements of sea-level are much higher quality than satellite altimetry measurements. The satellite measurements of sea-level are of dubious reliability, and vary considerably from one satellite to another.
Also, we have reliable, near-continuous tide-gauge records of sea-level measurements which are nearly ten times as long as the combined satellite measurement record, and twenty times as long as any single satellite measurement record.
—
“NOAA says that the average rate of MSL (mean sea-level) rise is 1.7-1.8 mm/yr. The difference between that figure and the 1.4-1.5 mm/yr calculated average from tide gauge measurements is apparently NOAA’s addition of a model-derived GIA adjustment to the calculated average”
—
“The rate of measured sea-level rise (SLR) varies from -17.59 mm/yr at Skagway, Alaska, to +9.39 mm/yr at Kushiro, Japan. 197 of 225 stations (87.6%) have recorded less than 3.3 mm/yr sea-level rise. At 47 of 225 stations (20.9%) sea level is falling, rather than rising. Just 28 of 225 stations (12.4%) have recorded more than 3.3 mm/yr sea-level rise. The average SLR at those 225 gauges is +0.90 mm/yr. The median is +1.41 mm/yr”.
Kenneth, how does it feel to quote the word “model” so many times? Isn’t that what you accuse me of all the time? All I have is models? No actual measurements?
According to your graphs TSI varies by 2 W/m² over decades. So from around 1950 to today TSI increased from ~1360 W/m² to 1362 W/m² and back to 1361 W/m² since 2000. 50 years 2 W/m² increase means an average increase of 1 W/m².
Converted into actual forcing on the surface? 0.25 W/m² average on Earth’s surface. 0.175 W/m² when considering the albedo. That’s not nothing, but it’s not enough to explain the OHC change (especially with the decrease back to 1361 W/m² and the OHC still climbing at roughly the same speed as before). An influence on thermal expansion and ice melt might be there, but it can’t be the main driver with that low amount of change, right?
The word “model” was used twice, both referring to climate models that wrongly projected sea level rise would follow trends in anthropogenic CO2 emissions…which they haven’t.
“In recent years it has become increasingly apparent that tide gauge measurements of sea level rise often do not align with climate model expectations. … The models are predicated on the assumption that anthropogenic CO2 emissions, which have risen explosively since about 1950, are the drivers of modern sea level rise.”
It increased from 1358 to 1362 (4 W m-2) between 1900 and 2000. But I understand why you would want to pretend like the 1900 to 1950 solar activity rise didn’t happen. After all, both sea levels and surface temperatures rose explosively, and CO2 emissions were negligible and largely stable. It was only after 1950 that sea level rise decelerated and NH temperatures dropped (while CO2 emissions rose explosively) and then rose again (aligning with solar activity).
To demonstrate that CO2 emissions are responsible for sea level rise and thermal expansion/heat redistribution in the oceans (and not solar irradiance or cloud cover variations or natural oceanic/atmospheric oscillations), you’ll need to finally produce actual scientific evidence that varying CO2 concentrations in volumes of 0.000001 over a body of water causes net heat changes in that body of water, furnishing results from an actual controlled experiment (i.e., provide physical measurements). Since we’ve been asking you to provide this evidence for 5 months now, and you have failed to produce even a single paper demonstrating that CO2 molecules in the atmosphere have been observed to heat up water bodies, I’ll just assume, once again, that you cannot support your beliefs with actual scientific evidence.
In general, the UN’s Intergovernmental Panel on Climate Change (IPCC), and government planning and management authorities, use the unqualified and ambiguous term ‘sea-level’ when discussing this issue. In nearly all instances, this usage refers to global average sea-level.
This (rightly) leads to great confusion in the public mind.
First, because most people think that when government scientists or ministers talk about sea-level change they are referring to what is actually happening on the nearest coastline rather than discussing a global statistic.
Second, and after people have had the distinction between local and global sea-level explained to them, they are (rightly) puzzled as to why a planning agency would use a notional global average value rather than direct measurements
made at nearby coastal locations of interest. After all, houses do not have their heating and air-conditioning designed to cope with the global average temperature range, but with the known (and measured) local temperature range; why should coastal planning and sea-level matters be any different?
As concluded by Wunsch et al. (2007) with respect to the satellite measurements:
Missed the attribution for Wunsch et al. (2007)
http://ocean.mit.edu/~cwunsch/papersonline/sea_level_5may2007.pdf
Both 2017 papers you quoted mention “models” of some kind that aren’t climate models.
I used 1950 to 2000 or today because that’s what OHC data is available for. BTW: is there any reason to only quote the TSI-HS graph and not the TSI-LS graph? Both based on models and estimates and if they would not show something that you agree with you (or AndyG55) would dismiss them as false data worth nothing, wouldn’t you?
To understand if we are on the same page with our understanding of radiative energy transfers, would you please finally answer if the core in the infamous “steel greenhouse” would get warmer when the shell gets added or not. Thank you.
Oh. Well in that case…
Here’s 0-20 m OHC data that extends back to 1900 (Gouretski et al., 2012). Notice the 1.3 C rise in the 0-20 m layer between 1900 and 1945. Then notice how the 0-20 m layer has only warmed another 0.3 C between 1945 and 2010.
https://notrickszone.com/wp-content/uploads/2017/05/World-Ocean-Heat-Content-0-20-m-and-0-400-m-Gouretski-2012.jpg
So ocean heat content warmed at a rate of 0.29 C per decade between 1900 and 1945 (in sync with TSI trends), and then rose by just 0.046 C per decade between 1945 and 2010 (again, in sync with TSI trends). The early 20th century OHC warming trend was more than 6 times more rapid and pronounced than the post-1945 warming. Neither 1900-1945 or 1945-2010 trend for 0-20 m ocean heat content matches the human CO2 emissions trend. But both trends closely match (including the 1945-1980 cooling) the TSI trajectory.
Explain what forcing mechanism you believe caused the 1.3 C warming in the 0-20 m layer from 1900 to 1945. Since you don’t believe it was the Sun’s radiance, and you necessarily can’t claim it was the CO2 emissions, what was it?
0-20 m OHC? Is that a thing? I would have thought the top layer pretty much follows daily weather?
Nevertheless, I took the liberty to compare your 0-20 m graph to the current 0-700 m graph to find out how much more heating there was between 1900 and 1950. http://imgur.com/a/nQRo0
A little more than double the amount we have today if 0-700 m would behave the same as 0-20 m and those measurements are correct.
That warming could be caused by the Sun and CO2 (the scale is logarithmic, with lower concentrations smaller changes have the same forcing as considerable bigger changes with high concentration) or whatever you want. I am interested in the recent OHC change and it being entirely attributable to CO2 forcing if those forcing values are correct. As a skeptic you dispute the later one, but if you could – just for one moment – assume that CO2 concentration changes do cause a change in forcing, would you still say that it’s nonsense to attribute an OHC change that amounts to 0.5 W/m² over 50 years to a forcing that was 0.5 W/m² average over those 50 years?
Yes, it’s a thing. Closer to the surface, they’re called “sea surface temperatures”, or SSTs. You’ve just learned about this for the first time?
Yes, I realize that that’s what you’ve imagined.
According to Levitus et al. (2012) and Riser et al. (2016), the 0-700 m layer warmed up by a whopping 0.18 °C between 1955-2010. That’s a temperature change of 0.033 °C per decade, which is considerably slower than during the first half of the 20th century. Not only that, it’s a much slower temperature change than what has been observed throughout the Holocene, when there have been “temperature swings >2 °C within 200 years” in the 0-1000 m layer. In other words, recent changes, if they are accurate (and that’s a big if), do not fall outside the range of that which has occurred naturally, or in the absence of any alleged CO2 forcing.
How do we know that the temperature swings were that big? Haven’t you seen the noise/errors in those modeled reconstructions of 1900-now OHC in the paper your graph is coming from?
Why is such a reconstruction without actual measurements ok to use as an argument and why aren’t you skeptic about this at all?
We don’t “know” that they were, just as we don’t “know” what modern OHC actually is. The error bars (up to 2 C) and uncertainty in the heat change (uncertainty range 10-20 W m-2 and up to 50 W m-2) for even the ARGO floats are well more than an order of magnitude larger than the alleged radiative/temperature change since 1955 (0.39 W m−2, 0.09 C) in the 0-2000 m layer. And only 11% of the layers below 2000 m have even been sampled since the 1990s, and none before then. We we have available to us now are not significantly more reliable than the pre-1950 data or even pre 2003 data in terms of errors and uncertainty. They are all models and guesswork.
On the other hand, we have a great deal of physical evidence (hundreds of scientific papers) for sea level high stands from across the world that indicate the ocean waters were anywhere from 1 to 5 meters higher than present from about 4,000 to 7,000 years ago, or during the Holocene Thermal Maximum. We also have tree-line evidence, and a plethora of other proxies indicating that today’s temperatures are much cooler than during the HTM…or even during the MWP.
—
http://onlinelibrary.wiley.com/doi/10.1029/2006JC003825/abstract
In this study we have investigated the accuracy of North Atlantic temperature and heat storage fields from the Argo profiling float dataset. In particular we have considered the limitations placed by the number of available floats on the accuracy with which Argo can be used to estimate these fields. The work described here forms part of a broader study, which will investigate variability in heat storage and the mixed layer heat budget during the Argo period. Agreement between the hydrographic and Argo-based temperature fields to within 0.5° C was typically found in the eastern basin with higher differences in the western basin, particularly within the boundary current where errors exceed 2° C. … Our analysis of subsampled temperature fields from the OCCAM model has shown that in the subtropical North Atlantic, the Argo project provides temperature data at a spatial and temporal resolution that results in a sampling uncertainty in mixed layer heat storage of order 10 – 20 Wm-2. . … [T]he expected sampling error increases to more than 50 Wm−2 in the Gulf Stream region and north of 40°N, limiting the use of Argo in these areas.
—
Wunsch and Heimbach, 2014
http://journals.ametsoc.org/doi/full/10.1175/JPO-D-13-096.1
About 52% of the ocean lies below 2000 m and about 18% below 3600 m. By defining a volume as having been “probed” if at least one CTD station existed within a roughly 60 × 60 km2 box in the interval 1992–2011, a minimal measure of sampling can be obtained. Thus, about ⅓ (11% of the total volume) of water below 2000 m was sampled during that time [1992-2011]. Of the 16% lying below 3600 m, about 17% was measured. As a consequence of this undersampling, even with the improvements in the last 20 yr, many papers have been published that simply assume no significant changes have taken place in the deep ocean over the historical period.
Unlike you, I am an interminable, equal-opportunity skeptic. Why are you only skeptical about presented data that don’t support your beliefs, but you wholly accept modeled assumptions as “truth”?
Why would anyone bother indulging you in your manic imaginary analogies that have ABSOLUTELY NOTHING to do with anything to do with gravity based transfers of energy.
You are digging a whole deeper and deeper into your own sewer, seb.
The “steel greenhouse” is ridiculous fantasy with regard to being even remotely analogous to the conceptualization that CO2 variations have been observed to cause net changes in water body temperatures…since they have not been observed to have done so in the real world. There are no physical measurements verifying how little or how much water temperatures are changed by varying CO2 over the top of them. It’s all modeling and assumptions and beliefs. As a skeptic, I’m asking for physical measurements affirming that what you claim happens in the real world actually happens in the real world. And yet you cannot provide those physical measurements from a real-world observation, and because you know you can’t, you resort to claiming your non-observed beliefs about CO2 forcing and ocean heat content are “the laws of physics”.
I am purposely avoiding responding to your preposterous analogies and imaginative thought experiments. And yet you incorrigibly continue to post them anyway.
I didn’t ask you if you think that the steel greenhouse is a ridiculous fantasy. We have multiple examples of things that act just like it in our lifes. The question was: do you think that in such a scenario the constantly heated core would become warmer when a shell is introduced or not?
It doesn’t matter that you don’t think that the atmosphere works this way or not. I just want to know if you know how radiative energy transfers work or if you think that somehow the core could stay at the same temperature as without the shell and not violate the laws of physics by doing that.
Your belief that CO2 functions even remotely like a steel greenhouse when it comes to heating up the ocean is indeed ridiculous fantasy. That’s what I wrote.
Yes. When a fire is burning underneath a steel container with a lid, the fire heats up the steel container and the lid contains the internal heat better than if there was no lid. Again, this is NOTHING like what has ever been observed to happen with regard to varying CO2 concentrations by 0.000001 over a body of water.
I’m not even talking about the atmosphere. I’m talking about the OCEAN. Or even water bodies in general. Only 1% of any net heat change in the Earth system is manifested in the atmosphere. 93% of heat changes in the Earth system are manifested in the world ocean. And no physical measurements from a real-world observation has ever shown that CO2 concentrations varied by 0.000001 over a body of water causes heat changes. You believe this happens, and you amusingly call those beliefs “the laws of physics”, but you yourself have acknowledged that we have no empirical evidence or physical measurements from the real world that affirms that atmospheric CO2 concentrations actually do what you believe they do because they’ve changed by 0.0001 since 1900.
Are you evading my quest to find out if you know how radiative energy transfer works on purpose? I am not talking about fire in a steel container. I want to know if you know by what mechanism a heated object (constant energy input) becomes even hotter when insulation is added. In a vacuum with radiation as the only way to transfer energy. From you answers and way you phrase your question I have the strong feeling, that you ignore that “law of physics”.
P.S.: We also haven’t measured how hot the surface of the Sun is. We only know this because we “believe” that the laws of physics are universal and the surface of the Sun doesn’t change them. There are also lots of places in this solar system where we haven’t measured gravity yet and still we assume the laws of physics work everywhere and there will be no surprises when launching a probe …
poor seb think that TSI is the only change during the Solar maximums.
roflmao.
Ignorance, yet again.. and proof he hasn’t learnt one tiny thing during his baseless AGW religion trolling sessions.
Enlighten me!
NO-ONE has any chance of ever enlightening you.
You do not have the capacity to be bright !!
“but it’s not enough to explain the OHC change”
Show us actual DATA on actual OHC change.
Levitus is a AGW agenda driven model, nothing more.
ARGO data is unfortunately in the hands of a rabid cultist who has actually admitted throwing away “cooler” data.
Another case of “i don’t like the data, so it must be fake”? If that’s the only thing that skeptics can do to sleep at night, ok … noted.
Show us real data from before 2003, seb…
We are waiting…
Or are you just FABRICATING , yet again.
It is easy to show that Josh’s actions have greatly devalued any real data from ARGO.
https://s19.postimg.org/46xcg7377/figure-42.png
Sebastian. Please tell us the residence time is disparate solar insolation entering the oceans. The longer the residence time, the greater the accumulated affect, positive w
The old gaugestations have long series of data.
That is good for observation of acceleration.
Lack of!
There is a 60 Year cycle to be found at most stations.
Example: https://tidesandcurrents.noaa.gov/sltrends/global_50yr.htm?stnid=680-140
In the paper ‘On the decadal rates of sea level change during the twentieth century’ by S. J. Holgate1 (GEOPHYSICAL RESEARCH LETTERS, VOL. 34, L01602, doi:10.1029/2006GL028492, 2007), found a few longer records for his study. And when suitably processed the 60year cycle information is filtered out.
And from these geographically scattered sites Holgate1 is able to make a reasonable composite plot of sea level rise. His conclusion —
Satellite sea level data “adjustments” started between 2000 and 2003.
https://s19.postimg.org/p42wgwtir/comparison.jpg
And continued upwards, unabated by reality.
Kennith, your quote attributed to Parker and Ollier, 2015 isn’t in the paper you linked. When I search using parts of your quote I only find your pages. Is there another paper the quote came from?
It’s Kenneth.
Thank you for the correction. For some reason I have the link for Parker and Ollier, 2015 transposed with the link for Parker, 2015 in my database.
Parker, 2015
http://www.tsijournals.com/articles/discussion-of-tide-gauge-location-and-the-measurement-of-global-sea-level-rise.pdf
You may notice that Dr. Parker actually has sea level rise at 0.25 mm/yr when correcting for natural 60-year oscillations, but I “mercifully” decided to quote the higher value (1.04 mm/yr) for the 2,133 stations.
Can you explain why you believe that CO2 emissions are predominantly responsible for relative sea level rate oscillations?
[…] Ergänzend hierzu dieser Beitrag (Englisch) Beweise durch Pegelmessung – Meeresspiegel stieg schneller vor 195o […]
[…] The problem for the Climate Alarmists is that the rate of change in the sea-level hasn’t been increasing. In fact, just the opposite has happened. The rate of change in the sea-level has been DECREASING. […]
[…] Link: https://notrickszone.com/2017/05/25/robust-natural-variability-affirmed-in-global-sea-level-rise-rate… […]