Since 2014, 400 Scientific Papers
Affirm A Strong Sun-Climate Link
2017 – 80 Scientific Papers Linking Solar Forcing To Climate
2016 – 133 Scientific Papers Linking Solar Forcing To Climate
2015 – 95 Scientific Papers Linking Solar Forcing To Climate
2014 – 93 Scientific Papers Linking Solar Forcing To Climate
The 20 Latest Sun-Climate Papers
“We confirm the occurrence of upcoming Modern grand minimum in 2020-2053 … [and] extremely incorrect prediction of the terrestrial temperature growth in the next century.” – Zharkova et al., 2017
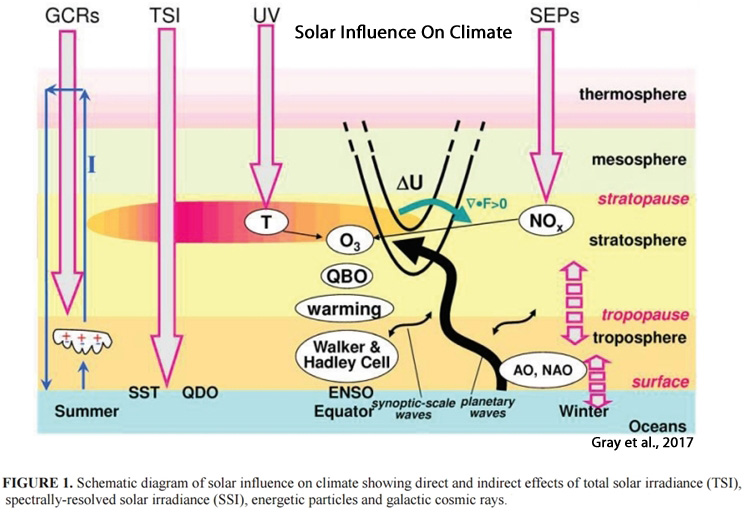
1. Gray et al., 2017 “There are several proposed mechanisms through which the 11-year solar cycle (SC) could influence the Earth’s climate, as summarised by Figure 1. These include: (a) the direct impact of solar irradiance variability on temperatures at the Earth’s surface, characterised by variation in the total incoming solar irradiance (TSI); (b) the indirect impact of variations through the absorption of Ultra-Violet (UV) radiation in the upper stratosphere associated with the presence of ozone, with accompanying dynamical responses that extend the impact to the Earth’s surface; (c) the indirect impact of variations in energetic particle fluxes into the thermosphere, mesosphere and upper stratosphere at high geomagnetic latitudes; and (d) the impact of variations in the generation of ions by galactic cosmic ray (GCR) penetration into the troposphere. Although different in their nature, these four pathways may not work in isolation but their influence could be synergetic.”
2. Zharkova et al., 2017 “Using a summary curve of two eigen vectors of solar magnetic field oscillations derived with Principal Components Analysis (PCA) from synoptic maps for solar cycles 21-24 as a proxy of solar activity, we extrapolate this curve backwards three millennia revealing 9 grand cycles lasting 350-400 years each. The summary curve shows a remarkable resemblance to the past sunspot and terrestrial activity: grand minima – Maunder Minimum (1645-1715 AD), Wolf minimum (1280-1350 AD), Oort minimum (1010-1050 AD) and Homer minimum (800 900 BC); grand maxima – modern warm period (1990-2015), medieval warm period (900-1200 AD), Roman warm period (400-10 BC) and others. We verify the extrapolated activity curve by the pre-telescope observations of large sunspots with naked eye, by comparing the observed and simulated butterfly diagrams for Maunder Minimum (MM), by a maximum of the terrestrial temperature and extremely intense terrestrial auroras seen in the past grand cycle occurred in 14-16 centuries.”
“We confirm the occurrence of upcoming Modern grand minimum in 2020-2053, which will have a shorter duration (3 cycles) and, thus, higher solar activity compared to MM [Maunder Minimum]. … One of the examples of fitting incorrectly the oscillating function with a linear regression approach is shown by Akasofu (2010) (see her Fig. 9), when explaining the modern era recovery of the Earth from the little ice period and the incorrect use of a linear part of the temperature variations for the extremely incorrect prediction of the terrestrial temperature growth in the next century.”
3. Harde, 2017 “[A] naturally generated [CO2 emission] contributes more than 95% to the overall emission, and its generation rate and the respective absorption rate sensitively respond on global temperature variations. … [The] well known delayed response of CO2 and methane (CH4) to sea and air temperature changes (see, e.g., Petit et al. [2]; Monnin et al. [3]; Caillon et al. [4]; Torn and Harte [5]; Humlum et al. [6]; Salby [7]) are not considered in AR5. … As long as any natural variations in the CO2 concentrations are not accurately known, the ECS [equilibrium climate sensitivity to CO2 doubling] cannot be used as a reliable indicator only for an anthropogenic global warming.”
“The IPCC denies any noticeable solar influence on the actual climate, although strong evidence of an increasing solar activity over the last century exists (see, e.g., Hoyt & Schatten [8]; Willson & Mordvinov [9]; Shapiro et al. [10]; Ziskin & Shaviv [11]; Scafetta & Willson [12]; Usoskin et al. [13]; Zhao & Feng [14]; Soon et al. [15]). … From these studies we conclude that the measured temperature increase of 0.74∘ C over the time 1880–2000 and the observed cloud changes of −4% over the period 1983– 2000 can best be explained by a cloud feedback mechanism, which is dominated by the solar influence. Therefore, it seems quite reasonable to use a model mean of [climate sensitivity to doubled CO2] = 0.7°C, yielding a CO2 initiated warming of 0.3°C [1880-2000] and a solar contribution of 0.44°C [1880-2000].”
4. Pande et al., 2017 “Ozone is a highly reactive, naturally occurring ingredient of the stratosphere that is produced from oxygen by sunlight. It is one of the most important chemicals in both the stratosphere and troposphere. Apart from absorbing the harmful ultaviolet radiation from the sun, it [ozone] also plays an important role in determining earth’s climate. Solar variability affects ozone through radiative heating in atmosphere. Solar UV radiation is absorbed by atmospheric ozone. It is responsible for both the creation and destruction of ozone. … The total ozone was found to be enhanced during magnetically disturbed conditions which are associated with peak solar activity periods. Angell and Korshover (1976) concluded that there is nearly in-phase relationship between sunspot number and total ozone.”
5. Le Mouël et al., 2017 [S]olar activity contains an important component that has undergone clear oscillations of ≈90 years over the past three centuries, with some small but systematic longer-term evolution of “instantaneous” period and amplitude. Half of the variance of solar activity on these time scales can be satisfactorily reproduced as the sum of a monotonous multi-secular increase, a ≈90 -year Gleissberg cycle, and a double-peaked (≈10.0 and 11.0 years) Schwabe cycle (the sum amounts to 46% of the total variance of the signal). The Gleissberg-cycle component definitely needs to be addressed when attempting to build dynamo models of solar activity. The first SSA component offers evidence of an increasing long-term trend in sunspot numbers, which is compatible with the existence of the modern grand maximum.
6. Wen et al., 2017 “A warmer and wetter climate prevailed since ∼4800 a BP and was interrupted by a sharp cold reversal at approximately 3300 a BP that was likely caused by solar irradiance forcing, which resulted in a global cold climatic change and glacier advance.”
7. Munz et al., 2017 “Decadal resolution record of Oman upwelling indicates solar forcing of the Indian summer monsoon (9–6 ka) … We use geochemical parameters, transfer functions of planktic foraminiferal assemblages and Mg / Ca palaeothermometry, and find evidence corroborating previous studies showing that upwelling intensity varies significantly in coherence with solar sunspot cycles. The dominant ∼ 80–90-year Gleissberg cycle apparently also affected bottom-water oxygen conditions.”
8. Allan et al., 2017 “Speleothem is now regarded as valuable archive of climatic conditions on the continents, offering a number of advantages relative to other continental climate proxy recorders such as lake sediments and peat cores. … [T]race elements in speleothems have the potential to provide high resolution insights into palaeoclimatic variability during the Holocene. A deeper analysis reveals several periods of significant rapid climate change during the Holocene (at 10.7-9.2 ka, 8.2-7.9 ka, 7.2-6.2 ka, 4.8-4.5 ka, and 3-2.4 ka BP), which are similar to the cold events detected from different natural paleoclimate archivers. A comparison between the geochemical analysis of Père Noël speleothem and solar activity (sunspot number) reveals a significant correlation. Spectral analysis methods reveal common solar periodicities (Gleissberg cycle, de Vries cycle, unnamed 500 year, Eddy cycles, and Hallstatt cycle). The geochemical analyses have the potential to prove that PN speleothem is sensitive to changes in solar activity on centennial and millennial timescales during the Holocene.”
9. Woodson et al., 2017 “The last ca. 1000 years recorded the warmest SST averaging 28.5°C. We record, for the first time in this region, a cool interval, ca. 1000 years in duration, centered on 5000 cal years BP concomitant with a wet period recorded in Borneo. The record also reflects a warm interval from ca. 1000 to 500 cal years BP that may represent the Medieval Climate Anomaly. Variations in the East Asian Monsoon (EAM) and solar activity are considered as potential drivers of SST trends. However, hydrology changes related to the El Nino-Southern Oscillation (ENSO) variability, ~ shifts of the Western Pacific Warm Pool and migration of the Intertropical Convergence Zone are more likely to have impacted our SST temporal trend. … The SA [solar activity] trends (Steinhilber et al., 2012) are in general agreement with the regional cooling of SST (Linsley et al., 2010) and the SA [solar activity] oscillations are roughly coincident with the major excursions in our SST data.”
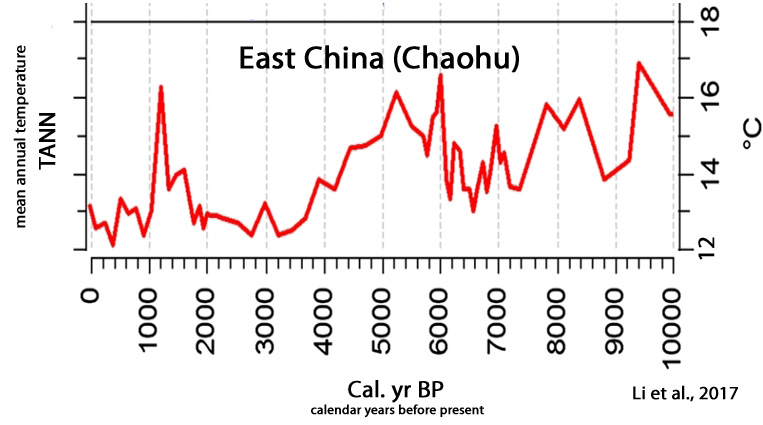
10. Li et al., 2017 “The main driving forces behind the Holocene climatic changes in the LYR [Lower Yangtze Region, East China] area are likely summer solar insolation associated with tropical or subtropical macro-scale climatic circulations such as the Intertropical Convergence Zone (ITCZ), Western Pacific Subtropical High (WPSH), and El Niño/Southern Oscillation (ENSO).”

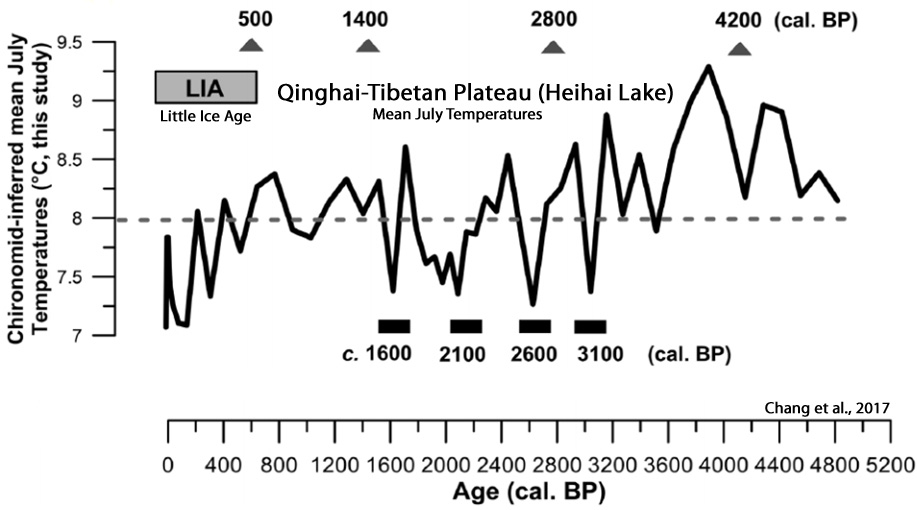
11. Chang et al., 2017 “The chironomid-based record from Heihai Lake shows a summer temperature fluctuation within 2.4°C in the last c. 5000 years from the south-east margin of the QTP [Qinghai–Tibetan Plateau]. … The summer temperature changes in this region respond primarily to the variation in the Asian Summer Monsoon. The variability of solar activity is likely an important driver of summer temperatures, either directly or by modifying the strength and intensity of the Indian Ocean Summer Monsoon. … We observed a relatively long-lasting summer cooling episode (c. 0.8°C lower than the 5000-year average) between c. 270 cal. BP and AD c. 1956. … The record shows cooling episodes occurred at c. 3100, 2600, 2100 and 1600 cal. BP. This is likely related to the period defined as the Northern Hemisphere Little Ice Age (LIA; c. AD 1350–1850, equivalent to 600–100 cal. BP). These possibly relate to the 500-year quasi-periodic solar cycle. Cooling stages between c. 270 and 100 cal. BP were also recorded and these are possibly linked to the LIA suggesting a hemisphere-wide forcing mechanism for this event.”
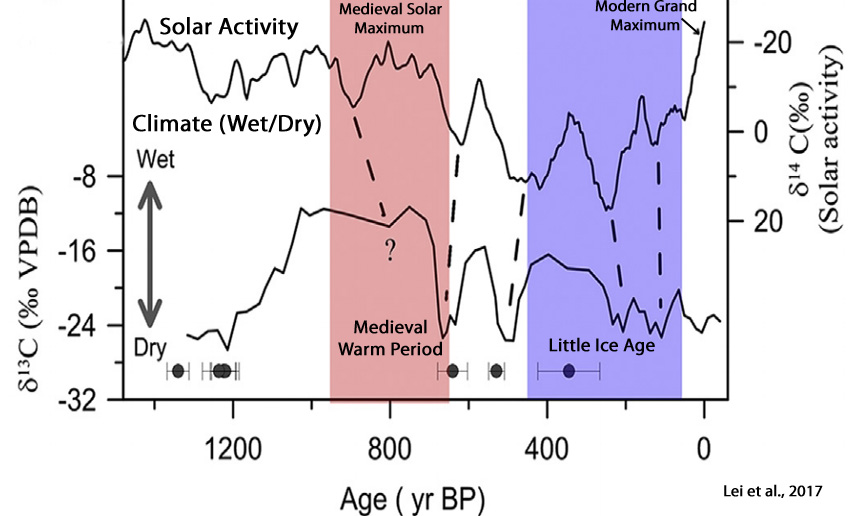
12. Lei et al., 2017 “The precipitation variability on decadal to multi-centurial generally always reflects changes in solar activity and large-scale circulation, e.g., the ENSO and the EASM [East Asian Summer Monsoon] (Chen et al., 2011; Vleeschouwer et al., 2012; Feng et al., 2014). [D]uring the MWP [Medieval Warm Period], the wetter climate in this region was consistent with more frequent ENSO events, stronger EASM and higher solar activity, whereas the opposite was found for the LIA. In particular, d13Cac fluctuations on multi-decadal to centennial scales is consistent with the changes in solar activity, with fewer dry intervals corresponding to periods of minimum solar activity within dating errors, which are referred to as the Oort Minimum (AD 1010-1050), Wolf Minimum (AD 1280-1340), Sporer Minimum (AD 1420-1530), Maunder Minimum (AD 1645-1715) and Dalton Minimum (AD 1795-1820). These results suggest that climate change in southeastern China is sensitive to ENSO and the EASM, which may be driven by solar activity.”
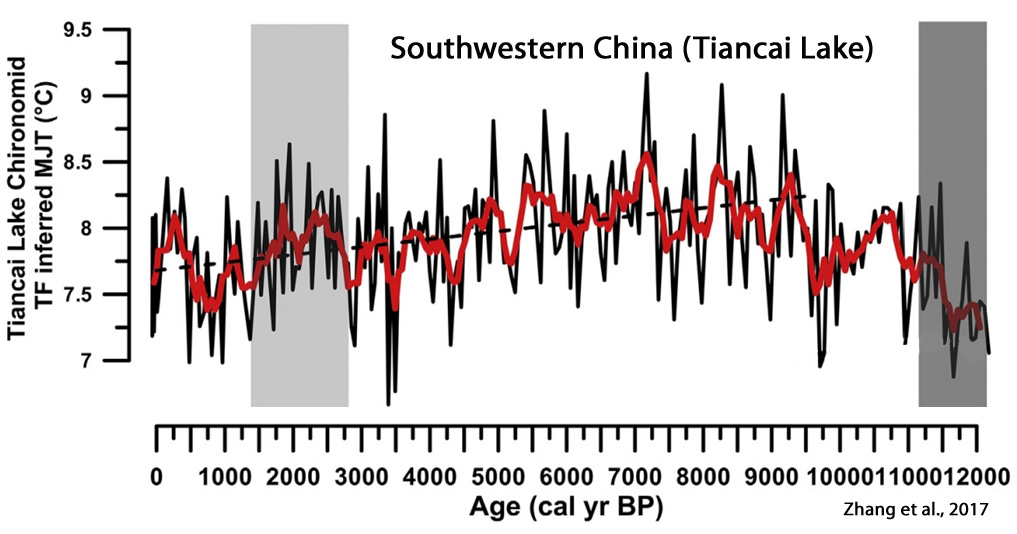
13. Zhang et al., 2017 “The record suggests the summer temperature varies by ~2.5 °C across the entire period. A generally warmer period occurred between c.8500 and c.6000 cal yr BP and a cooling trend was initiated from c.5500 cal yr BP. The overall pattern broadly matches the summer insolation at 30N and the Asian Summer Monsoon records from the surrounding regions suggesting that summer temperatures from the southeast margin of the QTP respond to insolation forcing and monsoon driven variability on a multi-millennial time scale. Modifications of this overall trend are observed on the finer temporal resolution and we suggest that solar activity could be an important mechanism driving the centennial-scale variability. It may have a strengthened effect in the late Holocene when the monsoon influence weakened.”
14. Luoto and Nevalainen, 2017 “Here,https://notrickszone.com/wp-content/uploads/2017/05/Holocene-Cooling-Greenland-Ice-Sheet-Zhang-2017.jpg we use completely synchronized paleolimnological proxy-based records of air temperature and effective precipitation from two Scandinavian lakes with ∼2000-year sediment profiles. We show that the relationship between air temperature and precipitation (T/P ratio) is synchronous in both study sites throughout the records suggesting warm and dry conditions at ∼300–1100 CE and cold and wet conditions at ∼1200–1900 CE. Owing to the significantly increased air temperatures, the most recent T/P ratio has again turned positive. During the first millennium of the Common Era, the T/P mimics patterns in Southern Oscillation index, whereas the second millennium shows response to the NAO index but is also concurrent with solar irradiance shifts. [T]he causes for the LIA [Little Ice Age [1200-1900 CE], are not well defined owing to its highly variable nature (Wanner et al. 2011; Luoto and Nevalainen 2016; Zawiska et al. 2017). Yet, in addition to a persistent strongly negative NAO index phase during the LIA, it was most likely forced by decreased solar irradiance (including Spörer, Maunder and Dalton solar minima), increased volcanic activity (aerosols), and changes in Atlantic Ocean circulation patterns (Grove 2001; Goosse et al. 2005; Wanner et al. 2011).”


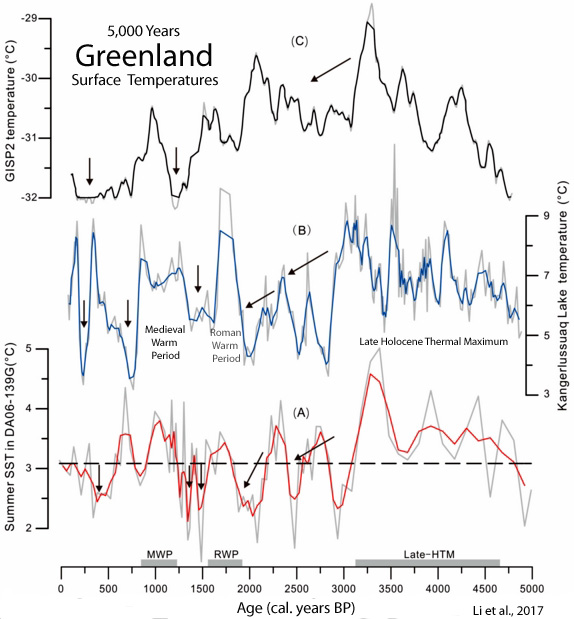
15. Li et al., 2017 “Correlations between paleotemperature records from the North Atlantic and solar activity suggest that changes in solar output may cause significant shifts in the climate of the North Atlantic region. To test the role of solar activity on summer SST at our study site in West Greenland, we conducted a cross-correlation analysis between our reconstructed summer SST record and a total solar irradiance (TSI) series. The results indicate that the maximum correlation coefficient (0.284) of summer SST [sea surface temperatures] and TSI [total solar irradiance] records is obtained at nearly zero time-lag (-6 time-lag), which means that variations in solar activity affected the summer SST variability in the study area. … A significant positive relationship between summer SSTs on the North Icelandic shelf and solar irradiance reconstructed from 10Be and 14C records during the Holocene was also demonstrated by Jiang et al. This finding is also supported by recent climate model simulations using the Community Climate System Model version 4 (CCSM4). The model results show a strong positive correlation between SST and solar irradiance in the pathway of the IC, indicating that a reduced frequency of Atlantic blocking events during periods of high solar irradiance promotes warmer and saltier conditions in the pathway of the IC due to stronger circulation of the subpolar gyre. … Spectral analyses indicate that significant centennial-scale variations are superimposed on the long-term orbital trend. The dominant periodicities are 529, 410, and 191 years, which may be linked to the well-known 512- and 206-year solar cycles. Cross-correlation analyses between the summer SSTs and total solar irradiance through the last 5000 years indicate that the records are in phase, providing evidence that variations in solar activity impacted regional summer SST variability. Overall, the strong linkage between solar variability and summer SSTs is not only of regional significance, but is also consistent over the entire North Atlantic region.”
16. Orme et al., 2017 “The north-south index shows that storm tracks moved from a southern position to higher latitudes over the past 4000 yr, likely driven by a change from meridional to zonal atmospheric circulation, associated with a negative to positive North Atlantic Oscillation shift. We suggest that gradual polar cooling (caused by decreasing solar insolation in summer and amplified by sea-ice feedbacks) and mid-latitude warming (caused by increasing winter insolation) drove a steepening of the winter latitudinal temperature gradient through the late Holocene, resulting in the observed change to a more northern winter storm track.”
17. Serykh and Sonechkin, 2017 “The global climate is a quasi-periodically forced dynamic system [1, 2]. In addition to the annual cycle of the heat transport from the Sun and the diurnal cycle of the Earth’s rotation, other external periodical forces exist, which are potentially able to cause climate fluctuations. The lunar and solar tides are such causes on the time scales of the order of one day. On the decadal scale, these causes are 11-year variations in the Sun spots (the Wolf cycle) and its double period manifested in the changes in the heliospheric field polarity (the Hale cycle). The existence of secular solar cycles is also possible (Gleissberg and Suess cycles found in a number of Sun spots). Calculations indicate that an approximately 180-year cycle exists in the rotation of the Sun around the center of mass of the Solar system. The authors of [3] suggest that it is related to the sequence of significant decreases in the solar activity in the last millennium known as the Oort, Wolf, Spörer, Maunder, and Dalton periods. Paleoclimatic evidence of climate cooling during these periods exists. We can conclude on this basis that the ONI [ENSO index] dynamics [are] governed predominantly by two periodical external forces (the annual heat transport to the climatic system from the Sun and the Chandler wobble of the Earth’s poles) and that the system is not chaotic. This fact indicates that a principal possibility exists for long-term (many years in advance) ENSO forecasts.”
18. Kitaba et al., 2017 “The weakening of the geomagnetic field causes an increase in galactic cosmic ray (GCR) flux. Some researchers argue that enhanced GCR flux might lead to a climatic cooling by increasing low cloud formation, which enhances albedo (umbrella effect). Recent studies have reported geological evidence for a link between weakened geomagnetic field and climatic cooling. … Greater terrestrial cooling indicates that a reduction of insolation [solar radiation reaching the surface] is playing a key role in the link between the weakening of the geomagnetic field and climatic cooling. The most likely candidate for the mechanism seems to be the increased albedo of the umbrella effect.”
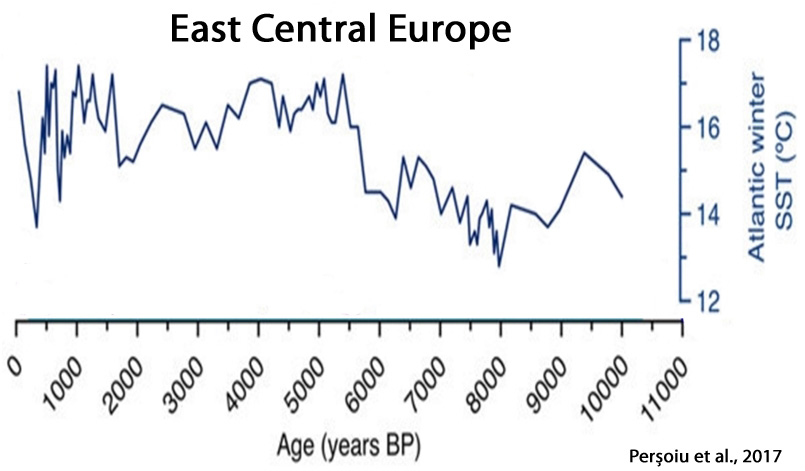
19. Perșoiu et al., 2017 “Throughout the Holocene, the subterranean ice block in Scărișoara Ice Cave responded sensitively to changes in both winter temperature and moisture source. During this time period, winter temperature in ECE [East Central Europe] was mainly controlled by insolation [solar radiation] changes. The interplay between insolation variability, SST changes in the North Atlantic, and the influence of the lingering Laurentide Ice Sheet modulated the dynamics of large-scale atmospheric circulation.”


Ouch, this article will hurt the faux climate change folk’s.
Nov 28, 2016 Weather is NOT Climate!
No, weather is NOT climate…even when it’s warm outside. But in case there’s a climate cultist in your life that insists otherwise, here are some facts about global warming and vaguely-defined “extreme” weather that you can use to talk some sense into them.
https://youtu.be/sT4133vfTmk
From the very first paper linked here:
And thank you for linking to the Harde 2017 paper. Have you actually read it? If you still have doubts on the ocean heat content increasing because of a change in the GHE, the explaination including all equations is in there. You emphasized section of the quote is also interesting, since this all is from model calculations which you don’t believe to be true, because no experiment exists. How can you be ok with the result then? It’s all assumptions after all, right? Or do you actually think the author is “on to something” like those “it’s the density and not the GHE that determines surface temperatures” authors?
I bet there are – as always – lots of gems in those papers listed here that you likely overread.
Yes, the direct response to the solar cycle is assumed to be very small, smaller than the models say about the response from CO2. And then you conveniently excluded the very next sentence in which the authors introduce what the paper is actually about:
“However, despite the very small global mean temperature response to SC [solar cycle] forcing there is mounting evidence that regional signals associated with the SC can be much larger, due to the presence of positive feedbacks involving atmospheric wavemean flow interactions and/or atmosphere-ocean coupling (e.g. Bjerknes feedback). In the following, we review proposed positive feedbacks that may amplify SC influences in the tropical Pacific and North Atlantic Ocean.”
Did you even read the abstract of the paper, SebastianH? It says the same thing:
“Although the direct response to the Sun’s variability is extremely small, a number of different mechanisms have been suggested that could amplify the signal, resulting in regional signals that are much larger than expected … via modulation of the ultraviolet part of the solar spectrum that influences ozone production in the stratosphere.”
Although this may be new information to you, this is not new information. Solar scientists have been writing about the regional effects of amplified responses to variations in the solar cycle for quite some time. For example:
Moreno et al., 2016
“The major external forcing of the climate system derives from the Sun. A solar signature has been found in global mean surface temperatures, with evidence directly related to two noticeably different features of the Sun’s dynamics: its short-term irradiance fluctuations and secular patterns of 22-year and 11-year cycles (Scafetta and West, 2008). … [I]t is recognized that solar forcing manifestations denote a strong spatial and seasonal variability (Usoskin et al., 2006), and this would be the reason why it might be illusive to seek a single global relationship between climate and solar activity (de Jager, 2005). Thus, Le Mouël et al. (2009) stated that a regional approach may allow one to identify specific forms of solar forcing, where and when the solar input is most important. … [S]olar footprints on terrestrial temperatures [are] due to the strong non-linear hydrodynamic interactions across the Earth’s surface, and the accepted longerterm solar activity influence creating temperature oscillations for tens or even hundreds of years (Scafetta and West, 2003, 2007, 2008).”
I read the paper. It’s the same argument that AGW proponents make for CO2: local feedback, amplification, etc. The Harde paper lists some of those feedbacks for both.
Of course the Sun has a major influence as it is the energy source for everything. It’s cycles will always be visible in climate data, why wouldn’t they? It’s a bit like these graphs: http://imgur.com/a/eJFf9
Spot the difference between those patterns?
“make for CO2: local feedback, amplification,”
What do you get when you amplify ZERO ??
No CO2 warming in a convective atmosphere or of ocean water.
.. I thought you would have KNOWN by now.
You must be a VERY slow learner, seb.
Then why did you selectively quote a part of the paper that gave the false impression that the direct forcing from the solar cycle is the only means by which the Sun influences climate variations when the paper was clearly about the indirect (and significant) responsive effects of the solar cycle to climate changes?
This is a rhetorical question, of course. We all know the reason why you did this.
Here is the quote again:
Where do you get the idea that this gives a false impression? It clearly says that the mean surface warming is small/modest compared to anthropogenic forcing. A mean generally includes all extremes, doesn’t it?
As I have repeated twice now, because the paper is about the INDIRECT ways in which the solar cycle may significantly influence the Earth’s climate, not the DIRECT ways that the solar cycle may do so, which is admittedly not as influential as the INDIRECT ways…nor the modeled estimations of the anthropogenic influence. You carefully chose to exclude the next sentence which specified this, giving the impression that the paper was about how weak the Sun’s influence was on the climate relative to anthropogenic forcing. That’s misleading and false representation…as is your habit. I don’t know how this could be any clearer.
Your behavior here is consistently about dishonest representation…whether it’s putting words into other’s mouths or purposely misrepresenting what a paper says. Do you consider yourself an honest person, SebastianH?
Seb, your next comments will be monitored more closely.
“…because the paper is about the INDIRECT ways in which the solar cycle may significantly influence the Earth’s climate…”
The Gray paper talks about the solar cycle impact on the Pacific and Atlantic.
“Composite and regression analyses of surface temperature observations over the last century show a strong cooling in the East Pacific in peak years of solar maximum, with amplitude of about 1K at lag zero.”
“A positive pressure anomaly of up to 3 hPa difference between Smax/Smin is evident over the Azores region [in the Atlantic]. This pattern of SC mslp response, and the corresponding sea surface temperature response is consistent with a positive NAO anomaly approximately a quarter cycle (3-4 years) following solar maximum. … If this mechanism operates in the atmosphere then, on average, one would expect a warmer, more disturbed polar vortex with more frequent SSWs in Smin years than in Smax years.” (Disruptions in the polar vortex cause cold snaps over Europe and North America during the winter.)
The important thing is the solar cycle repeats. There is no trend up or down. I’ve seen this effect talked about as the cause of the LIA, which was more pronounced in Europe.
The more we know about the various forcings the better but nothing about the solar cycle takes away from the greenhouse effect in general and specifically the impact of the steady rise in CO2.
You are quite welcome…although I’m not sure why you are so grateful for its inclusion. Do you now agree with Harde that human emissions only contributed 15% to the increase in CO2 concentration since industrial times, or with these quotes from the paper that affirm the solar influence is much, much larger than the IPCC alleges?
1. “[A] naturally generated [CO2 emission] contributes more than 95% to the overall emission, and its generation rate and the respective absorption rate sensitively respond on global temperature variations”
–
2. “[The] well known delayed response of CO2 and methane (CH4) to sea and air temperature changes (see, e.g., Petit et al. [2]; Monnin et al. [3]; Caillon et al. [4]; Torn and Harte [5]; Humlum et al. [6]; Salby [7]) are not considered in AR5″
–
3. “The IPCC denies any noticeable solar influence on the actual climate, although strong evidence of an increasing solar activity over the last century exists (see, e.g., Hoyt & Schatten [8]; Willson & Mordvinov [9]; Shapiro et al. [10]; Ziskin & Shaviv [11]; Scafetta & Willson [12]; Usoskin et al. [13]; Zhao & Feng [14]; Soon et al. [15])”
–
4. “As long as any natural variations in the CO2 concentrations are not accurately known, the ECS [equilibrium climate sensitivity to CO2 doubling] cannot be used as a reliable indicator only for an anthropogenic global warming.”
—
Also, can we now assume you agree with Harde that the climate’s sensitivity to doubled CO2 (560 ppm) is just 0.7 C, the effects of solar radiation changes and its modification of cloud are more influential, and CO2 contributed just 0.3 C to the temperature change since 1880, whereas the solar contribution was 0.44 C?
—
1. “From these studies we conclude that the measured temperature increase of 0.74∘ C over the time 1880–2000 and the observed cloud changes of −4% over the period 1983– 2000 can best be explained by a cloud feedback mechanism, which is dominated by the solar influence”
–
2. “Therefore, it seems quite reasonable to use a model mean of [climate sensitivity to doubled CO2] = 0.7∘C, yielding a CO2 initiated warming of 0.3∘C [1880-2000] and a solar contribution of 0.44∘C [1880-2000].”
There is no observational “explanation” for net ocean heat content changes due to changes in CO2 concentrations.
And here I thought you were accusing me of putting words in your mouth … wth is wrong with you?
You are referencing a paper with many equations that you generally chose to ignore, because models, no experiment, blabla and yet still agree with the conclusion. That’s remarkable, I guess the end really justifies the means.
Huh? You’re the one who thanked me for referencing a paper that says CO2 (of which it is clarified that 95% comes from natural sources) contributed just 0.3 C to the temperature change since 1880, with the rest of the temperature change natural, or due to solar forcing. So do you agree with Harde that that’s all the CO2 forcing has contributed since 1880 or not?
So in your opinion I should have provided a paper summary with emboldened text of the “many equations” in the paper?
I didn’t say I agreed with Harde that the CO2-forced temperature change since 1880 was just 0.3 C. (I think it’s likely less than that.) All I did was copy/paste the conclusion due to user-friendly/easy-access purposes. It’s a very lengthy paper and condensing all that into readable soundbites isn’t the easiest thing in the world to do.
Why did you make the false claim that the paper “explains” the CO2 forcing of ocean heat content changes when it most certainly does no such thing? Why make false claims like that, SebastianH?
“Why make false claims like that, SebastianH?”
False Claims is ALL seb has left, that’s why.
Kenneth,
I thanked you for a specific reason and I have explained that reason above. I don’t agree with the conclusions of Harde, especially not those in the paper you linked to where he claims that CO2 from human emissions only contribute 15% to the total increase. That’s been already debunked back in February.
You are making things up and yet you accuse me of wrongly interpreting what you write in other threads. Wth!
No, wasn’t that clear enough either? The paper includes equations for radiation transfers and tables with the results. In other comments when discussion OHC change you generally ignore this or write “it’s only models”, but in this instance you find it ok to reference it, since the result suits your point that CO2 might not have caused 100% of the warming.
So these lists are for information purposes only? Why are they so onesided then?
The radiation transfer calculations in this paper “explain” it. Since you don’t think that radiation works this way, you should reject this particular paper, since the conclusion is based on that.
KR: “Why did you make the false claim that the paper “explains” the CO2 forcing of ocean heat content changes when it most certainly does no such thing?”
No, the radiative transfer calculations are models and do not specifically reference ocean heat content changes in particular or observational evidence from real world data. So again, you just made up a false claim and don’t like the fact that you have been caught (again) doing so.
The paper’s conclusion based on radiative forcing modeling is that CO2 concentration changes only caused 0.3 C of warming since 1880, and even when/if we reach 560 ppm (doubled CO2), it’ll only be 0.7 C of warming. Most warming is caused naturally. Again, that’s the conclusion. And that supports a skeptical position. Again, I don’t see why you are so grateful for this paper’s inclusion, especially since you already knew that this particular scientists does not agree with you that 100% of CO2 changes are human-caused, and that even most CO2 changes are natural.
They describe the mechanism that heats the surface. The one that you think does exist because it has “never measured for CO2” (but for other variations in downwelling radiation).
Because it shows how you are able to accept a paper’s conclusion even though everything is based on models. Models that you rejected to be true multiple times.
So you have a problem with me expecting physical measurements from real-world observations or scientific experiments to agree that reducing CO2 concentrations by -0.00001 (10 ppm) over a body of water causes that body of water to cool down by ____ Celsius (what is it?). You think I should just accept that the models of what we think might happen if we reduced CO2 by -0.00001 (10 ppm) are “true” and sufficient to qualify as “the laws of physics”, and therefore anyone who questions the “truth” of these theoretical models deserves to be called a “truth” denier and conspiracy theorist.
And yet you are here claiming that you have real-world science and observation on your side?
[…] 20 More New Papers Link Solar Forcing To Climate […]
All these scientific papers and still they religiously cling to their faith of AGW and humans’ (as separate from nature) causing the climate to change.
It’s not faith. Also: all the scientific papers and you still think humans have no influence?
“It’s not faith.”
So what do you call it when you believe something to be true that has never been observed in the real world (changing airborne CO2 by +/- 0.000001 over a body of water causes heat changes in that body of water)? You’ve already acknowledged that what you believe has never been subjected to a real-world experiment. So why do you believe anyway?
Exactly!
AGW advocates seek not to use science to expand our understanding of nature but to limit the science to their mistaken beliefs.
There is no coherent explanation of the totality of our climate but these advocate are happy to stay put in their very limited and faulty understanding of what they believe to be true.
This is the travesty of the whole AGW endeavor – reducing science to just a catalog of what they believe are facts, and not an imaginative expansion of mankind’s knowledge in attempting to understanding this planet’s dynamic and nonlinear climate.
To progress science we are “Not here to worship what is known, but to question it” – Jacob Bronowski.
Imaginative or imagination is a good keyword here. That’s what “skeptics physics” certainly have been, maybe they are on to something.
Sorry, you sound exactly like those guys who claimed their cars could run on water or use less gas when adding a device that splits water into hydrogen and oxygen and pipe the hydrogen back to the engine … or someone who just invented a perpetuum mobile and doesn’t understand why his “science” is not progress.
Another idiotic strawman from seb.
Poor little worm lives in a gullible brain-washed anti-science state of fantasy, that bears little to no relationship with reality.
You can tell that, because all he has left is empty, pointless, yapping (chasing a bouncing ball behind a fence like a demented chihuahua), and moronic irrelevant analogies.
Seb,
You sound like an AGW religious adherent, with all your belief (for that is all you have) in CO2 heating the atmosphere when your religion can not (scientifically) explain clouds.
Why not look here — Atmospheric Ionization and Clouds as Links Between Solar Activity and Climate Brian A. Tinsley1 and Fangqun Yu2
http://www.klimarealistene.com/web-content/Bibliografi/Tinsley2007,GlobalElectricCircuit.pdf
Oh dear, weather and climate effects that do not need CO2 — https://youtu.be/2rVdEhyMR6A
Also the amount of power these experimenters get into this fan from atmospheric current. Surely this power can alter a cloud.
https://youtu.be/ENeDkGce5-4
And of course this does not stop some beliefs, such as “They believe the effect may be due to the charging of small droplets in the cloud’s base, which encourages them to stick together.”
http://physicsworld.com/cws/article/news/2013/mar/06/atmospheric-electricity-affects-cloud-height
Of course you can’t look here as it offend your UN elites’ (religious) commandments —
https://wattsupwiththat.com/2017/06/10/indirect-effects-of-the-sun-of-earths-climate/
And you can never ever look (and I suspect understand) physicists Ned Nikolov and Karl Zeller and their ability to show that the ‘greenhouse effect’ is not a phenomenon arising out of the absorption and re-emission of outgoing long-wave radiation by the atmosphere (as thought for 190 years), but is a form of compression heating controlled by solar radiation and the total atmospheric pressure at the Earth’s surface. Pressure is in turn a product of the gas mass contained in a column of air above a unit surface area, and the planet’s gravitational effect on that mass.
Their paper ‘New Insights on the Physical Nature of the Atmospheric Greenhouse Effect Deduced from an Empirical Planetary Temperature Model’, is freely available here —
https://www.omicsonline.org/open-access/new-insights-on-the-physical-nature-of-the-atmospheric-greenhouse-effect-deduced-from-an-empirical-planetary-temperature-model.php?aid=88574
Let’s turn this around … why do you believe that physics are special with bodies of water? Even though heat content buildup has been observed on changes of downwelling radiation and it has been measured that CO2 causes downwelling radiation.
You are proposing that downwelling radiation from CO2 has no effect on ocean heat content because it hasn’t been observed yet. Your words, correct? Therefor the opposite must be true or so you believe, correct? I’d call that an argument from ignorance, but you could also call that faith in humans not being responsible.
P.S.: I “believe” that a ball thrown behind a brick wall will fall to the ground, even though I have never observed it. Call it “ball physics faith”.
What does “physics are special with bodies of water” mean?
Again, we have no real-world scientific evidence that varying CO2 concentrations in volumes of +/- 0.000001 cause heat changes in bodies of water, not to mention any physical measurements of how much of a change would ensue from, say, a -0.00001 (-10 ppm) drop in CO2 concentration. It’s all theoretical, based on models, not the real world. You have yourself acknowledged that CO2-cools-water-when-reduced is a non-real-world, theoretical conceptualization. So why do you insist on pretending that something that has not been observed in the real world is nonetheless “the laws of physics”?
I don’t know how often I can and should repeat this: the laws of physics are tools. You can use them to calculate stuff from known variables/measurements. We do this all the time, why is it so hard for you to accept that those calculations are correct and do represent what happens in the real world? Why do you believe that CO2 over water behaves different than what is expected? Do you think there is some kind of new physics hidden in this interaction? The world would be very surprised and I am sure a Nobel prize is waiting for something like that.
But enough with this discussion, it leads nowhere. You are entrenched in that opinion of yours and what can’t be, can’t be. I understand.
That’s the problem. We have no “known” measurements of how much cooling occurs in the 0-2000 m ocean — or any body of water — when CO2 concentrations are reduced by, say, -0.00001. Therefore, any calculation based on a non-observed unknown is little more than speculation.
Because they are calculations based on something that has never been observed in the real world. When we perform calculations using amounts that are not based on physical measurements, but on hypotheticals and assumptions and guesses, it precludes the possibility that we can say our calculations are “correct”.
See this post.
https://notrickszone.com/2017/03/13/uncertainties-errors-in-radiative-forcing-estimates-10-100-times-larger-than-entire-radiative-effect-of-increasing-co2/
Even the IPCC acknowledges that the uncertainty and errors in our heat flux calculations are at least 10 times greater than the “calculated” CO2 forcing value itself! If the TOA radiative balance for 2000-2010 was 0.6 W m-2 on average (Stephens et al., 2012), but the uncertainty/error in that calculation was 17 W m-2 (Stephens et al., 2012), then any confidence that the 0.6 W m-2 estimation is “correct” must only come from a leap of faith. Obviously, you are prone to leaping. I, on the other hand, will continue to focus on that uncertainty value. That’s why you’re the believer and I’m the skeptic.
Physics over water behaves exactly as physics says it should, ie LW radiation does NOT cause warming.
Your problem, seb, is your base-level IGNORANCE of any real physics.
An experiment for you, AndyG55:
– setup a closed container and fill it with water
– measure the temperature of that water
– add a heating element to the water with fixed wattage
– continue to measure the temperature and wait until it reaches an equilibrium
– now increase the insulation of your container (add a layer of material) and continue to measure the temperature.
How do you expect those temperatures to change after you increased the insulation? That’s the physics at play.
Atmospheric CO2 molecules spaced apart 1/10,000ths (0.0001) more closely than they were spaced apart 100 years ago do not function like “a layer of material” insulating a container of water.
Your analogy has nothing to do with what happens in the real-world atmosphere.
seb thinks the atmosphere or the ocean is a close container. ROLFLMAO
seb thinks there is an internal heater in the ocean or the atmosphere.. ROFLMAO
seb thinks the atmosphere , which PROMOTES cooling of the surface, is an insulator. ROFLMAO
Seb.. LEARN SOMETHING before you post any more NONSENSE that shows your MORONIC LACK OF UNDERSTANDING of anything to do with science or physics.
You are an embarrassment to AGW cultists the world over.
Adding CO2 DOES NOT increase insulation properties.
CO2 has been shown scientifically to TRANSMIT energy more readily than normal air.
You live in an ANTI-SCIENCE FANTASY, seb.. brought about by massive gullibility and a cult belief in anti-science religion.
You are ABSOLUTELY NOTHING but a brain-washed, negative-knowledge, AGW evangelist.
@SebastianH 14. June 2017 at 1:02 AM
“An experiment for you, AndyG55:
– setup a closed container and fill it with water
– measure the temperature of that water
– add a heating element to the water with fixed wattage
…”
Is not representative of your AGW religion, surely the heater has to be a variable output (representing day/night and seasonal changes) and above the water, i.e. representing the atmosphere heating the water, or do you believe that the water heats the atmosphere? (Sorry but it is hard to keep up with your anti-science twists and turns!).
PS. By and large, the processes involved in climate have multiple feedback paths, are loosely coupled, and are nonlinear in nature. In all other aspects your experiment is perfect. Perfect that is at not representing the real conditions and processes of this planet.
Kenneth:
The whole atmosphere is a layer of insulation and infrared absorbing molecules are causing the radiative insulation effect. The fact that those molecules are spaces apart isn’t a convincing argument that the don’t absorb radiation. We all know the atmospheric window for LW radiation is pretty small … at least I hope we do.
@AndyG55:
Glad that you are laughing. Doesn’t make you right, though and the insults aren’t helping.
@tom0mason:
You can design a heater with variable output for such an experiment. Doesn’t matter, what matters that it’s output isn’t depending on the temperature of it’s surroundings. The heater has to be in the water, since SW radiation from the Sun is also heating the water.
This demonstrates how insulation works which is apparently unknown to some of the commenters here.
So Nitrogen (780,000 ppm), Oxygen (210,000 ppm), and Argon (9,300 ppm) are atmospheric insullators causing the radiative insulation effect?
I didn’t write that atmospheric molecules are spaced apart, and therefore they don’t absorb radiation. (And you know that I didn’t write that. You dishonestly made up a straw man argument. Again.)
I wrote that CO2 molecules are spaced apart only 1/10,000ths more closely than they were 100 years ago. That is a volume that is not comparable or analogous to putting insulating material around a container vs. putting no insulating material around a container.
So you believe that CO2 molecules that are spaced apart 1/10,000ths more closely than they were 100 years ago are the dominant cause of the 0-2000 m layer heating up by 0.09 C since 1955, and that this is “how insulation works”, and those who question this characterization of how insulation works in the atmosphere and oceans are misinformed, “deniers” of truth, and “cornered conspiracy theorists”. Is this correct?
Sebastian, Andy doesn’t need to do the IR HEAT lamp experiment. It’s been done and warmed the water quite well. I’ll post the paper when I get home.
Great! Does the IR HEAT specifically come from CO2 in this experiment, with all other potential causal factors removed?
“Glad that you are laughing. Doesn’t make you right, though and the insults aren’t helping.”
CRY-BABY seb…
no insults, just the truth.
But we all that “you can’t handle the truth”, especially about yourself.
And yes, I am correct.. Get over it.
You seem to have not much understanding about how the atmosphere works, you poor ignorant trollette.
Insulation that COOLS the surface when it gets warm.. roflmao.!!!
Insulation that actually PROMOTES air movement.
Very strange sort of FANTASY insulation, wouldn’t you agree, seb.
Kenneth,
Are those infrared absorbing molecules? Until now I thought those gases are inert towards IR.
Ok then, just increase the insulation of your container in the experiment. However, the container material is already insulating, so adding any more insulation has the same effect: increasing insulation instead of no insulation vs. some insulation
Believe? I calculated that for you once from the supposed forcing of increased CO2 from the 50s until now. The additional energy matches the heat content buildup and therefor it is a very good candidate when searching for the cause of the buildup. Your belief (see I got it) seems to be that this is impossible and you can’t really show why, instead asking me for proof that CO2 could really do that (have any forcing) over and over again.
Do you think that GHGs in the atmosphere do not work like insulation does?
@AndyG55:
You are taking this too literally. Of course there are other means of energy transfers between the surface and the atmosphere, when I am writing that GHGs insulate than I am writing of the radiative effects. Since – when asked – are never able to come up with actual number of how much W/m² evaporation and convection actually transport away from the surface compared to radiation, I am beginning to think you know the answer, but can’t write it down, because it would show something different than what you believe. Correct? 😉
You wrote: “The whole atmosphere is a layer of insulation and infrared absorbing molecules are causing the radiative insulation effect.” My question: So Nitrogen and Oxygen and Argon function as insulators?
It’s hopeless. THE ATMOSPHERE IS NOT A CONTAINER, AND THE 1/10,000ths CHANGE IN CO2 DENSITY SINCE 1900 DOES NOT MEAN CO2 NOW FUNCTIONS JUST LIKE INSULATING MATERIAL AROUND A CONTAINER.
While it’s easy to find infrared heaters designed to heat water (https://www.quartzinfrared.com/References/applications_of_electric_infrared_heating.pdf) it is difficult to find a paper that documents water being heated using longwave radiation. (Then again, I’ve never seen a paper document latent heat in water vapor.) Below is from a paper on research into convection currents which used a ceramic infrared heat source to create convection.
HORIZONTAL CONVECTION IN WATER HEATED BY INFRARED RADIATION AND COOLED BY EVAPORATION: SCALING ANALYSIS AND EXPERIMENTAL RESULTS
Wahlin et al., 2009
http://journals.co-action.net/index.php/tellusa/article/view/15675/0
“Fresh water was heated from above by an infrared lamp placed at one end of a tank, and cooled by evaporation as the water moved away from the heat source. The heat radiated from the lamp was absorbed in a thin (less than 1 mm) layer next to the surface, and then advected and diffused away from the lamp region.”
“Of the infrared radiation incident at the water surface, 6% was reflected and the remaining was absorbed by the water. Over 99% was absorbed within the first millimetre of the surface layer.”
“Immediately after switching on the lamp the downward diffusion of heat dominates over the latent heat loss. However, the temperature gradient at the surface, and thereby the downward diffusion of heat, decreases with time while the latent heat loss increases with time or is constant (after the surface has reached its equilibrium temperature).”
“As [the water] moved away from the lamp the current cooled, accelerated and thickened. …When it reached the far wall it sank and returned toward the lamp end as a deeper return flow, which slowed down and became thinner as the lamp was approached. Hence there was an upwelling of fluid from the lower layer to the surface layer in the region where the current accelerated.”
Even though water absorbs longwave radiation at the surface conduction and convection spreads the energy deeper into the ocean.
Sigh. No mention of CO2 as a variable. Again.
Yawn, convection and conduction dominate and control the lower atmosphere.
Radiation is a bit player easily compensated for by the dominant convection and conduction.
It has been shown that CO2 does not radiate below about 11km because of thermalisation to the remaining 99.96% of the atmosphere.
Water DOES NOT absorb long wave radiation, certainly not in the tiny thin band that CO2 could emit, that is a fantasy of the brain-washed anti-COP2 anti-science cult.
You are STILL totally empty of ANY PROOF WHATSOEVER that CO2 causes ocean warming or warming of a convective atmosphere.
EMPTY.. like a total vacuum. !!
Craig T
What proportion of radiation from the ceramic heater was visible light?
they say “In both tanks the walls and bottom were made of glass, 1 cm thick, that were insulated with 4.8-cm-thick styrofoam plates.”
Inside the glass or outside? doesn’t say?
If lined. how did the camera “see”
What temperature did the heating source reach?
Did it allow proper convection under the lamp?
Closed tank ? that’s realistic. 😉
Why not use an infrared laser, so that realistic atmospheric temperatures are reached. 😉
All this shows is that if you apply enough heat you can overcome natural evaporative cooling from longwave radiation.
That’s not going to happen anywhere over any ocean.
You can make a pig fly , too, with a big enough slingshot !! (that’s a meaningless analogy to amuse seb.)
Looks like they are applying a temperature of 600K (Kelvin) to 800K within a cm or so of the surface.
ROFLMAO..
Give me a big enough slingshot, I’ll put a cow over the moon !!!
Any more TOTALLY UNREALISTIC representations, Craig. ?
“What proportion of radiation from the ceramic heater was visible light?”
None whatsoever. Electric elements inside warm the ceramic heater, which then gives off infrared. And don’t forget that water is transparent to visible light.
“Water DOES NOT absorb long wave radiation, certainly not in the tiny thin band that CO2 could emit, that is a fantasy of the brain-washed anti-COP2 anti-science cult.”
Water is opaque to longwave radiation, completely absorbing it in the top millimeter of the surface. C02 emits at 500-820cm-1 (12-20 microns.) In 1956 M. Ceccaldi published a paper finding “… a sharp DO-band at 16.8 microns and indications of an HDO-band near 15 microns. These bands only exist in the liquid state and must probably be attributed to intermolecular vibrations.” Gilbert Plass found the same thing that year. The fact that CO2 emitted in a range that water vapor did not was what led Plass to revive the idea that CO2 could influence climate.
http://www.iaea.org/inis/collection/NCLCollectionStore/_Public/38/054/38054598.pdf
http://onlinelibrary.wiley.com/doi/10.1111/j.2153-3490.1956.tb01206.x/epdf
“Why not use an infrared laser, so that realistic atmospheric temperatures are reached.”
https://www.researchgate.net/publication/235974689_Explosive_boiling_of_water_after_pulsed_IR_laser_heating
“Radiation is a bit player easily compensated for by the dominant convection and conduction.”
I thought we all agreed that the radiative energy from the sun drove climate. Water gives off radiant energy and is cooled by the loss. Downward longwave radiation reduces the net loss and so the cooling. On the equator during a strong El Nino the net loss of LWR is reduced to almost zero.
In the experiment using the heat lamp the water absorbed more LWR than it emitted. There was no shortwave radiation so it was far from a copy of the ocean during the day, but it’s another documentation of the fact that longwave radiation can warm water.
“It’s not faith.”
BULLS**T..
You can’t even provide scientific proof of the very basis of the whole AGW religuion.
OF COURSE its only unfounded BELIEF, and brain-washed CULT FAITH.
Why are people like you so afraid to consider any alternative hypothesis/theory? Blinkered, barely begins to describe your state of mind Seb. It’s as if you almost want the world to be rendered uninhabitable by some means or other.
Give me an alternative hypothesis/theory (for what exactly? The GHE? The increase in CO2 concentration?) that doesn’t collaps when examined and I might consider or even accept it. So far nothing!
How do you get from not considering weird theories about how physics might work (recall that Ammendinger paper in one of the last posts?) to wanting Earth to be uninhabitable?
No weird theories needed, just a proper understanding of what is actually happening in physics.
Seb , your understanding of physics is very much on the negative side of the ledger..
ie basically everything you think you know is monumentally WRONG.
So far , you cannot even support the very basis of your AGW cult religion.
No science that proves that CO2 causes warming of oceans, or of a convective atmosphere.
All you have is empty, blind, irrational, ignorant, brain-washed religious belief..
Science has rapidly become a faith for so many.
Science is nothing but a human concoction, seeking as it does, to find our limited interpretation of the basic truths of this natural universe, and mankind’s place in it. Our understanding of this natural universe will always be inaccurate and incomplete, as science is only a continuous process of improving approximations.
Some mistakenly believe that humans with their limited communication skills, and very limited technology have moved beyond nature’s grasp. This of course is wrong, man and his endeavors are part of this nature, and as far as can be assessed follows a natural path.
The pursuit of science however, for too many individuals, has become some method by which these people BELIEVE it will prove that humans are in charge of nature and not the other ways about. Or at least it is able to explain most of our universe’s nature. This, of course, is another fallacy. We can not even coherently explain the basic fundamentals of our universe, or prove that our theories are correct. (E.g. scientifically explain time, why it passes as it does and what are its limitations).
We are not and never have been in charge. Specifically humans in all their actions, are influenced by and because of nature, and it has always been such.
So, do human’s influenced the climate? — Of course we do as we are part of the natural biology of the planet. From the earliest times we have. But climate has, over the centuries, massively affected mankind and his endeavors.
Are we affecting the climate detrimentally, beyond what nature can tolerate? — No as we are too small and ineffectual to perform such a task! Just look at the massive forces nature can use to reset any perceived ‘unbalance’, an ‘unbalance’ that nature defines, not us.
Has the recent rise in CO2 levels happened because of humans? — Very, very unlikely — other bigger natural forces control such things, and science has to yet prove otherwise. People who think otherwise appear to be suffering from a mad hubristic belief built upon human’s poor communications and even worse technology.
Can CO2 warm our damp and dynamic atmosphere (below the tropopause)? — Very, very, very unlikely as our damp atmosphere is not a rigid structure, it is always on the move, and thus dissipates solar energy through that mechanism.
The philosophy of science is a worthy endeavor for us as it holds the tools to improve our lives in many ways. However science is not a list of known facts, but an accumulation of approximations that seek to explain our universe. As such these approximations are always inaccurate and incomplete, thus they must always be questioned. As Jacob Bronowski said “Not here to worship what is known, but to question it”
Ehm, that’s already certain. If you claim that the increase in CO2 concentration happened naturally, you are the one who has to prove it.
Insulation is insulation. It doesn’t matter what happens internally. They only working argument that it’s not insulating that much is that higher surface temperature cause more evaporation and transfer of heat towards the atmosphere, providing a negative feedback. And this feedback doesn’t compensate the complete effect a better insulation (more GHGs) has (give me numbers if you don’t agree).
I agree and they are. But trying to explain stuff with magic or with explainations going against all know laws of physics, isn’t the way to go. You’ll get called “science denier”, “nutter”, etc … Galileo didn’t just invent something because he didn’t like the Sun going around Earth. If you want to challenge accepted science at least do it with some kind of proof …
“If you want to challenge accepted science at least do it with some kind of proof…”
It is YOU that is totally EMPTY of any sort of proof.
Still EMPTY.. no proof that CO2 causes warming over water, or of a convective atmosphere.
EMPTY, BLIND and gullible brain-washing is all you have.
CO2 DOES NOT provide any “insulation” it has in fact been shown to transmit energy better than normal air.
Your “insulation ” analogy is just as pointless and meaningless as any of your other pointless idiotic anti-science analogies, and shows that you have basically ZERO idea how the atmosphere acts to COOL the surface.
seb,
“Ehm, that’s already certain. If you claim that the increase in CO2 concentration happened naturally, you are the one who has to prove it.”
NO! Fool!
YOU HAVE TO PROVE THAT IT IS UNNATURAL AND HUMAN CAUSED! Beyond all doubt prove it — YOU PROVE IT!
CO2 has risen many times before throughout this planet’s history and NEVER because of human activity, for some banal reason you believe (for that is all you have) human activity caused the rise in CO2 this time. It is NOT certain only misanthropes of the worst type would be so certain it is human caused!
If you can not prove it then YOUR THINKING IS JUST HUBRISTIC NONSENSE, from the demented idea of believing mankind is in charge of the climate.
The assumptions about past CO2 concentrations from the paleoclimate are far from “certain”. We have no idea to what extent modern CO2 concentrations compare to past values, as our guesses about past concentrations are rooted in contradictory evidence that has only been “agreed upon” recently…similar to how the IPCC-like community “agreed upon” the notion of unprecedented modern warming. You’re believing in something (past CO2 concentration values) that are anything but “certain” to claim that current values are unusual. Obviously, you are believing this because it fits in with your paradigm of a dominant human/CO2 influence on net ocean heat content changes. Just because you believe something is true, or certain, doesn’t make it so.
Prove that the isotope readings that showed CO2 concentrations ranged between 160 ppm and 2,450 ppm during the Holocene were wrong, SebastianH. The burden of proof is on you to explain why CO2 concentrations varied so dramatically in the past without human interference.
—
Jaworowski, 1997
http://www.21stcenturysciencetech.com/2006_articles/IceCoreSprg
The ice core data from various polar sites are not consistent with each another, and there is a discrepancy between these data and geological climatic evidence. One such example is the discrepancy between the classic Antarctic Byrd and Vostok ice cores, where an important decrease in the CO2 content in the air bubbles occurred at the same depth of about 500 meters, but at which the ice age differed by about 16,000 years. In an approximately 14,000-year-old part of the Byrd core, a drop in the CO2 concentration of 50 ppmv was observed, but in similarly old ice from the Vostok core, an increase of 60 ppmv was found. In about ~6,000-year-old ice from Camp Century, Greenland, the CO2 concentration in air bubbles was 420 ppmv, but it was 270 ppmv in similarly old ice from Byrd, Antarctica. … In the air from firn and ice at Summit, Greenland, deposited during the past ~200 years, the CO2 concentration ranged from 243.3 ppmv to 641.4 ppmv. Such a wide range reflects artifacts caused by sampling, or natural processes in the ice sheet, rather than the variations of CO2 concentration in the atmosphere. Similar or greater range was observed in other studies of greenhouse gases in polar ice.
Until 1985, the published CO2 readings from air bubbles in pre-industrial ice ranged from 160 to about 700 ppmv, and occasionally even up to 2,450 ppmv. After 1985, high readings disappeared from the publications. To fit such a wide range of results to the anthropogenic climatic warming theory, which was based on low pre-industrial CO2 levels, three methods were used: (1) rejection of high readings from sets of preindustrial samples, based on the credo: “The lowest CO2 values best represent the CO2 concentrations in the originally trapped ice”; (2) rejection of low readings from sets of 20th century samples; and (3) interpretation of the high readings from pre-industrial samples as representing the contemporary atmosphere rather than the pre-industrial one.
Neftel, et al. reported in 1982 rather high median CO2 concentrations in the preindustrial ice core from Byrd, Antarctica, of about 330 and 415 ppmv, with maximum value reaching 500 ppmv. However, in 1988, in the second publication on the same core, Neftel et al. did not show these high readings; the highest concentration reported was 290 ppmv, in agreement with the global warming theory.
—
seb,
“They only working argument that it’s not insulating that much is that higher surface temperature cause more evaporation and transfer of heat towards the atmosphere, providing a negative feedback.”
BS, there are many arguments, most say you are wrong!
seb,
“But trying to explain stuff with magic or with explainations going against all know laws of physics, isn’t the way to go.”
Your pet theory is riddled with anti-science, and hidden magic, as fools such as Dr. Hansen reminds us that there’s a ‘runaway greeenhouse effect’. Complete BS, from the AGW book of magic.
Or that there is still, despite over 30 years of effort, no demonstrable experiment or observation showing proof of CO2 trapping heat (as Hansen puts it) in our normal atmosphere. To think that it does happen (without proof) takes a special religious AGW belief, a belief YOU are guilty of having.
That’s already been done and it’s simple math: we output more CO2 per year than the yearly increase in atmospheric CO2. Please propose a mechanism how the increase of the CO2 concentration could be natural in such a szenario! Here is a graph of the current increase: http://imgur.com/a/yru36
As Kenneth writes, we aren’t entirely sure about that, but of course humans have never caused in increase before, how could they even? However, why are you looking in the (distant) past where humans obviously didn’t cause anything? What is relevant to the question whether we are causing the increase or not is happening today. We are emitting CO2 in large quantities.
There have been multiple experiments and the effects of CO2 have been known for – literally – centuries by now. The only remaining question is about the climate sensitivity of a change in CO2 concentration, because that is a complex system with lots of feedbacks.
@Kenneth:
They are unusual for the recent past (see graph linked above), wouldn’t you agree? And why does it matter if those values have been reached in the distant past without human activities? We are talking about present day, and to claim that these increases are natural is just crazy and the burden of proof is most certainly in the corner of those suggesting that this could be the case. All evidence points to humans. So the above question also goes to you: Please propose a mechanism how the increase of the CO2 concentration could be natural in such a szenario!
There it is again, the word “believe” used to belittle statements. Why are you so convinced (a believe if you will) that human influence (on CO2 concentration) is little, despite the overhelming evidence against this?
What? Why do I have to prove or explain anything about past CO2 levels? We are talking about current levels and there is a perfect explaination for it, that you don’t want to be true and yet you can’t propose a mechanism how all the CO2 that we emit could possible not (or very little, 15% you wrote?) contribute to CO2 concentration increase.
You’re asking me to agree that our guessed-at values for CO2 concentrations from only 100s to 1,000s of years ago are correct and certain, and therefore today is outside the range of natural variability? I do not accept the premise.
So you have “overwhelming” evidence that anthropogenic CO2 emissions are what heat or cool the ocean? From real-world scientific experiments and observations? Great! We’ve been asking you to produce even ONE paper that provides physical measurements (not modeled, hypothetical results) showing that CO2 concentration variations heat water for 6 months now, and you haven’t produced anything. If the evidence is so overwhelming that real-world observation shows CO2 variations heat/cool water, then surely you can produce something.
Because you’re the one who made the claim that it is certain that humans are the 100% cause of modern CO2 concentration variations.
And here we go … another example of you missreading what I wrote (on purpose?).
On the question who has to prove what, we are going in circles again. You are claiming something, so prove it. It showed you why we are causing 100% of the increase in CO2 concentration.
No, it did not. It’s speculation based on correlation with data that only date back to the late 1950s (Mauna Loa). During the Holocene, some CO2 values for ice cores reached into the 600s and 700s ppm. If those are no less “accurate” than the currently agreed-upon ice core values for the Holocene (260-280 ppm), then the correlation between anthropogenic emissions and CO2 rise becomes even more speculative with regard to cause. You understand the burden of proof for causation is more rigorous than correlation, right?
Sorry Kenneth, I can’t see how past CO2 concentration have anything to do with the current increase in concentrations? It could have been at 20000 ppm 10000 years ago, who cares?
All that matters for answering the question whether or not human activity is the cause for the recent CO2 increase is comparing our output of CO2 with that increase.
If there is some kind of natural process that can output orders of magnitudes more CO2, well … that’s good for explaining past CO2 hikes, but how does that explain the current increase? Where is human CO2 vanishing to?
About the burden of proof: when you see someone throwing stones into a pool and deduce from that, that the stones in the pool come from that someone. How are you responsible for proving that this is the case when someone else claims that those stones appeared there naturally? You’ve literally seen who throws the stones into the pool, haven’t you?
Of course you can’t see why a natural variability context has anything to do with your correlation = causation beliefs. That’s why your viewpoints are properly categorized as beliefs, and why you are anything but a skeptic. You are incapable of critical examination of your own paradigm.
And there is quite a bit of evidence that your certainty with regard to “100% anthropogenic causation” has been challenged by scientists. Of course you will ignore papers that do not support your presuppositions.
—
Ahlbeck, 2009
http://journals.sagepub.com.sci-hub.cc/doi/abs/10.1260/095830509789876772
The increase rate of atmospheric carbon dioxide for the period from 1980 to 2007 can be statistically explained as being a function solely of the global mean temperature. Throughout the period, the temperature differences seem to have caused differences around a base trend of 1.5 ppmv/year. The atmospheric CO2 increase rate was higher when the globe was warmer, and the increase rate was lower when the globe was cooler. This can be explained by wind patterns, biological processes, or most likely by the fact that a warmer ocean can hold less carbon dioxide. This finding indicates that knowledge of the rate of anthropogenic emission is not needed for estimation of the increase rate of atmospheric carbon dioxide.
—
Jones and Cox, 2005
http://onlinelibrary.wiley.com/doi/10.1029/2005GL023027/full
There is clear similarity between Figures 1b and 1c, with the positive CO2 growth rate anomalies corresponding to El Niño events, and the negative growth rate anomalies corresponding to La Niña events. The largest positive CO2 growth rate anomalies are coincident with large Niño3 values in 1973, 1988 and 1998. … It is unlikely that these anomalies can be explained by an abrupt increase in anthropogenic emissions, as the anomalies are much larger than annual increases in fossil fuel emissions. Most interannual variability in the CO2 growth rate is attributable to variations in land-atmosphere CO2 exchange with climate (e.g., associated with ENSO or volcanic perturbations)
—
Quirk, 2009
http://journals.sagepub.com/doi/abs/10.1260/095830509787689123
The results suggest that El Nino and the Southern Oscillation events produce major changes in the carbon isotope ratio in the atmosphere. This does not favour the continuous increase of CO2 from the use of fossil fuels as the source of isotope ratio changes. The constancy of seasonal variations in CO2 and the lack of time delays between the hemispheres suggest that fossil fuel derived CO2 is almost totally absorbed locally in the year it is emitted. This implies that natural variability of the climate is the prime cause of increasing CO2, not the emissions of CO2 from the use of fossil fuels.
—
http://www.atmos-chem-phys-discuss.net/10/9045/2010/acpd-10-9045-2010.html
The ratio of CO2 accumulating in the atmosphere to the CO2 flux into the atmosphere due to human activity, the airborne fraction (AF), is central to predict changes in earth’s surface temperature due to greenhouse gas induced warming. This ratio has remained remarkably constant in the past five decades [despite an explosion in CO2 emissions].
—
Flohn, 1982
https://www2.meteo.uni-bonn.de/bibliothek/Flohn_Publikationen/K287-K320_1981-1985/K299.pdf
Indeed the cool upwelling water is not only rich in (anorganic) CO2 but also in nutrients and organisms. (algae) which consume much atmospheric CO2 in organic form, thus reducing the increase in atmospehreic CO2. Conversely the warm water of tropical oceans, with SST near 27°C, is barren, thus leading to a reduction of CO2 uptake by the ocean and greater increase of the CO2. … A crude estimate of these differences is demonstrated by the fact that during the period 1958-1974, the average CO2-increase within five selective years with prevailing cool water only 0.57 ppm/a [per year], while during five years with prevailing warm water it was 1.11 ppm/a. Thus in a a warm water year, more than one Gt (1015 g) carbon is additionally injected into the atmosphere, in comparison to a cold water year.
—
Goldberg, 2008
http://journals.sagepub.com/doi/abs/10.1260/095830508786238369
[T]he warming and cooling of the ocean waters control how much CO2 is exchanged with atmosphere and thereby controlling the concentration of atmospheric CO2. It is obvious that when the oceans are cooled, in this case due to volcanic eruptions or La Niña events, they release less CO2 and when it was an extremely warm year, due to an El Niño, the oceans release more CO2. … [D]uring the measured time 1979 to 2006 there has been a continued natural increase in temperature causing a continued increase of CO2 released into the atmosphere. This implies that temperature variations caused by El Niños, La Niñas, volcanic eruptions, varying cloud formations and ultimately the varying solar irradiation control the amount of CO2 which is leaving or being absorbed by the oceans.
—
Essenhigh, 2009
http://pubs.acs.org/doi/abs/10.1021/ef800581r
[T]he analytical results also then support the IPCC analysis and data on the longer “adjustment time” (∼100 years) governing the long-term rising “quasi-equilibrium” concentration of CO2 in the atmosphere. For principal verification of the adopted PSR model, the data source used was the outcome of the injection of excess 14CO2 into the atmosphere during the A-bomb tests in the 1950s/1960s, which generated an initial increase of approximately 1000% above the normal value and which then declined substantially exponentially with time, with τ = 16 years, in accordance with the (unsteady-state) prediction from and jointly providing validation for the PSR analysis. With the short (5−15 year) RT [residence time] results shown to be in quasi-equilibrium, this then supports the (independently based) conclusion that the long-term (∼100 year) rising atmospheric CO2 concentration is not from anthropogenic sources but, in accordance with conclusions from other studies, is most likely the outcome of the rising atmospheric temperature, which is due to other natural factors. This further supports the conclusion that global warming is not anthropogenically driven as an outcome of combustion.
seb,
You say –
“That’s already been done and it’s simple math: we output more CO2 per year than the yearly increase in atmospheric CO2. Please propose a mechanism how the increase of the CO2 concentration could be natural in such a szenario! Here is a graph of the current increase: http://imgur.com/a/yru36”
More sophistry of nonsense. That is not the proof for what I said. But then again how could you really answer the question when you know you have no proof.
It has been shown (via many methods, but mostly ice-cores) that CO2 levels have varied regardless of human influence (that is to say humans did not exist). Thus it indicates that nature (not humans) have always been in charge of CO2 level and their rates of rise and fall. IT IS NOW UP TO THE AGW ZEALOT TO PROVE THAT MAN HAS ALTERED THIS NATURAL VARIATION.
These (ice core measurements) indicated past CO2 level are orders of magnitude above now, or sometimes below today’s low levels. Indications thus far do not indicate a direct correlation of CO2 level with temperature. However there appears to be a strong correlation of CO2 levels and levels of biological life on the planet; low CO2 regardless of temperature = low amounts of life, high CO2 and warm climate = high levels of life. And yes history does matter.
No research has PROVED that human derived CO2 upsets this natural balance, however most AGW advocates wish to change the current methods power generation and other societal changes based on this flakey theory. It is therefore incumbent on YOU AGW ADVOCATES TO PROVIDE THE PROOF. lest we waste more money on this nonsense.
So far there was a very transitory correlation (IMO mere chance in the million) back in 1980-1990 when temperature changes and CO2 level change appeared to correlate but that faded away decades ago. Global warming as asserted to happen by the IPCC (both in level and rate) has not, and is not happening. Observation shows their theory MUST be wrong.
IMO the crass mistake that AGW religious observers make is that in this multi-component, multi-feedback loosely coupled system of climate, CO2 stands alone as the one parameter that has a direct cause:effect affect on this planet. Looking at the history of this planet via ice-core data this has never been the case before, thus why is it the case now — Answer: It is not (SO IT IS INCUMBENT ON THE AGW ADVOCATES TO PROVE OTHERWISE.) To my mind this is a deranged idea, as the inter-couplings, feedbacks, and nonlinear associations of the myriad parameters that influence our climate preclude such a 1 to 1 relationship — ice core data also indicate this to be the case.
So yes seb your sophistry and AGW religious dogma is all you have, you have no real proof .
One paper that has started the push in a more rational direction is here https://www.nature.com/ngeo/journal/v8/n5/pdf/ngeo2414.pdf.
No, I really can’t. Show me how it would be possible for nature to “just absorb” all the CO2 we produce and then not absorb some of the CO2 it produces itself. Does nature “know” which CO2 molecule is of human origin?
Regarding your list of papers:
1) Ahlbeck, 2009: so we forget that there was supposed to be a lag between temperature and CO2 increases? And suddenly temperature increase correlates with CO2 increase? How convenient that a skeptic can change positions so fast.
2) Jones and Cox, 2005: how is that paper contradicting that we cause all the increase? It’s describing nature’s variability. A warmer ocean surface during El Nino events can’t absorb as much CO2. The increase in CO2 concentration in those years is still below human CO2 emissions.
3) Quirk, 2009: a proponent of the idea that nature knows what CO2 is emitted from humans and quickly acts to just absorb those molecules.
The next ones are basically a repetition of 2). The last one concludes that a short residence time means it’s not human CO2 that causes the increase (so basically what 3) says). Maybe the full text of that paper would clarify what the author actually wants to say?
No, it isn’t. Once again your “explanation” is wrong. And you obviously don’t even know it because you keep repeating this over and over again without recognizing your flagrant error.
You can’t compare the overall amount of annual human emissions (e.g., 9.795 GtC in 2014) to the change in CO2 concentration for a given year (~2 ppm). You must compare the net change in CO2 concentration to the net change in annual anthropogenic CO2 emission from year to year – for example from 9.735 GtC in 2013 to 9.795 in 2014, which is a change of 0.06 GtC. To do so, see the record of the changes in CO2 emissions from fossil fuels/cement between 2006-2014.
https://notrickszone.com/wp-content/uploads/2017/06/Gigatons-Carbon-2006-2014.jpg
2014 – 9.795 GtC
2013 – 9.735 GtC
2012 – 9.575 GtC
2011 – 9.449 GtC
2010 – 9.140 GtC
2009 – 8.700 GtC
2008 – 8.740 GtC
2007 – 8.532 GtC
2006 – 8.363 GtC
The average year-to-year increase from 2006 to 2014 was 0.16 GtC for human emissions (1.43 GtC total net change in 9 years) . Now see if you can follow along here, Sebastian…since you continue to miss this due to your presuppositions and confirmation bias.
Considering CO2 concentrations rose from 380 ppm to 396 ppm (16 ppm) between 2006 and 2014 (1.78 ppm/year), and using the IPCC conversion factor of “2.12 GtC yr = 1 ppm“, we can calculate that overall CO2 emissions from both natural and anthropogenic sources combined rose by 33.9 GtC (1 ppm = 2.12 GtC X 16 ppm) between 2006 and 2014, or 3.77 GtC/year (33.9 GtC/9 years).
So, again, human emissions changes for 2006-2014 were +0.16 GtC per year on average. In contrast, the overall rate of GtC rise was +3.77 GtC/year for 2006-2014. This means that natural (non-anthropogenic) contributions to the overall CO2 concentration change was 3.61 GtC/year out of the 3.77 GtC/year of overall emission.
So, to convert this into percentages, humans contributed 4% to the overall CO2 concentration change, whereas natural emissions contributed 96%. Put another way, out of the 16 ppm change in CO2 concentration between 2006-2014, about 0.65 ppm came from humans.
Succinctly, you have wrongly been comparing the overall GtC yearly emissions from humans (~9 GtC/year) to the net change in CO2 concentration rather than correctly comparing the net change in human GtC emissions to the net change in CO2 concentration. And that’s why you keep coming up with this ridiculous conclusion that emissions from humans are greater than the overall CO2 change, so therefore humans caused 100% of the CO2 change.
Kenneth,
Whaaaaaat? Are you serious with that one? That makes no sense at all.
Do you really think that a constant CO2 output of mankind (0 GtC increase per year) would mean ZERO CO2 would enter the atmosphere and contribute to the increase? In what kind of twisted mathematical world do you live?
So this is the first time you’ve ever thought to compare the year-to-year GtC increase (i.e., 9.375 GtC in 2013 to 9.975 in 2014, or +0.06 GtC) to the yearly CO2 concentration change (+2 ppm)? You’ve never understood that it is incorrect to compare the overall change in anthropogenic emission (~9.5 GtC) to the yearly increase in CO2 concentration? Really? This has just occurred to you now?
No. I didn’t write that. Once again, you’re just making stuff up.
Surprise, surprise..
… seb being DISHONEST, yet again.
He KNOWS that CO2 doesn’t cause warming over oceans or in a convective atmosphere, ..
He KNOWS that human contributions to atmospheric CO2 are MINOR and that they TOTALLY BENEFICIAL TO ALL LIFE ON EARTH…..
…but he just keeps yapping like a demented Chihuahua anyway.
“In what kind of twisted mathematical world do you live?”
You are the FANTASSY man.
Kenneth would seem to have mathematical ability several steps above your “junior high, barely passed” level.
Sorry that you are TOTALLY INCAPABLE of understanding the pretty straightforward maths that K is trying, in vain, to show you.
Pierre,
As always my comment appears to have been safely hidden in the spam bin with no on-screen notification.
Is there no method by which this site can keep the commentator informed of what happened to their comments when they fail to be published?
“https://notrickszone.com/wp-content/uploads/2017/06/Gigatons-Carbon-2006-2014.jpg
2014 – 9.795 GtC
2013 – 9.735 GtC
2012 – 9.575 GtC
2011 – 9.449 GtC
2010 – 9.140 GtC
2009 – 8.700 GtC
2008 – 8.740 GtC
2007 – 8.532 GtC
2006 – 8.363 GtC
The average year-to-year increase from 2006 to 2014 was 0.16 GtC for human emissions (1.43 GtC total net change in 9 years) . Now see if you can follow along here, Sebastian…since you continue to miss this due to your presuppositions and confirmation bias.”
Kenneth, the Global Carbon Budget data was in gigatons of carbon per year. The total anthrogenic carbon output from 2006-2014 was 83.3 GtC and the average was 9.25 GtC/yr. If atmospheric carbon increased by33.9 GtC during that time there are still 50 GtC unaccounted for. The ocean took in 23.5 GtC and land sinks 29.5 GtC. That makes anthropogenic carbon the source of 96% of the increase in CO2.
Your Ahlbeck paper oddly enough made the opposite argument:
“The anthropogenic CO2 emissions increased by 64% during the analysed period of 1980 to 2007. In fact the anthropogenic emissions have probably increased even more than 64% if deforestation is taken into account. But—despite this very large increase to the anthropogenic emissions throughout the period—a base trend of 1.5 ppmv/year to atmospheric CO2 concentration was maintained.”
That paper never looked at data on the uptake of carbon dioxide on land or at sea. “The atmospheric CO2 increase rate was higher when the globe was warmer, and the increase rate was lower when the globe was cooler. This can be explained by wind patterns, biological processes, or most likely by the fact that a warmer ocean can hold less carbon dioxide.” Instead from 1980 to 2007 the ocean CO2 content increased by 60 Gt.
Considering the IPCC acknowledges that natural CO2 emissions out-emit humans at a ratio of 96:4 (95.7% to 4.3%), if humans emitted 83.3 GtC total during 2006-2014, natural emissions rose by 1,999.2 GtC between those years, or a 222.1 GtC/year output compared to humans’ 9.25 GtC/year.
You’re making the same mistake SebastianH makes. Instead of comparing apples to apples, you are comparing the year-to-year net CO2 ppm change to the aggregate change in anthropogenic GtC emissions (not the net change in emission), which is comparing apples to oranges.
Craig, 33.9 GtC was the converted difference for the net change in atmospheric CO2 (16 ppm) between 2006 and 2014 using the IPCC conversion formula 1 ppm = 2.12 GtC. Again, the average year-to-year GtC rate change for fossil fuel emissions was +0.16 GtC betweem 2006-’14 (1.43 GtC overall rate increase/9 years), which amounts to about +0.074 ppm per year in atmospheric CO2 concentration contributed from humans from the increase in emissions rate. Since the average CO2 concentration change was +1.78 ppm/year, that means that 1.71 ppm of the 1.78 ppm change was not anthropogenic.
The Global Carbon Budget 2016 made it clear it was talking about GtC and not GtCO2. The numbers given are GtC per year, the carbon emitted that year. Notice it lists the rate of increase from 2006-2015 as 9.3GtC per year.
“Global CO2 emissions from fossil fuels and industry have increased every decade from an average of 3.1 ± 0.2 GtC yr−1 in the 1960s to an average of 9.3 ± 0.5 GtC yr−1 during 2006–2015. The growth rate in these emissions decreased between the 1960s and the 1990s, with 4.5 % yr−1 in the 1960s (1960–1969), 2.8 % yr−1 in the 1970s (1970–1979), 1.9 % yr−1 in the 1980s (1980–1989), and 1.1 % yr−1 in the 1990s (1990–1999). After this period, the growth rate began increasing again in the 2000s at an average growth rate of 3.5 % yr−1 , decreasing to 1.8 % yr−1 for the last decade (2006–2015).” http://www.earth-syst-sci-data.net/8/605/2016/essd-8-605-2016.pdf
This graphic from the Global Carbon Budget 2016 shows anthropogenic CO2 accounts for practically all of the CO2 increase in the air, land and sea.
http://i.imgur.com/LElrg1J.jpg
“Considering the IPCC acknowledges that natural CO2 emissions out-emit humans at a ratio of 96:4…”
Not any IPCC document I have read says that. Note below IPCC states both GtC and GtCO2 so there is no confusion.
IPCC Fourth Assessment Report: Climate Change 2007
Human and Natural Drivers of Climate Change
“The primary source of the increased atmospheric concentration of carbon dioxide since the pre-industrial period results from fossil fuel use, with land-use change providing another significant but smaller contribution. Annual fossil carbon dioxide emissions increased from an average of 6.4 [6.0 to 6.8] GtC (23.5 [22.0 to 25.0] GtCO2) per year in the 1990s to 7.2 [6.9 to 7.5] GtC (26.4 [25.3 to 27.5] GtCO2) per year in 2000–2005 (2004 and 2005 data are interim estimates).”
https://www.ipcc.ch/publications_and_data/ar4/wg1/en/spmsspm-human-and.html
Again, no, that’s not the rate of increase. That’s the average total emission rate per year. The increase in the rate is the difference in emission from one year to the next (i.e., from 9.375 GtC in 2013 to 9.975 in 2014, or +0.06 GtC).
Yes, a rate GtC increase of 1.8% per year is very similar to the +0.16 GtC per year increase that I pointed out to you originally. +0.16 GtC/year/9.25 GtC average emission rate = 1.72%
KR: “Considering the IPCC acknowledges that natural CO2 emissions out-emit humans at a ratio of 96:4…”
The natural versus anthropogenic CO2 emission ratio from IPCC AR5, Figure 6.1:
http://www.climatechange2013.org/images/figures/WGI_AR5_Fig6-1.jpg
Natural emissions total: 198.2 GtC (primarily 78.4 GtC from ocean outgassing, and 118.7 GtC from total respiration and fire)
Anthropogenic emissions total: 8.9 GtC (7.8 GtC is fossil fuels, 1.1 is land use changes)
Ratio in terms of 100% total 207.1 = 95.7 to 4.3
http://www.sciencedirect.com/science/article/pii/S0921818116304787
The anthropogenic contribution to the actual CO2 concentration is found to be 4.3%. … In their accounting schemes and models of the carbon cycle the IPCC uses many new and detailed data which are primarily focussing on fossil fuel emission, cement fabrication or net land use change (see AR5-WG1-Chap.6.3.2), but it largely neglects any changes of the natural emissions, which contribute to more than 95 % to the total emissions and by far cannot be assumed to be constant over longer periods.”
To review:
The average year-to-year GtC rate change for fossil fuel emissions was +0.16 GtC betweem 2006-’14 (1.43 GtC overall rate increase/9 years, or about 1.8%/year), which amounts to about +0.074 ppm per year in atmospheric CO2 concentration contributed from humans from the increase in emissions rate. Since the average CO2 concentration change was +1.78 ppm/year during those years, that means that 1.71 ppm of the 1.78 ppm yearly average change was not anthropogenic.
“The natural versus anthropogenic CO2 emission ratio from IPCC AR5, Figure 6.1:
http://www.climatechange2013.org/images/figures/WGI_AR5_Fig6-1.jpg
Natural emissions total: 198.2 GtC (primarily 78.4 GtC from ocean outgassing, and 118.7 GtC from total respiration and fire) Anthropogenic emissions total: 8.9 GtC (7.8 GtC is fossil fuels, 1.1 is land use changes) Ratio in terms of 100% total 207.1 = 95.7 to 4.3”
You need to look at that graphic again. It shows the net atmospheric gain per year, what adds to atmospheric CO2 and what removes CO2. You have the anthropogenic yearly contribution right at 8.9 GtC. The other factors adding CO2 to the air is 1 GtC from freshwater outgassing and 0.1 GtC from volcanism. That makes humans responsible for 89% of the CO2 added to the atmosphere each year and 99% of the new carbon in the environment.
You can’t just look at the CO2 released by the land and water then ignore that they absorbed more CO2 than they released. The graphic shows the ocean absorbing 1.6 GtC net and land taking in 4.3 GtC net from the atmosphere. That leaves 4.1 GtC more carbon dioxide in the air at the end of the year because the land and sea can’t keep up the CO2 output by humans.
“The average year-to-year GtC rate change for fossil fuel emissions was +0.16 GtC betweem 2006-’14 (1.43 GtC overall rate increase/9 years, or about 1.8%/year), which amounts to about +0.074 ppm per year in atmospheric CO2 concentration contributed from humans from the increase in emissions rate.”
You don’t want to look at the rate of increase per year but the anthropogenic CO2 added to the environment each year. That is the contribution from humans. You agree that the IPCC graphic shows fossil fuels contributing 7.8GtC (the 2004 value) in a single year. In 2015 fossil fuel use released 9.9 GtC in the air. The fact that more CO2 is released each year makes the problem worse not better.
Yes, it’s the UN, so I realize that the subjective estimations of natural emissions and sinks make it appear that natural sinks absorb exactly enough to allow anthropogenic emissions to be considered responsible for the change. The reason for showing the graph to you is that you had no idea that the ratio of natural emissions to human emissions was 96:4 according to the IPCC. This is ratio itself an estimation, as we “discover” new sources and sinks that we never knew existed before on a routine basis. These little more than assumptions/guesses. Actually, considering the oceans contain orders of magnitude more CO2 than air does, it is highly likely that the IPCC vastly underestimates the emission from oceans.
You keep on trying to emphasize the yearly GtC emission total from humans and how substantially this has increased, but you seem to fail to recognize that the natural emission has necessarily exploded during this time too—and much more so than human emissions have. The total increase in yearly anthropogenic emission was just 1.43 GtC/year for 2006-’14. For non-anthropogenic emissions, the increase was 32.5 GtC/year over the same period (16 ppm X 2.12 = 33.92 GtC – 1.43 GtC).
A case example… Termites emit more than twice as much CO2 as humans do on a yearly basis. Considering the Earth is substantially greener now than it was in the 1980s, this means that termites are likely emitting more CO2 than they did in the 1980s too. The increase in natural emissions from termites must be accounted for by a counterbalanced increase in sinks to maintain equilibrium. The IPCC just assumes that a growth in natural sinks has materialized somehow to neatly counterbalance the increase in natural emissions, but, again, they are just guessing that this has occurred. They presuppose that human emissions are the cause, and their estimates therefore fall in line with their expectations.
Um, yes I do. But I realize that you don’t want to look at the amount of GtC increase per year from human emissions (just +0.16 GtC/year during 2006-’14, or +1.8%) because that translates into just 0.074 of a ppm annual contribution from humans using the IPCC formula 1 ppm = 2.12 GtC. And considering CO2 concentration increased by 1.78 ppm per year during those years, that means that the change in human emissions contributed just 4% (0.074 of 1.78 ppm) to the yearly CO2 concentration change. You don’t like that, so you’ve decided to change the subject, refusing to address these calculations because they don’t fall in line with your own presuppositions.
I also note that fresh and brackish waterway CO2 “emissions” are not fully accounted for in the IPCC documentation.
See http://environment.yale.edu/envy/stories/streams-and-rivers-breathing-carbon-dioxide
and the paper ‘Global carbon dioxide emissions from inland waters’
Authors: Peter A. Raymond, Jens Hartmann, Ronny Lauerwald, Sebastian Sobek, Cory McDonald, Mark Hoover, David Butman1, Robert Striegl, Emilio Mayorga, Christoph Humborg, Pirkko Kortelainen, Hans Dürr, Michel Meybeck, Philippe Ciais, Peter Guth, doi:10.1038/nature12760
http://www.nature.com/nature/journal/v503/n7476/full/nature12760.html
and also “Significant efflux of carbon dioxide from streams
and rivers in the United States”
Author: David Butman*and Peter A. Raymond
Nature GeoScience 16 OCTOBER 2011 | DOI: 10.1038/NGEO1294
available at http://harvardforest.fas.harvard.edu/sites/harvardforest.fas.harvard.edu/files/publications/pdfs/Butman_NatureGeoscience_2011.pdf
Kenneth, just wow. You really got that one wrong and don’t see why. Instead you seem convinced that your math is solid and that the world really works this way, aren’t you?
Why in the world would only the increase in CO2 emissions from humans count towards the increase in CO2 concentration? Why do you think that natural emissions exploded more than human emissions did (because of that 96:4 thing?)? Why do you not care about natural CO2 absorption?
If you want to fill a pool with water and try to do that with a bucket, do you think the pool only fills if you increase the amount of water in the bucket every time you use it?
That’s what you are claiming about the CO2 increase. All I can say to that is: WTF?!
Not care about absorption?
Who thought/wrote that? I didn’t.
It doesn’t appear you have anything substantive to say in response. All you’ve done is say “Wow”, that I’m “wrong”, then you spew another ridiculous analogy about a pool, and then yet another false claim about what you think I am claiming based on that analogy. And then more made-up thoughts about me not caring about natural emissions(?). And then finally, “WTF?!” That’s all you have.
I’ll explain this again. Between 2006 and 2014, the annual emission from humans rose by 1.43 GtC/year in total, or 0.16 GtC/year. During this same period, the CO2 concentration rose by 16 ppm, or 1.78 ppm per year on average. Using the IPCC conversion formula of 1 ppm = 2.12 GtC, this means that the overall human contribution was the equivalent of about 0.074 ppm per year on average, leaving the rest of the 1.78 ppm per year CO2 change (1.71 ppm) due to changes in non-anthropogenic contributors.
You just did … again. Or what are you saying with:
That means you think the rest of human yearly emissions doesn’t count towards the increase in CO2 concentration, doesn’t it?
You really can’t see why it is incorrect to compare increases as if the total amounts don’t matter at all?
Let’s do another analogy. Let’s suppose you need to eat 2000 calories per day to stay at your current weight. Now you increase your intake a consume 3000 calories by day for a month. You’ll gain weight. Now let’s increase the intake by 100 calories per day. Do you think you’ll now just gain weight because of that increase and not because you are already eating 1000 calories too much?
Your idea of math makes no sense here. Sorry. The fact that you can’t see your error is disconcerting, as you often show this kind of behaviour when handling numbers …
I think both the ~220 GtC/year from natural sources and the 9.5 GtC/year from anthropogenic sources count. (Apparently you don’t think we should count the former.) Since the natural emissions overall rate increase per year was 32.5 GtC during 2006-’14 while the anthropogenic overall rate increase per year was 1.43 GtC (8.363 GtC/year in ’06 vs. 9.795 GtC/year in 2014 = 1.43 GtC/year increase), this means that the natural sources will contribute to the CO2 ppm increase far more than the anthropogenic emission increase. And since they mix anyway, and the atmosphere doesn’t distinguish between anthropogenic and natural emission, the rate increase from natural emissions (32.5 GtC/year is 16 ppm X 2.12 = 33.92 GtC/year – 1.43 GtC/year) is predominantly what’s causing the CO2 concentration increase. Again, this is using the IPCC’s own formula of 1 ppm = 2.12 GtC. That’s how we calculate the natural emissions yearly rate increase per year to the anthropogenic yearly rate increase per year (+0.16 GtC). You’ve been calculating with the wrong figures all along, SebastianH…and you didn’t even realize it.
You’re only counting the total amounts for anthropogenic emissions (9.5 GtC/year), ignoring the 220 GtC/year from natural sources and the 32.5 GtC/year increase in natural emissions between 2006-2014, and then directly comparing the 9.5 GtC to the ppm/year increase (~2 ppm). Obviously you had no idea why it’s incorrect to compare the total emission to a rate increase rather than a rate increase to a rate increase. It’s telling that I have to educate you about your math errors when you are the one who continues to haughtily exclaim your intellectual superiority.
I think I may vomit.
Andy-
“What proportion of radiation from the ceramic heater was visible light?”
None whatsoever. Electric elements inside warm the ceramic heater, which then gives off infrared.
“Water DOES NOT absorb long wave radiation, certainly not in the tiny thin band that CO2 could emit, that is a fantasy of the brain-washed anti-COP2 anti-science cult.”
Water is opaque to longwave radiation, completely absorbing it in the top millimeter of the surface. C02 emits at 500-820cm-1 (12-20 microns.) In 1956 M. Ceccaldi published a paper finding “… a sharp DO-band at 16.8 microns and indications of an HDO-band near 15 microns. These bands only exist in the liquid state and must probably be attributed to intermolecular vibrations.” Gilbert Plass found the same thing that year. The fact that CO2 emitted in a range that water vapor did not led Plass to revive the idea that CO2 could influence climate.
http://www.iaea.org/inis/collection/NCLCollectionStore/_Public/38/054/38054598.pdf
http://onlinelibrary.wiley.com/doi/10.1111/j.2153-3490.1956.tb01206.x/epdf
“Why not use an infrared laser, so that realistic atmospheric temperatures are reached.”
https://www.researchgate.net/publication/235974689_Explosive_boiling_of_water_after_pulsed_IR_laser_heating
“Radiation is a bit player easily compensated for by the dominant convection and conduction.”
I thought we all agreed that the radiative energy from the sun drove climate. Water gives off radiant energy and is cooled by the loss. Downward longwave radiation reduces the net loss and so the cooling. On the equator during a strong El Nino the net loss of LWR is reduced to almost zero.
In the experiment using the heat lamp the water absorbed more LWR than it emitted. There was no shortwave radiation so it was far from a copy of the ocean during the day, but it’s another documentation of the fact that longwave radiation can warm water.
As I said… Build a big enough slingshot, I will send a cow over the moon.
As you say, water is opaque to long wave radiation.
This experiment has absolutely nothing to do with atmospheric anything… Its purely an indication that if you apply enough direct heating, not allowing proper convective processes, then you can overcome the natural evaporative cooling process.
Long wave radiation in the lower atmosphere is a total non-entity when it comes to warming oceans or atmosphere. You know that, so why bother with this totally unrelated piece of childish misdirection?
Are you REALLY that desperate ?????
The comparison between atmospheric radiation and this experiment is that of a nerf ball versus a rail gun. (another analogy, since its all certain people seem to comprehend)
Now that I’ve shown that longwave radiation can affect water temperature we can talk real world. As long as the ocean temperature is warmer than the air above it the net longwave radiation will be negative. The downward longwave radiation will be less than the upward LWR but as downward LWR increases the net LWR loss is reduced and cooling decreases.
Let’s look at an extreme to make the point. During the 1997-98 El Nino the temperature of equatorial waters rose rapidly from January to June 1997. As the temperature and humidity rose cloud cover increased. With more clouds the shortwave radiation dropped. Starting at 290W/m2 SWR was down to 180 W/m2 by December 1997. This was when surface temperatures peaked at 30C.
So how did the water warm while shortwave radiation fell? Cloud cover blocks SWR but returns more longwave radiation to the ocean. Net longwave heat loss was at -60W/m2 for the start of the year but increasing downward LWR reduced that to -40W/m2 by June 1997.
http://i.imgur.com/XgT9p8E.jpg
How much can LW “affect” the temperature of a body of water relative to the “affecting” achieved by shortwave radiation, Craig?
And what are the physical measurements from a real-world experiment that show how much cooling is caused in a body of water after reducing the CO2 concentration above it by 10 ppm (-0.00001)?
Why did your paper not even mention CO2, Craig?
These are little more than wild guesses. The errors and uncertainty in estimates of LW forcing are many times larger than the assumed total forcing from humans since 1750 (<2 W m-2).
https://notrickszone.com/wp-content/uploads/2017/03/Uncertainty-Error-LW-Radiation-IPCC-AR4.jpg
—
IPCC (2007):
“Unfortunately, the total surface heat and water fluxes are not well observed. Normally, they are inferred from observations of other fields, such as surface temperature and winds. Consequently, the uncertainty in the observational estimate is large – of the order of tens of watts per square metre for the heat flux, even in the zonal mean.”
—
IPCC (2013):
“The overall uncertainty of the annually averaged global ocean mean for each term is expected to be in the range 10 to 20%. In the case of the latent heat flux term, this corresponds to an uncertainty of up to 20 W m–2. In comparison, changes in global mean values of individual heat flux components expected as a result of anthropogenic climate change since 1900 are at the level of <2 W m–2 (Pierce et al., 2006).”
“How much can LW ‘affect’ the temperature of a body of water relative to the ‘affecting’ achieved by shortwave radiation, Craig?”
https://www.vocabulary.com/articles/chooseyourwords/affect-effect/
It depends on the conditions. During the arctic winter there is no shortwave radiation while longwave radiation is around 150 W/m2. In the El Nino example I gave SWR dropped from 290 to 180 W/m2 and downward LWR increased 10 – 15 W/m2, enough to keep temperatures from falling.
“Why did your paper not even mention CO2, Craig?”
In that case the change in downward LWR was from the water vapor in the increased cloud cover. Until you take readings for years at a time in a single location you won’t see changes in downward LWR from CO2. (https://www.nature.com/nature/journal/v519/n7543/full/nature14240.html) But when downward radiation is analyzed the contribution is seen.
Many papers include the spectral breakdown of LWR as seen in this graphic. (http://i.imgur.com/65czmm6.jpg) CO2 is the only material in the atmosphere that emits at the 550 to 800 cm-1 range. That wavelength is the second strongest in LWR. In this study from the Antarctic CO2 released 2/3 of the radiant energy supplied by water vapor. (http://i.imgur.com/Uk5OAsr.jpg)
“These are little more than wild guesses. The errors and uncertainty in estimates of LW forcing are many times larger than the assumed total forcing from humans since 1750 (<2 W m-2).”
The margin of error was much better than you suggest in the paper "Observational determination of surface radiative forcing by CO2 from 2000 to 2010." (http://asl.umbc.edu/pub/chepplew/journals/nature14240_v519_Feldman_CO2.pdf)
“The time series both show statistically significant trends of 0.2W/m2 per decade (with respective uncertainties of plus/minus 0.06W/m2 per decade and plus/minus 0.07W/m2 per decade) and have seasonal ranges of 0.1–0.2W/m2. This is approximately ten per cent of the trend in downwelling longwave radiation.”
The paper found an increase of 0.2 W/m2 per decade warming directly caused by increases in CO2 with another 0.4 W/m2 per decade warming through increase in atmospheric water vapor. 50 years of continued emissions at the current rate would cause a 3 W/m2 increased forcing on temperature. Since the forcing comes from upward LWR being absorbed and emitted the increased DLR would continue throughout the night as well as the day.
Again, we’re talking about a hypothetical LW effect on the deep ocean temperatures, not the surface, Craig. 93% of the heat energy in the Earth system is in the oceans, and it’s predominantly the oceans that heat the atmosphere. SW can penetrate past the hair-thin skin layer and heat the first 10s of meters of the ocean, whereas LW radiation does not penetrate past the ocean skin. So your “150 W m-2” values do not apply here. On the other hand, indeed LW does affect the temperature of the Arctic surface. But it’s predominantly LW forcing from clouds, not CO2. For example…
—
http://www.nature.com/ncomms/2016/160112/ncomms10266/pdf/ncomms10266.pdf
Clouds are known to play a pivotal role in regulating the local SEB [Surface Energy Balance], with competing warming and cooling effects on the surface. … The satellite-based cloud observations allow to estimate the cloud impact on the SEB [Surface Energy Balance]. … The annual mean CRE [Cloud Radiative Effect] of 29.5 (±5.2) W m 2 provides enough energy to melt 90 Gt of ice in the GrIS [Greenland Ice Sheet] ablation area during July and August. … The snow model simulations, which capture the evolution of the GrIS SMB [Surface Mass Balance] from 2007 to 2010, indicate that clouds warm the GrIS surface by 1.2 (±0.1) °C on average over the entire period [2007-2010]
—
KR: “Why did your paper not even mention CO2, Craig?”
In that case? So does the change in downward LWR from water vapor and cloud cover somehow stop having an effect on downward LWR at some point, allowing CO2 to take over?
And then you linked to the Feldman et al. (2015) paper to attempt to support this claim. As I have pointed out to you before, the Feldman paper addresses modeled values for changes at the surface, not in the 0-2000 m ocean, where 93% of the heat changes from “global warming” occur. You keep on suggesting that you believe LWR is what warms up the ocean depths, Craig. You do understand that it’s SW forcing that does that, right?
Again, you’re talking at the surface again, not the ocean. Will you ever stop pretending that we’re talking here about LWR on land surfaces, Craig? We’re talking about LWR and ocean depths, where nearly all the net heat changes in the Earth system occur. And by the way, in the Antarctic, increasing CO2 actually cools the surface according to a modeling study by Smithusen et al. (2015).
Oh, look, it’s Feldman et al. (2015) again, which, again, does NOT address heat changes in the oceans.
—
IPCC (2007): “Unfortunately, the total surface heat and water fluxes are not well observed. Normally, they are inferred from observations of other fields, such as surface temperature and winds. Consequently, the uncertainty in the observational estimate is large – of the order of tens of watts per square metre for the heat flux, even in the zonal mean.”
—
IPCC AR5 (2013): “The overall uncertainty of the annually averaged global ocean mean for each term is expected to be in the range 10 to 20%. In the case of the latent heat flux term, this corresponds to an uncertainty of up to 20 W m–2. In comparison, changes in global mean values of individual heat flux components expected as a result of anthropogenic climate change since 1900 are at the level of <2 W m–2“
Changes in cloud cover provided about 5-10 times more radiative forcing than the alleged surface forcing from +22 ppm CO2 (0.2 W m-2) in recent decades. And cloud cover changes actually do affect ocean temperatures (SW).
—
http://www.atmos-chem-phys.net/13/8505/2013/acp-13-8505-2013.html
“[T]here has been a global net decrease [of 3.6%] in 340 nm cloud plus aerosol reflectivity [which has led to] an increase of 2.7 W m−2 of solar energy reaching the Earth’s surface and an increase of 1.4% or 2.3 W m−2 absorbed by the surface [between 1979 and 2011].”
—
ftp://bbsoweb.bbso.njit.edu/pub/staff/pgoode/website/publications/Goode_Palle_2007_JASTP.pdf
The decrease in the Earth’s reflectance from 1984 to 2000 suggested by Fig. 4, translates into a Bond albedo decrease of 0.02 (out of the nominal value of about 0.30) or an additional global shortwave forcing of 6.8 Wm2. To put that in perspective, the latest IPCC report (IPCC, 2001) argues for a 2.4 Wm2 increase in CO2 longwave forcing since 1850. The temporal variations in the albedo are closely associated with changes in the cloud cover.
—
http://www.atmos-chem-phys.net/12/9581/2012/acp-12-9581-2012.html
Atmospheric impacts on climatic variability of surface incident solar radiation
The Earth’s climate is driven by surface incident solar radiation (Rs). Direct measurements have shown that Rs has undergone significant decadal variations. However, a large fraction of the global land surface is not covered by these observations. Satellite-derived Rs has a good global coverage but is of low accuracy in its depiction of decadal variability. This paper shows that daily to decadal variations of Rs, from both aerosols and cloud properties, can be accurately estimated using globally available measurements of Sunshine Duration (SunDu). By merging direct measurements collected by Global Energy Budget Archive with those derived from SunDu [sunshine duration], we obtained a good coverage of Rs [surface incident solar radiation] over the Northern Hemisphere. From this data, the average increase of Rs [surface incident solar radiation] from 1982 to 2008 is estimated to be 0.87 W m−2 per decade [2.3 W/m-2 total]
“Now that I’ve shown that longwave radiation can affect water temperature”
Once you apply enough power directly to the surface to overcome natural evaporative cooling.
600K to 800K, applied centimetres from the surface….
…. and you want to discuss REALITY???
A truly DESPERATE and DECEITFUL ploy.
What is your reality AndyG55?
A body of water with any temperature without an atmosphere between it and space (or lets say with the atmospheric window letting through all LW radiation) would obviously radiate towards space accourding to the SB-law. Do you agree or disagree?
Now there is downwelling LW radiation that reduces this radiative output, but you are saying evaporation and convection are picking up the slack and just increase accordingly so the ocean/surface doesn’t have a chance for heat to build up. Do you agree or disagree?
Unfortuneately those things can be measured. Do you have any numbers for us that would show that convection plus evaporation are causing the surface to get rid of the same amount of energy that is represented by the downwelling LW radiation? The amount must be even greater, because it has to get rid of most of the SW radiation from the Sun, too … right?
So what are the magic numbers? How much W/m² convection and evaporation?
REALITY is that there is NOT a 600K to 800K heater just centimetres above the surface.
Or are you TOO DUMB to figure that out ???
Again with the NOT REAL yapping.
There IS an atmosphere , seb.
FACT
The only downward LW radiation is from H2O. CO2 does not radiate below 11km.
Evaporation and latent heat from any possible REAL LW atmospheric radiation will always counter that small amount of LW radiation.
If you use back to back radiation flux meters, you will find there is pretty much always an outward flux over water.
Its BASIC PHYSICS, as if you had any comprehension of any sort of physics.
LW does NOT penetrate the surface, it causes evaporation , and thus a slight cooling due to losses via latent heat… observed, measured.
SW penetrates the surface, and is the ONLY sort of radiation responsible for ocean heating… observed measured.
It takes something like a blow-torch or 600-800K heater a very close to the surface to actually overcome evaporative cooling. NOT REALITY, is it seb.. if so.. tell me where this happens in real life ??
Take that heater in the little experiment back a couple of metres from the surface.. do you really, in your wildest hallucinogenic imaginings, think that it would cause any warming except via the container and the surrounding air.. are you REALLY THAT DUMB ???
Are you reading a comment sentence by sentence and then hit reply whenever you read something you oppose before finish reading the whole comment? These reply “chains” sure look something like that.
I didn’t write about 600-800 K heaters, I did clarify in parentheses what I meant with “no atmosphere” and you are again writing that downward LW radiation is only causing evaporation, yet refuse to give numbers how much W/m² of heat loss evaporation is causing.
Probably over any surface that is warmer than the atmosphere. What are you trying to say with that sentence? That heat flow is always from warm to cold? Yeah, of course it is.
Laws of thermodynamic: you can’t cool something by radiating towards it. Never! Even if it were true that any LW radiation that gets absorbed by a body of water is immediatly converted in evaporation heat loss, it is impossible for this effect to cool the body of water, because the used up energy is external. The only way for evaporation to cool something is if it uses up internal energy.
“A body of water with any temperature without an atmosphere between it and space”
You really ARE a scientifically illiterate twerp, aren’t you, seb.
Don’t you comprehend anything to do with partial pressures…
Don’t you know what would happen to the water if there was no atmosphere….
You seem to be basically IGNORANT about everything…
.. which is almost certainly why you always want to invent mindless, hallucinogenic, FANTASIES..
As I’ve said … clarified that in parentheses. You apparently overread that in your rage.
You only seem to want to deal with FANTASY situations.
Try an another analogy.
…. maybe that will help you comprehend. !
“Do you have any numbers for us that would show that convection plus evaporation are causing the surface to get rid of the same amount of energy that is represented by the downwelling LW radiation?”
The VERY FACT that the surface 1mm or so COOLS slightly (observed and measured), under evaporation should give even your nil-science, brain-washed, single-synapse-mind a clue. !!
I’m curious if SebastianH actually acknowledges that the oceans’ surface skin (0.1 to 1 mm) is a few tenths of a degree cooler than the layer directly beneath, as this has indeed been measured. Then, when considering that the deepest that LW radiation can penetrate is the surface skin, what would he say that the cooler skin is attributed to? Can you answer that, SebastianH? Why is the surface skin cooler than the layer beneath it? What’s the mechanism?
—
https://www.arm.gov/publications/proceedings/conf07/extended_abs/minnett_pj.pdf
“Located at the upper limit of the molecular boundary layer, the skin temperature is generally a few tenths of a degree cooler than the temperature a few millimeters below it because of heat loss by sensible and latent heat fluxes as well as outgoing longwave radiative fluxes”
—
http://onlinelibrary.wiley.com/doi/10.1111/j.2153-3490.1963.tb01399.x/pdf
“While short-wave radiation will warm both surface and subsurface layers, long-wave radiation will cause a cooling of the surface depending on the temperature and humidity of the air.”
—
fvcom.smast.umassd.edu/Courses/MAR555/Suppl_Reading/Fairall_etal_1006.pdf
“The cool skin represents a few tenths of a kelvin cooling by radiative and turbulent fluxes in the upper millimeter of the ocean”
—–
http://onlinelibrary.wiley.com/doi/10.1002/jgrd.50786/full
“intense daytime solar heating [SW] overcomes the net upward longwave energy flux [cooling] and warms the skin”
poor seb ,, no matter how many clues you give him,
he just loses them…
so, after all this time…
HE STILL DOESN’T HAVE A CLUE !!
The surface layer doesn’t cool because of incoming LW radiation. That is physically impossible. It is definetly cooler than it would be without evaporation caused by the increase in heat content build up, but it can never be cooler than the temperature it would have without downwelling LW radiation and your claimed equal upward evaporation effect. Never!
@Kenneth:
The ocean gets warmed by the Sun. A warm ocean surface exchanges heat with its surroundings by evaporation, contact with the atmosphere, radiation, etc. That happens at a faster rate than energy from below is reaching the surface, thus the surface layer is cooler than the layers below.
This gradient defines how much energy is transfered away from the ocean. Increasing LW radiation increases the temperature of the surface layer slightly, causing a shallower gradient which represents less heat loss and results in heat content build up.
The downwelling LW radiation doesn’t cool the surface, because that would mean that more than the amount of energy it contains gets used up in the resulting evaporation change. That’s physically impossible.
So, now you two have successfully evaded my question about numbers and made me answer your question … what about an answer to my questions?
Again, your TOTAL AND COMPLETE IGNORANCE of the mechanics of evaporation is quite amazing.
It is pointless even trying to explain…
… because you just DO NOT WANT TO LEARN or UNDERSTAND. !!
You are beating us to boredom with your incessant zero comprehension yapping !!
Read it again. Its as though you are deliberately acting like a low IQ pre-teen
It is a FACT that the surface 1mm or so COOLS slightly (observed and measured), under evaporation.
If you can’t think it through from there..
… then you have ZERO brain, or are CHOOSING to remain WILFULLY IGNORANT.
I’ll gladly repeat it for you: incoming LW radiation, even if 100% of it would go into an increase of evaporation can never cool the water surface.
You can never cool stuff by bombarding it with energy. Impossible.
Before you reply something along “but refrigerators work” or “but they use lasers to cool atoms to near absolute zero”, think again what is really happening in these events. If you cool one place, there is always a place that gets even warmer. So if LW radiation could really cool the ocean surface, where is the place that gets warmer in return?
Again, YOUR ignorance of the mechanism of evaporation, leaves you at the same level of totally incompetence as you are destined to remain at.
Do you really DENY that evaporation cools the surface.??? Seriously ??
Are you REALLY that unobservant and incredibly DUMB !!
“where is the place that gets warmer in return?”
Your question, yet again, shows you have absolutely ZERO comprehension of the what evaporation involves.
It also shows you have absolutely ZERO intent of ever wanting to know.
Your bLatent and wilful ignorance is on record.
Another “clue” for seb-the ignorant, if you use back to back spectrum analysers over ocean water , you generally get an OUTWARD flux in the shortwave spectrum.
For the first time in your life, seb…
… lower your religious AGW brain-block, and,
… Try to THINK !
I’ll try to give you a hint: how does evaporation cool a surface? Where does the energy come from? What does evaporation cool if the energy comes from an external source? Nothing … there is no temperature change at all if what you say were true and all incoming LW radiation would only cause evaporation. Not from the evaporation that is fueled by this external source of energy.
But we all know that your magic theory anyway. Evaporation doesn’t suddenly increase by 50 W/m² when a cloud forms and thereby increases downwelling LW radiation by 50 W/m².
If only you would be able to tell us some numbers. How much W/m² of energy loss is caused by evaporation? How much by convection? How much by radiation?
Don’t evade this time!
And why haven’t you answered any of my questions about the experiment?
The foam insulation, inside or outside?
And if they had that insulation, how did they take pictures
I find it very odd that in time when basically everyone has a camera in their phone, they choose to use an badly labelled child-like diagram instead of pictures of their experiment.
I hope this doesn’t get deleted, because it is important that you guys understand why the CO2 calculation above is incorrect. Otherwise we don’t ever need to discuss this.
Total emissions over 9 years (2006 – 2014):
A is total emissions from nature
B is total emissions from humans (= 82 GtC)
C is total absorption from nature
D is total increase of CO2 concentration (16 ppm = 33 GtC)
A + B = C + DFrom this certain things follow:
1) C is greater than A
2) Since B is greater than D, we are able to say that B causes all of D. If B would be 0 would not be positive.
Now Kenneth’s version:
A1 is base emissions in the first year from nature
A2 is increase in emissions from nature in that timespan
B1 is base emissions from humans (8.363 GtC/year)
B2 is increase in human emissions in that timespan (1.432 GtC/year)
D1 is CO2 base concentration in first year
D2 is increase of CO2 concentration (16 ppm = 33 GtC)
(A1 + A2) + (B1 + B2) = (D1 + D2)which then becomesA2 + B2 = D2when Kenneth wants to find out who is responsible for the increase.It should be immediately clear that his makes no sense at all and can only be called wrong. Hint: units!
If you want to compare rates as Kenneth suggests, then you’d have to do the same for CO2 concentration. Take the yearly increases (unit: GtC/year) and get the difference from the first year. You get something like this: http://www.woodfortrees.org/plot/esrl-co2/from:2006/to:2015/compress:12/derivative/mean:3
D2 is now 0.45 ppm or 0.954 GtC and is lower than B2. Case closed and units are correct.
Any objections?
Sorry, SebastianH, but you continue to make the same errors over and over again, which makes your calculations wrong. You’re completely ignoring the dramatic increase in natural emissions that is necessarily defined by the IPCC formula 1 ppm = 2.12 GtC. This will be at least the 4th time I have explained this to you, and yet it is highly likely that you will ignore these identified errors and repeat your incorrect conclusions again. Here it is again…
Total emissions over 9 years (2006 – 2014):
…which is 1,910 GtC during 2006-’14 when considering the IPCC (AR5) has natural carbon out-emitting the human contribution at a ratio of 95.7 to 4.3. (Multiply the anthropogenic total emission [82 GtC] by 23.3 to achieve the 95.7 to 4.3 ratio). That’s about 212 GtC/year for the natural yearly emission on average during 2006-’14, which is similar to the values shown in IPCC AR5 (198.7 GtC/year from natural sources, 8.9 GtC from humans).
Since the 16 ppm CO2 increase (380 to 396 ppm) between 2006 and ’14 is the equivalent of a 33.92 GtC (1 ppm = 2.12 GtC) increase in total emission rate per year (human + nature), and since there was an overall 1.43 GtC increase in human emission rate per year (8.363 GtC in ’06 vs. 9.795 GtC in ’14, or +0.16 GtC/year), this means that 32.5 GtC of the total yearly increase (33.92 GtC – 1.43 GtC) during those 9 years came from non-anthropogenic sources. In other words, in 2006, nature was emitting somewhere around 180-185 GtC/year, and by 2014 the rate for natural emissions had risen by 30-35 GtC/year, or to about 210 to 215 GtC/year.
Again, you are completely eliminating the far more substantial natural emissions rate increase from your “explanation”, rendering all your conclusions incorrect. I keep on explaining this to you, and you keep on ignoring it.
OK, yes, it’s actually a slight bit more than that, but I used 82 GtC (9.1 GtC) above anyway.
Which is an unknown and guessed-at figure, and it is only assumed by those like you that, somehow, the entirety of the 1,910 GtC emission increase from natural sources over 2006-’14 was neatly absorbed by an equal growth in natural sinks , but the atmosphere decided not to absorb the 82 GtC contribution from humans, allowing the contribution from humans to be solely responsible for the increase. To me that would appear to be magical thinking.
Actually 33.92 (16 X 2.12), but okay, that’s close.
From this certain things follow:
Well, again, it is your assumption that every single carbon emission from natural sources (which rose by ~1,910 GtC between 2006-’14) has (a) been matched by an identical growth in carbon sinks (and then some), and (b) only the anthropogenic emissions are not absorbed. Both (a) and (b) are non-observed assumptions.
No, this is wrong on two counts. First, you wrongly compare the total amount of GtC change (82 GtC) for the 9 years instead of correctly comparing the increase in the yearly rate of emission, which is 1.43 GtC/year total for the 9 years (8.363 GtC/year in ’06 to 9.795 GtC/year in ’14, or 0.16 GtC/year) to the change in CO2 concentration per year (1.78 ppm on average). Secondly, you again completely ignore the natural emission rate increase, which was about 212 GtC/year, or about 1,910 GtC total over the 9 years. 212 GtC/year is 23.3 times greater (95.7 to 4.3) than 9.11 GtC/year (humans), and 1,910 is also 23.3 times greater than 82 GtC (humans).
Again, considering the overall human emissions increase was 1.43 GtC/year for the 9 years, and the rest (32.5 GtC) of the 33.92 increase in yearly emissions during the 9 years had to have come from natural sources, this means that humans only contributed 0.07 of a ppm during those 9 years, with 15.3 ppm coming from the increases in natural emissions.
You’ve decided that the natural emissions increases don’t count, and only the anthropogenic emissions count, and then leaped to the illogical conclusion that because you have ignored the increase in natural emissions, therefore humans caused all of the CO2 concentration increase. And yet no matter how many times I explain this to you, you still either don’t understand your error or you are pretending like you don’t understand.
I didn’t decide anything, it follows from the very simple math involved here. I write it again, just for you: you have a wrong perception of what CO2 concentration is. An increase of 16 ppm is not some rate (GtC/year), it is an increase of the total amount of CO2 in the atmosphere (just GtC).
You are not able to see that and will likely stay with your (incorrect) version. That’s ok, at least now I know why you act like you do.
That’s not correct. The amount of carbon in the atmosphere increased by 33.92 GtC, not the rate. The rate is the yearly increase of ~2 ppm. An increase in that rate can be compared to the increases in natural and human emissions … because same units. What you are doing is just wrong.
Would you be so kind and calculate that backwards and tell us the year nature’s emissions were 0 GtC/year then? The absorption rate must have been close to 0 GtC/year too in that year. Was it in the 1950s? 60s? This alone should indicate to you that you are not correct (if the unit thing isn’t obvious to you).
There is a glimpse of hope in this sentence. You want me to compare the rate increase (1.43 GtC/year) to the change in CO2 concentration (1.78 ppm on average). That’s so close, but the later one needs to be the increase in that change to be comparable (see: http://www.woodfortrees.org/plot/esrl-co2/from:2006/to:2015/compress:12/derivative/mean:3). Then both values mean the same thing. And – oh wonder – human emissions increase is bigger than CO2 concentration change increases. Case closed. Or so it should be, if you understood where you went wrong with this one.
No, the 33.92 GtC value is not an increase in yearly emissions, it is the increase of total CO2 in the atmosphere. Again … units should have given it away!
Is it so hard to admit your error or do you really not see the problem with your calculations?
You are completely wrong here. The increase of total CO2 in the atmosphere would be the 82 GtC from humans over those 9 years plus the 1,910 GtC increase from nature over those 9 years, which is about 221 GtC/year, meaning that the 33.92 GtC/year rate change came from that (~190s GtC/year to 220s GtC/year). Again, this is using the IPCC’s own values (i.e., AR5 had the human + natural GtC emissions as ~208 GtC/year).
You continue to make the same “mistake” of pretending that the increase in natural emissions, which out-ratio the human emissions by 23.3:1, never happened during those 9 years. You are pretending that the only emissions that changed during those 9 years was the human emission. No matter how many times I point this seemingly intentional omission/error out to you, you continue to cover your ears and close your eyes.
No, wrong again. As stated multiple times now, the rate increase is 0.16 GtC/year for humans according to the Global Carbon Budget; 1.43 GtC/year is the overall rate increase for the whole 9 years. So, again, it’s a rate increase of 0.16 GtC/year that is compared to the 1.78 ppm increase, and it’s the 1.43 GtC/year that is compared to the 16 ppm increase. You’re wrongly comparing an overall change for 9 years to a 1-year change in CO2 concentration. Comparing a 9-year overall rate change to a 1-year rate change is wrong. Considering you do this so routinely, and considering your track record of dishonesty, I am not inclined to believe that your comparison of a 9-year change to a 1-year change is just a mistake on your part. I’m thinking it’s intentional.
And when we compare a rate increase of 0.16 GtC/year to the change in CO2 concentration over 1 year (1.78 ppm) and use the IPCC formula 1 ppm = 2.12 GtC, we get a human contribution of about 0.07 ppm/year vs. a non-anthropogenic contribution of 1.71 ppm/year.
Stop pretending that the natural emissions increase doesn’t count, and only the human emissions increase does.
No, that just the total emissions of humans and nature combined. That’s not an increase of CO2 in the atmosphere. Also, where is CO2 absorption in your calculations? 1910 GtC + 82 GtC results in 33.92 GtC of additional CO2 in the atmosphere, so nature must have absorbed 1958.08 GtC in the same timespan.
It did never happen. Where do you get that information from? You are taking the IPCC ratio and think that somehow describes the ratio of increases in emissions. Why? It’s just the ratio of nature’s emission vs. human emission. ~9.5 GtC human emissions and 228 GtC of natural emission.
No I am not. Take a step back and reassess what I am writing. You are not comparing apples to apples. The units of the values you are calculating with should have given it away.
Let’s do this really sloooow. CO2 emissions by humans changed by 1.43 GtC per year in this 9 year timespan, so it was 1.43 GtC higher at the end than in the beginning. You want to compare that to the 16 ppm increase of the CO2 concentration, but this isn’t a rate increase it is an increase of a total amount. You can get the rate increase by looking at the yearly ppm increases of the CO2 concentration and equally subtract the first value from the last value. Since the increases aren’t only depending on human emission changes, you have some fluctuations in a short timespan of 9 years, but you can get an idea of the rate increase by looking at this graph: http://www.woodfortrees.org/plot/esrl-co2/from:2006/to:2015/compress:12/derivative/mean:3
That’s what you need to compare. Or … like normal people, you just compare the totals. 33.92 GtC of added carbon in the atmosphere vs. 82 GtC of emissions by humans.
I thought so … you are blinded by your skepticm, that you can’t even entertain the thought that you could be wrong. I am not comparing different values to each other that aren’t comparable, you are. I gave you two analogies, but you “needed to vomit”.
Show this short discussion to friend of yours that you think don’t suck at math and let them educate you. Please!
You can not do that. You have to take the derivative from the second value to be able to compare those two. Only then the units match, which should be a dead giveaway of this being wrong.
Again, I am not pretending anything like that. However, natural emissions might have increased in that timespan, but natural absorption increased even more then. The exact values of both, I don’t know and they are not important for this calculation. Something that appears to be beyond your understanding of math.
You conveniently ignored my request to calculate the natural emission back a few more decades. Can you please just do that and maybe see where you are wrong when you arrive at negative emissions (impossible) in the past.
Starting point is this:
Let’s go back in the lovely year 1958. CO2 concentration was ~315 ppm and increased to ~380 ppm in 2006. Roughly … So that’s 137.8 GtC, correct? You are saying this is an increase and ~96% of it are caused by nature … so in your mind natural emissions had risen by ~132 GtC/year since back then to the 180-185 GtC/year value of 2006. So natural emissions in 1958 were around 50 GtC/year?
Are you sure? Do you see your error now? Continueing this natural emissions should have been 0 GtC/year in the same year that CO2 concentration was around 295 ppm. I wonder what CO2 all the trees in that year consumed/absorbed when there wasn’t any new natural CO2 in the atmosphere and human CO2 emissions were also very small.
I have only a few minutes to respond to the latest version of your stated beliefs…
Or, like normal people, you can just compare the totals. 33.92 GtC of added carbon in the atmosphere vs. 1,910 GtC of emissions by nature (using the IPCC ratio of 23.3:1 for natural vs. human emission).
Would “normal people” realize that 1,910 GtC is greater than 82 GtC, SebastianH? Do “normal people” just pretend that only the 1,910 GtC in increased natural emissions is absorbed by nature, but nature has made the conscious decision not to absorb the 82 GtC from humans? That’s what you’re asking me to believe: natural emissions are always absorbed by an equal proportion of natural sinks; only anthropogenic emissions are not absorbed.
You continue to make the same “mistake” of pretending that the increase in natural emissions, which out-ratio the human emissions by 23.3:1, never happened during those 9 years.
That sums it up. You believe that natural emissions do not increase. Only anthropogenic emissions do.
You necessarily believe that the abundance of termites (and there are “three quarters of a ton of termites for every person on earth”), which emit “more than twice” as much GtC as humans do (Zimmerman et al., 1982), has remained constant…even though the Earth has undergone a dramatic greening in the last few decades. No matter. Natural emissions from termites are the same today as in the 1980s. No increases. Only human emissions increase. Ridiculous.
I have to ask for clarification: have you noticed your mistake and that’s why you now pivot towards another way to “prove” that I am wrong and you are not?
Yes, very good. That’s a total too. And what do we get when we add all the totals up? 1910 GtC + 82 GtC – 33.92 GtC = what nature absorbed in the timespan of those 9 years. Do you agree or disagree?
You mean total emissions, not the increase, do you? Easy to confuse.
No, that is not what I am saying. I am saying that because the amount of CO2 in the atmosphere increased by 33.92 GtC in 9 years nature must have absorbed 33.92 GtC less carbon than what was emitted in those 9 years (by nature and by humans). If we substract the human contribution (82 GtC) from that equation we end up with nature absorbing ~48 GtC more than what was emitted by just nature in those 9 years. That’s all. Simple math.
I am not saying that every molecule of those 33.92 GtC can be traced back to human origin, and I am not asking you to believe anything. I am asking you to accept what those numbers tell us. If you’ve seen where you made the mistake above, then you should be able to clearly see this too.
No I don’t. Please stop putting words in my mouth! I wrote that “it did never happen” and “it” is “the increase in natural emissions out-ratio-ing human emissions by 23.3:1″. The important part is the increase … it’s not the increase that is quantified by this ratio, it’s the total yearly emissions. Humans 82 GtC in 9 years and nature 1910 GtC in 9 years.
Natural emissions could have been increasing or decreasing by any amount. It doesn’t matter, since we know that nature absorbed 48 GtC more carbon from the atmosphere than what was emitted by nature (see calculation above).
That being said, of course you could also attribute the increase in CO2 in the atmosphere to termites if you like. A world without termites would certainly have no termite emissions and if those are really more than twice the amount of humans than it’s totally valid to say: the emissions of termites caused the CO2 increase in the atmosphere. If you can find any one source of emissions that is bigger than the atmospheric CO2 increase, you can say that it caused 100% of the increase, because it would not have happened if the source would not have been there.
Got it? We want to know if human emissions are enough to account for all of the CO2 increase and they are. So if we could stop emitting tomorrow, there would be no more increase. If all termites would stop their emissions tomorrow, there would be no more increase.
There is no need to believe anything here. It’s just accounting, logic and math.
No. I don’t do things like that. I literally had about 5 minutes to respond and didn’t have the time to do more than point out that, once again, you have decided to pretend that natural emissions haven’t increased and/or only natural emissions are absorbed, and human emissions do not get absorbed.
Long ago I had already noticed the “problem” with going back decades with the overall increase (i.e., rising from 190 GtC to 220 GtC in recent years, which would mean it was <100 GtC in the 1950s, etc.). To me this just went to show just how "off" the guesses/estimates of the overall natural emissions are. It's highly likely that the ~200 GtC/year of natural emission is a vast underestimate. I no more trust the IPCC's accuracy on GtC emissions than I do trust that our guesses about past CO2 concentrations are accurate. There are Vostok measured values of 400-700 ppm during the Holocene, for example, that are ignored in favor of the lower values.
But because I can't go making up my own estimates of GtC emissions per year (it's probably 2 or 3 times higher than 200 GtC/year), and because you necessarily have to accept the IPCC's estimates since that's the AGW Bible, I just go with the 198.7 GtC to 8.9 GtC values from AR5 (95.7 to 4.3 ratio, or 23.3:1) because it still demonstrates the point.
Or, like normal people, you can just compare the totals. 33.92 GtC of added carbon in the atmosphere vs. 1,910 GtC of emissions by nature
I am smiling here. Yes, an addition of 212 GtC every year for 9 years (1,910 GtC total) is about 23 times greater than the addition of 9.1 GtC every year for 9 years (82 GtC). Interesting how in your A, B, C, D… analysis you somehow failed to even mention these values. Instead, you ignored them. A completely honest oversight, right, SebastianH? Why do you pretend like the addition of 1,910 GtC over 9 years is worth ignoring, but the addition of 82 GtC over 9 years is worth putting into your A, B, C, D… analysis so that you can claim that B is the 100% cause of D? Rhetorical question. I know why you do this.
To have humans be the sole contributors to the CO2 concentration, you necessarily have to believe that nature absorbed the addition of 1,910 GtC, but failed to absorb the addition of 82 GtC. That’s magical thinking. The 1,992 GtC total was emitted by nature + humans. The absorption doesn’t distinguish between natural and anthropogenic emission.
You did it again. You just ignored the natural emissions (1,910 GtC) during those 9 years, only counted the human emissions (82 GtC) during those 9 years, and then concluded that humans therefore caused the increase. Your “errors” of omission never stop.
There you go again, assuming that you “know” that natural sinks neatly absorbed the natural emission, leaving the anthropogenic emission to cause the increase in CO2.
So if you find it perfectly acceptable to attribute the increase in CO2 concentration to termites, whence comes the certainty that human emissions are the cause? (And you used that word.)
And since natural emissions are enough to account for all of the CO2 increase — and they are — then natural emissions caused the increase. Wow. Riddle solved. Humans caused 100% of the increase. Termites caused 100% of the increase. Therefore, both humans and nature caused 100% of the increase. How logical.
By the way, SebastianH, what do you think it means here when these scientists say that the change/increase in fossil fuel emissions aren’t strong enough to account for the CO2 change? Why are they wrong?
—
Jones and Cox, 2005
http://onlinelibrary.wiley.com/doi/10.1029/2005GL023027/full
There is clear similarity between Figures 1b and 1c, with the positive CO2 growth rate anomalies corresponding to El Niño events, and the negative growth rate anomalies corresponding to La Niña events. The largest positive CO2 growth rate anomalies are coincident with large Niño3 values in 1973, 1988 and 1998. … It is unlikely that these anomalies can be explained by an abrupt increase in anthropogenic emissions, as the anomalies are much larger than annual increases in fossil fuel emissions. Most interannual variability in the CO2 growth rate is attributable to variations in land-atmosphere CO2 exchange with climate (e.g., associated with ENSO or volcanic perturbations)
—
Also, I jfound this in my (2,000-page) database. I must have copied/pasted it from a comment board about 3 or 4 years ago..but I don’t have the link associated with it. What’s below looks like what I have been writing. The below italicized words are not mine…
The natural versus anthropogenic carbon emission ratio as of 2013 from IPCC AR5, Figure 6.1:
http://www.climatechange2013.org/images/figures/WGI_AR5_Fig6-1.jpg
Natural emissions total: 198.2 GtC
Anthropogenic emissions total: 8.9 GtC
Ratio in terms of 100% total 207.1 = 95.7 to 4.3
In other words anthropogenic emissions, which include fossil fuel emissions were still only 4.3% of total emissions in 2013 even though they had risen from 4.3 GtC per year in 1970 to 7.8 GtC per year in 2005.
Using the conversion factor 2.12 Gt C = 1ppmv CO2 (IPCC) and data sources: Carbon Budget report http://www.globalcarbonproject.org/carbonbudget/ Historical CO2 data: ftp://aftp.cmdl.noaa.gov/products/trends/co2/co2_annmean_mlo.txt
Incremental rises and incremental growth averages:
35.36 GtC – total carbon rise 2005 to 2013
2.1 GtC – fossil fuel rise 2005 to 2013
3.93 GtC per year – total carbon rise 2005 to 2013
0.23 GtC per year – fossil fuel rise 2005 to 2013
So from 2005 to 2013, total atm carbon was rising just under 17 times faster than anthro emissions growth.
Man, are you stubborn …
No I didn’t. Why aren’t you able to see this?
As I’ve written again and again, it is irrelevant exactly how high the natural emissions are. They could be 1 million GtC in those 9 years and the math still would not change. Why? Because we’ve only seen an increase of 33.92 GtC in those 9 years. That means that at least 1 million minus 33.92 GtC were absorbed. With the addition of 82 GtC human emissions we then know that 1 million plus ~48 GtC were absorbed in those 9 years. Why aren’t you able to see this?
Because they don’t matter. See above. You can insert any value that you want for A, because we know B and D, the value for C (natural absorption) can be calculated from whatever value you insert for A.
It is not ignored. It gets absorbed by nature (C) … otherwise the increase in atmospheric CO2 would be astronomical in size. We obviously didn’t observe something like that … the increase was just 33.92 GtC. C depends on A, because B and D are known values and C is – in this case – 48 GtC greater than A.
Of course nature absorbed the addition of 1910 GtC, otherwise there would be 1910 GtC of additional carbon in the atmosphere. It obviously didn’t absorb the total of 1992 GtC, because we measured additional 33.92 GtC in the atmosphere. That means ~1958 GtC were absorbed.
I really feel like I am explaining basic math to a 6th grader here. Is it really that complicated to you that I have to repeat it over and over?
And yes, absorption doesn’t distinguish. Why would it? Again, I am not saying that every molecule of those 33.92 GtC is of human origin. I am saying that without human emissions there would have been no additional 33.92 GtC (also without termite emissions, but I am getting to that later).
Another repetition is necessary? We know that, because see above. Absorption was higher than natural emissions and lower than natural emissions plus human emissions. Otherwise we would not end up with additional 33.92 GtC in the atmosphere.
Do I really have to explain this again? Take a cups of water and use it to fill a bucket with water. Stop when the bucket is full. You can attribute the bucket being full to any of the individual cups you used, because it wouldn’t be full if you hadn’t poured the cup into the bucket.
Without human emissions the carbon content of the atmosphere would not have increased in that 9 year timespan. Why? Because those emissions were greater than the observed additional CO2. Same goes for termite emissions and of course for all natural emissions, but we are still discussing whether or not AGW is real or not here, are we? Therefor we want to know the human influence. If killing half the termites solves the problem by compensating all of our emissions, ok … I wonder why nobody has proposed that solution yet.
Now to your second reply:
That is not what they are saying and I feel I have commented on this paper multiple times already. What they are saying is that yearly ppm increases vary and they vary by more (up and down) than what human emissions vary. See: http://www.woodfortrees.org/plot/esrl-co2/compress:12/derivative.
Those variations are however smaller than total human emissions, showing that year over year variability of natural CO2 emissions/absorption difference is pretty stable.
The second half of your reply repeats the same mistake you are making or maybe this is your source for the mistake?
You assume (in this case) that atmospheric CO2 content was in some kind of balance with emissions/absorption in 2005 and only additional emissions on top of the emissions in this year could have increased the CO2 content of the atmosphere. Correct?
That’s the mistake you are making. There was no balance in 2005, if the emissions (human and natural) could freeze at the 2005 levels and not change at all, the atmospheric CO2 content would still increase further until balance is achieved. A paper describing how this works has even been published by you on this very blog (can’t find the link at the moment).
In other words, you have constructed an unfalsifiable hypothesis. No matter how much more dominant the natural emissions are, natural sinks always change just the right amount to absorb the increase. This hasn’t been observed, of course, but you believe it to be true nonetheless. It’s the classic “Heads, I win, tails, you lose” construct. There is no time in which natural emissions can ever be responsible in your scenario — natural sinks always change by the exact amount necessary to absorb all the changes in natural emission. In this way, only the anthropogenic emission can be responsible. You are unable to see that you have constructed an unfalsifiable hypothesis. This is the definition of belief.
You keep on writing 82 GtC as the overall change in human emission and comparing it to the 33.92 GtC. That’s wrong. 33.92 is the overall change in yearly emission. If the overall amount of yearly emission (natural + human) was 600 GtC/year in 2006, it was 639.92/year GtC in 2014. Of that growth, 1.43 GtC/year came from humans (8.363 GtC/year in ’06, 9.795 GtC/year in ’14). The rest, or 32.5 GtC, came from natural changes. To repeat, the change in yearly emission changed by 1.43 GtC/year for the human contribution, while the change in natural emission accounted for the rest. In other words, about 96% of the change in emission rate was natural.
I don’t think I have the motivation to keep on beating my head against the wall trying to help you understand your explanatory blindspots. You have your beliefs, and no matter how many times someone points out to you that that’s what they are, you insist that they are not beliefs, not assumptions, not unfalsifiable hypotheses…but Truth. I cannot help you critically examine your own beliefs. You have to do that yourself. So unless something monumental is written in your reply here, it’s rather pointless for me to continue trying.
Found the link:
https://notrickszone.com/2017/04/25/study-finds-burning-all-fossil-fuels-would-lead-to-only-max-500-800-ppm-co2-atmospheric-concentration
That is not what I have written and explained over and over. Natural emissions can change independently from natural absorption. So if we would see and increase of 10 ppm (21.2 GtC) of atmospheric CO2 content from 2017 to 2018 and humans still emitted only ~10 GtC, then obviously nature didn’t absorb all natural emissions in that year.
No! How often do you want to be corrected on this? 33.92 GtC is the additional amount of CO2 in the atmosphere, it is not a change in yearly emissions! It’s not even a change in yearly CO2 concentration.
No! No! And No! Those 33.92 GtC (no “per year) is the difference between all emissions (natural + human) in that timespan and the absorption in the same timespan. That’s the amount of CO2 that wasn’t absorbed and therefor remained in the atmosphere.
I beg you, show this thread to someone you know and let them tell you where you went wrong. If this is the reason why you doubt that humans cause climate change, it could possibly change your mind 😉
I made a spreadsheet for you, Kenneth. Maybe you’ll now see which columns/figures are comparable? Same color = same unit = comparable.
https://docs.google.com/spreadsheets/d/1kVDQO5xxGRC1J4TmJFJaHOfk-u6didRZaxwsxXahnk4/edit?usp=sharing
If that doesn’t make your error obvious to you … aks friends you trust to explain it to you.
Or in picture form for easier consumption: http://imgur.com/a/1mwnl
[…] fonte: notrickszone […]