In the wake of Category 5 hurricanes Irma and Harvey, Dr. Sebastian Lüning and Prof. Fritz Vahrenholt presented an analysis of what’s behind the hurricane activity and literature at their well known Die kalte Sonne climate website. Their hope is to bring the hurricane discussion back to some rationality.
The German media of course have been covering the story quite intensely, and at times hysterically. The general tenor of most statements: Hurricanes are not directly caused by climate change, however their power and destructiveness is increasing due to global warming.
The claim is that warmer oceans are providing the fuel to produce larger hurricanes.
As plausible as the theory may sound, Vahrenholt and Lüning decided to investigate the category 4 and 5 hurricanes and plotted their frequency over the past 100 years:
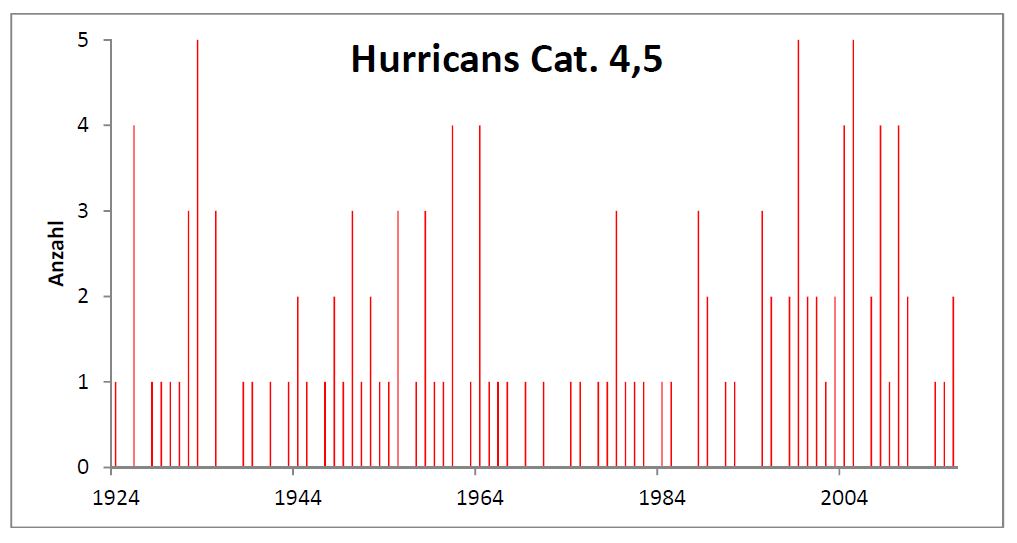
Fig. 4: The number of category 4 and 5 hurricanes between 1924 and 2016
There were quite a number of hurricanes in the 1930s and 1950s, as well as in the 2000s, but the trend has been sharply downward since 2010, despite the warming, and so considerable doubt swirls surrounding all the claims heard in the media.
No correlation found between man and hurricanes
Vahrenholt and Lüning looked at some scientific literature on hurricanes. For example a 2014 paper by Holland et al attempted to show man’s impact on hurricanes. Unfortunately the authors went back only to 1975, and produced the following plot:
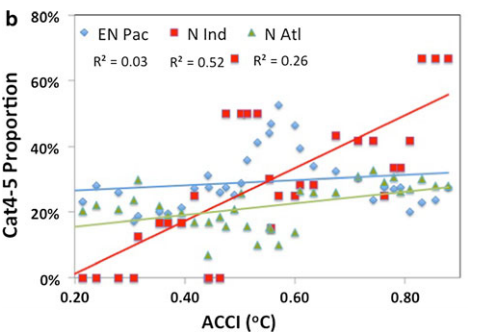
Fig. 5: The dependency of the share of Cat.4-5 storms on modelled temperature rises (ACCI) in different oceans, green represents the Atlantic region, red is for the Indian Ocean, and blue for the Pacific. Source: Fig. 5b from Holland et.al (2014).
Even using the data from the carefully selected 1975 to 2011 period does not produce any significant trend, Vahrenholt and Lüning note. Moreover the two German analysts say Holland relied on too few data points coming from the Indian ocean and falsely applied them to claim a “global” trend.
Using the great number of typhoons in the Pacific for the carefully chosen period yielded absolutely no correlation (R² = 0.03). Vahrenholt and Lüning add:
Adding in earlier data also leads to a collapse in correlation for the Atlantic, as the paper only sees a man-made share first starting in 1960. Here the a carefully selected period was sought out and found.”
Decadal variability in hurricane energy and the literature shows an influence by the AMO. A paper Kevin J.E. Walsh of the University of Melbourne tells us just how difficult it is to get understand hurricane strength:
However, the Atlantic basin is noted for having significant multidecadal variability in TC (Tropic Cyclons, d.A.) activity levels. The basin was characterized by a more active period from the mid-1870s to the late 1890s as well as the mid-1940s to the late 1960s. These periods may have had levels of activity similar to what has been observed since the mid-1990s.”
No evidence of a link
“Using the trends from the 1975…2011 period to infer a powerful anthropogenic impact of the recent powerful Atlantic events in light of what we know, borders on sheer audacity,” Lüning and Vahrenholt write. “Apparently the claimed evident relationship between man-made climate change and strengthening hurricanes is not supported.”
Hurricanes driven by Passat winds
Vahrenholt and Lüning cite a new paper to explain what impacts the energy of a hurricane. Mark A. Saunders of Great Britain and the USA diligently examined observations going back to 1878 and discovered a factor that describes the energy of a hurricane very well: the strength of the northern Passat winds.
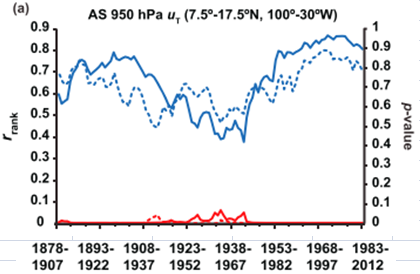
Fig 6: Correlation (r, blue) and its significance (p<0.1 is highly significant, red) on the hurricanes energy (ACE), -solid blue curve – and its number -dotted blue curve – with the Passat winds. Source: Fig. 3a from Saunders et.al (2017).
Driven by temperature differences between regions
A second related factor improves the correlation further: The temperature difference between the Main Developing Region (MDR) located within 10° – 20°N and 85°W – 20°W and the global tropical area within 10°S to 10°N. It is long known that hurricane development during times of El Nino is dampened and during La Nina it is enhanced, thus it has to do much more with natural oceanic variability.
Figure 8 below depicts the difference in sea surface temperature (SST) between the main developing region (MDR) and the tropics using observations ERSSTv5, with 10-year smoothing applied.
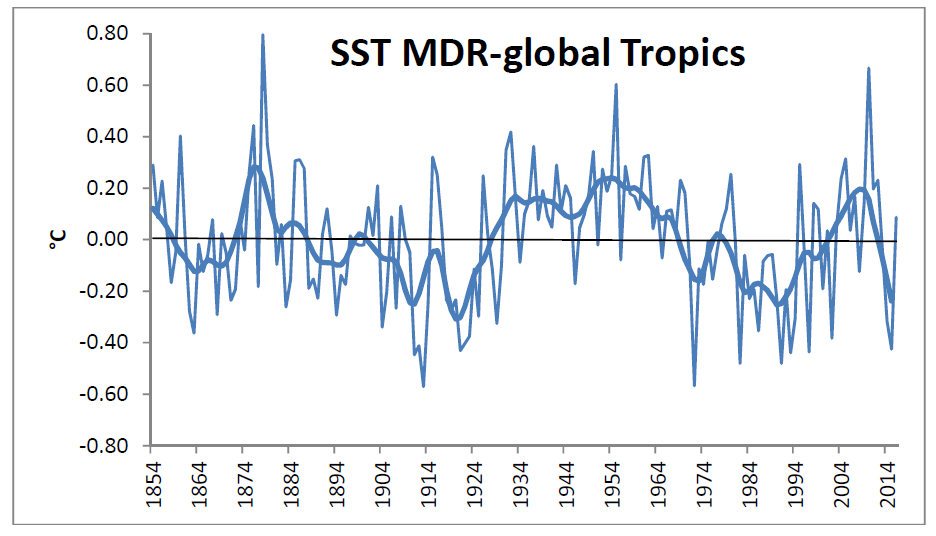
Fig. 8: The black line is not the horizontal axis, rather its is the linear trend! One observes the AMO similar pattern.
Lüning and Vahrenholt also cite literature showing that the Passat winds will not increase with climate change, but rather indicate a decrease in hurricanes.
All science that seriously looks at hurricanes show no worsening of hurricanes being caused by climate change.”
And what about the thermodynamics of greater evaporation leading to more hurricane energy? A report by Friederike Otto of Oxford finds that there are many possible interactions involved in this highly complex weather phenomenon:
Dynamical factors and thermodynamic aspects of climate change can interact in complex ways and there are many examples where the circulation is as important as the thermodynamics.”
Otto also points out that the climate models are far from adequate:
But in practice this requires climate models that are able to reliably simulate the weather systems in questions over and over again to assess the likelihood of its occurrence.”
Some media outlets have responsibly pointed out that the problems and destruction caused by hurricanes have much more to do with people living in hurricane vulnerable areas.
Sea level rise not a real factor in hurricane flooding
The claim that rising sea levels (10 cm since 1960) caused by global warming is major factor in hurricane destruction is also a non-factor in view of the fact that hurricanes generate waves that are 6 meters high!
Big driver: SST difference between MDR and tropics
In summary, the real hurricane driver of hurricanes is the SST difference between the MDR region and the global tropics. The following graph tells us why current hurricane activity is so high.
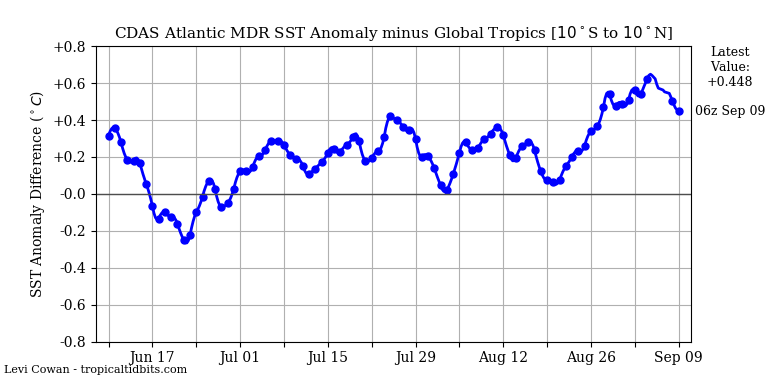
Fig. 9: The current sea surface temperature difference between the MDR and the global tropical oceans, source: Tropical Tidbits.
People living in hurricane vulnerable areas need to hope that the curve soon returns to zero. Here and with the bPassat winds doe we find the real reasons for the terrible hurricanes. Every thing else is propaganda on behalf of a “good cause”


Do not forget that the El Niño indexes began to decline as solar activity increased (geomagnetic).
https://www.tropicaltidbits.com/analysis/ocean/nino34.png
http://files.tinypic.pl/i/00933/buufisuvfmme.gif
Yep, the over all amount of death and destruction is not a scientific metric in any way shape or form, but it is the one the left is most often choosing to use because it suits their narrative. ie: “Super Storm Sandy”.
BTW it is probable that Jose will remain off the US coast though it could impact the Canadian coast. The new TS Lee is expected to go NW well out into the Atlantic and meet it’s death in the colder water there.
The storm to watch, is Tropical Depression #15. It could well develop into a major hurricane and impact the US coast.
Florida dodged a bullet with Irma thanks to Cuba and a stronger than expected trough that ate at the west flank as the east flank was over Florida.
RAH the surface of the Caribbean Sea still has a high temperature.
http://www.ospo.noaa.gov/data/sst/anomaly/2017/anoma.9.14.2017.gif
Here we have the current surface temperature.
http://www.ospo.noaa.gov/data/sst/contour/usatlant.fc.gif
The hurricane is near the Lesser Antilles.
http://www.ssd.noaa.gov/goes/east/tatl/ir4-animated.gif
As the magnetic activity of the sun increases, the jet stream retracts to the north.
http://squall.sfsu.edu/gif/jetstream_norhem_00.gif
Sorry.
Currently a geomagnetic storm is underway.
http://www.irf.se/Observatory/?link%5BMagnetometers%5D=Data
Comment On Cause(s)
“I did my Ph.D. dissertation on the structure and energetics of incipient tropical cyclones, and have published a method for monitoring their strength from satellites” – Roy Spencer
http://www.drroyspencer.com/2017/08/texas-major-hurricane-intensity-not-related-to-gulf-water-temperatures/
No way you you can say it was caused by what the warmists want to blame it on.
[…] Analysis By German Scientists Concerning Hurricane Causes: More Propaganda Than Science […]
Hurricane MARIA
As of 00:00 UTC Sep 18, 2017:
Location: 14.0°N 58.0°W
Maximum Winds: 75 kt Gusts: 90 kt
Minimum Central Pressure: 979 mb
Environmental Pressure: 1009 mb
http://www.ssd.noaa.gov/PS/TROP/floaters/15L/flash-vis-long.html
Maria hurricane hit the island of Dominica and Martinique in the Lesser Antilles archipelago.
Hurricane MARIA
As of 18:00 UTC Sep 18, 2017:
Location: 14.9°N 60.4°W
Maximum Winds: 110 kt Gusts: N/A
Minimum Central Pressure: 956 mb
Environmental Pressure: 1010 mb