Yesterday at Weatherbell Analytics at his Daily Update, meteorologist Joe Bastardi pointed out a topic that particularly fascinated me, and which I think is very important: the urban heat island effect (UHI).
Many have been claiming for years that the urban heating has been in part responsible for the higher recorded global surface temperatures over the past couple of decades. All that concrete, asphalt and steel covering the surface of urban sprawl absorbs enormous amounts of heat, and thus drives up the local temperature – especially at night.
And it happens to be that many of the surface measurement stations are situated in urban surroundings, like at airports, and thus have at least in part corrupted the temperature dataset. What follows is an image cropped from yesterday’s Weatherbell Daily Update.
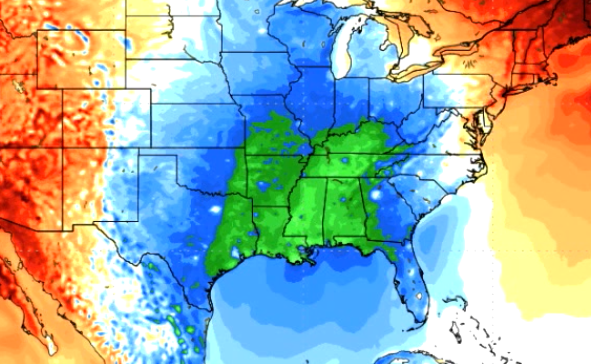
Urban heat islands are very real and now showing up in forecasts. Chart cropped from Weatherbell Analytics October 23 Daily Update.
Above Joe Bastardi shows the GFS 1-6 day forecast for temperatures across the United States and points out that “the models are so good now that they are picking up the urban heat island (UHI) effect” and building them into the forecasts. Above readers will note that the major metropolitan areas (right where the stations happen to be placed) are all warmer than the surrounding regions.
Dallas, Houston, Atlanta, Orlando, Chicago, New York City – among other places – are all showing higher temperatures, around 2°C warmer.
Naturally what is the case in the USA is also the case to a greater or lesser extent in other metropolitan areas worldwide. Climate authorities try to remove these corruptive effects through a process known as homogenization, i.e. adjustments, but that too has been considered to be highly controversial, the root of much distrust, and the subject of possible corruption. Modifying data is fudging, and fudging means you can make the data tell whatever story you want to hear.
Over the years NASA has “adjusted” the surface temperature dataset multiple times, each time dubiously making the past cooler and the present warmer. Tony Heller has been pounding away at this questionable practice for years.
So if the advanced forecasts are now showing the urban heat island effect, then that effect of course is later getting recorded by the surface weather stations and thus having a significant impact on the raw global climate data. Now you know where much of the “global warming” is coming from. It’s likely an artefact of a measurement system that is not optimally positioned and whose data is being dubiously processed.


Presumably it’s urban heat that has been causing lower troposphere and sea surface temperatures to rise over the past few years too.
In 2012 Gleckler et al showed that SST had risen about 0.125 C in 50 years, which they ascribed to human emitted greenhouse gases. The IPCC’s Ben Santer is a lead author of the study.
What is not mentioned in the study is what that means. Only a brief calculation is needed to work out the implied climate sensitivity it corresponds to:
2XCO2 = 0.125 x log 2 / (log 390 – log 315) = 0.4 C/doubling of pCO2
An ECS of 0.4 C would be entirely harmless.
UHI is also a factor at some rural stations. If I recall, Kenneth Hinkle et al. studied Barrow, AK, and found that depending on the winds, it’s station would read several degrees high relative to areas outside of the town. Given how polar temperatures were estimated, that could have “warmed” a significant area of the polar seas.
So glad to hear that UHI is being addressed. Surface Stations.org passes on some reasonable standards to adjust estimated temperatures to account for it.
Climate Reference Network Rating Guide – adopted from NCDC Climate Reference Network Handbook, 2002, specifications for siting (section 2.2.1) of NOAA’s new Climate Reference Network:
Class 1 (CRN1)- Flat and horizontal ground surrounded by a clear surface with a slope below 1/3 (<19deg). Grass/low vegetation ground cover 3 degrees.
Class 2 (CRN2) – Same as Class 1 with the following differences. Surrounding Vegetation 5deg.
Class 3 (CRN3) (error >=1C) – Same as Class 2, except no artificial heating sources within 10 meters.
Class 4 (CRN4) (error >= 2C) – Artificial heating sources = 5C) – Temperature sensor located next to/above an artificial heating source, such a building, roof top, parking lot, or concrete surface.”
http://www.surfacestations.org/
I’ve often wondered if the dramatic decline in the number of US stations over the last few decades was done to magnify the effect of UHI stations in the homogenization process. It doesn’t take much to create 0.04 degrees at 38% probability does it? Also, are they still using the 0.1 degree reduction to account for UHI?
Calling it the Urban Heat Island Effect is a misnomer since it operates at even very low population densities.
See this graph.
It’s apparent that a population density even as low as 65 per square kilometre is enough to cause 1 C of temperature increase.
The graph is from this study:
The Global Average Urban Heat Island Effect in 2000 Estimated from Station Temperatures and Population Density Data
Solid evidence of Mann-made warming.
UKMO adjusts up by 0.1°C I believe to allow for UHI
UHI is clearly visible in many situations for Amsterdam and Rotterdam in one the high resolution models from KNMI (Royal Netherlands Meteo Institute) or even Utrecht . KNMI is located in De Bilt, just east of this city .
This is just a weak example produced by HARMONIE a regional model, for tonight 7 PM. The other HR model that I know (HIRLAM) often shows it to a lesser extent.
UHI Amsterdam : https://pasteboard.co/GQxtt8q.jpg
Map source: Meteociel.fr
[…] Read more at No Tricks Zone […]