
Image Source: 22 December 2017 Newsweek
Christmas Day has arrived.
With the advent of this cheery holiday comes a somber warning from Newsweek, purveyor of climate doom.
“[A]s global temperatures rise due to climate change, snow on Christmas Day could increasingly become a rarity—even a distant memory.”
Contrary to Newsweek‘s claims, however, snow cover across the Northern Hemisphere (NH) has been increasing in recent decades.
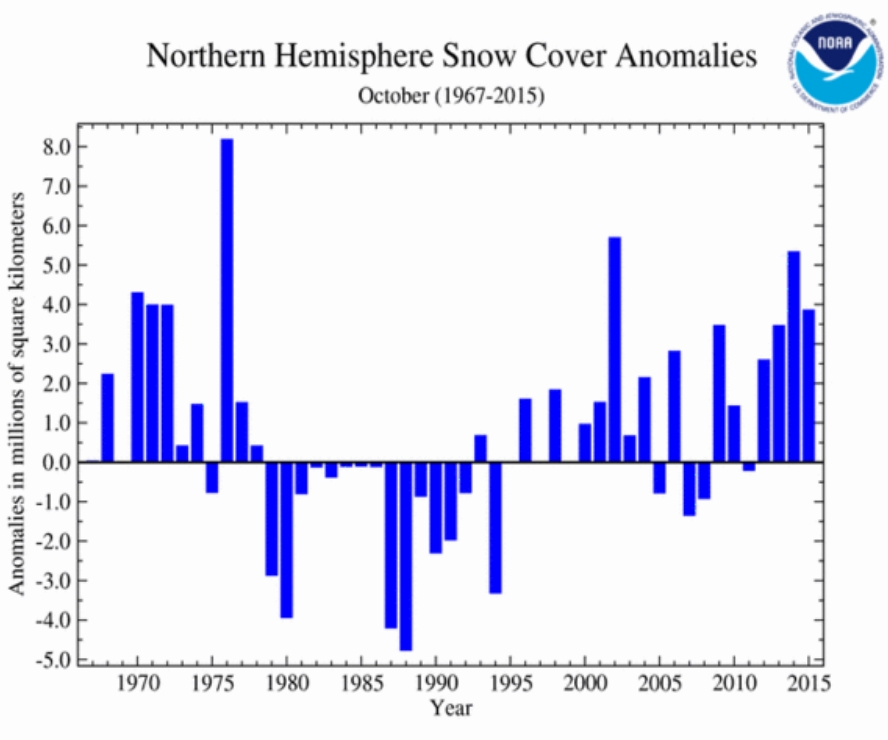
Image Source: NOAA
In the Southern Hemisphere, snow and ice have been expanding in the Antarctic region for centuries (Thomas et al., 2017), and Antarctica is projected to continue gaining ice mass in the decades to come (Lenaerts et al., 2016).
Apparently the journalists penning climate alarm scenarios that warn readers white Christmases are on the way out in the NH haven’t been keeping up with the latest scientific publications.
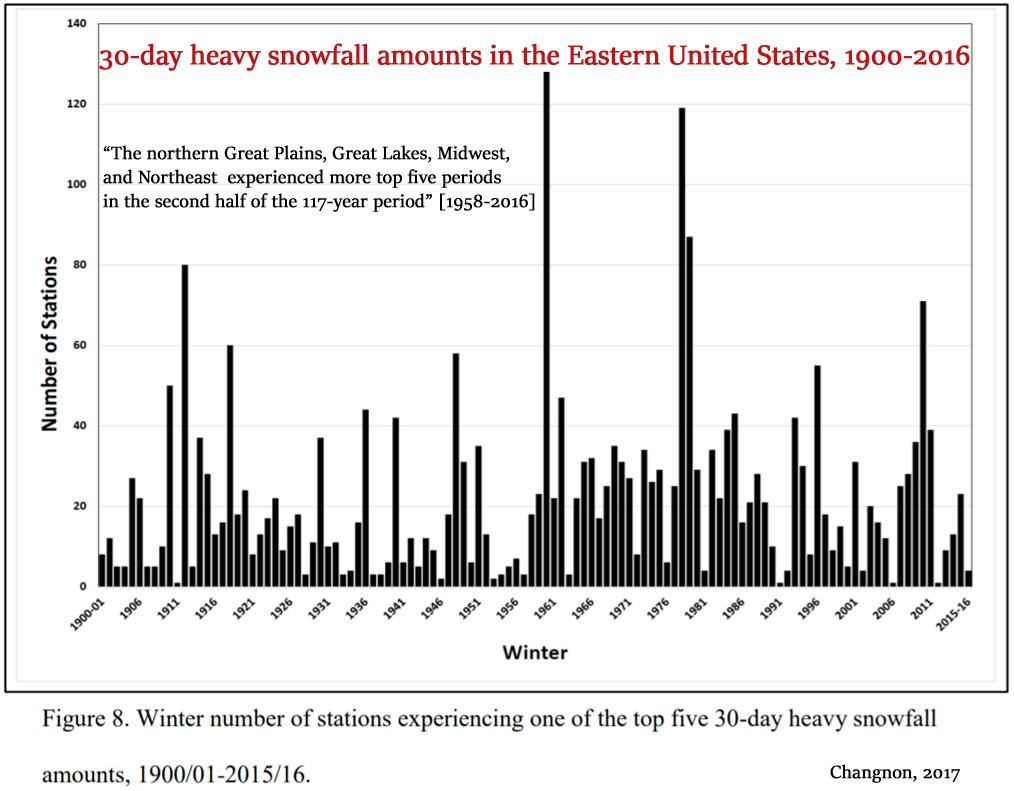
Heavy 30-day snowfall amounts were evaluated to identify spatial and temporal characteristics east of the Rockies in the United States during the period 1900-2016. An extensive data assessment identified 507 stations for use in this long-term climate study. The top 30-day heavy snowfall amount and the average of the top five 30-day heavy snowfall amounts were examined. … The northern Great Plains, Great Lakes, Midwest, and Northeast experienced more top five periods [more snow] in the second half of the 117-year period [1958-2016], where most of the southern states experienced top five periods throughout the study period. Examining extremes at periods beyond the daily event and less than the season contributes to our knowledge of climate and provides useful information to snow-sensitive sectors.
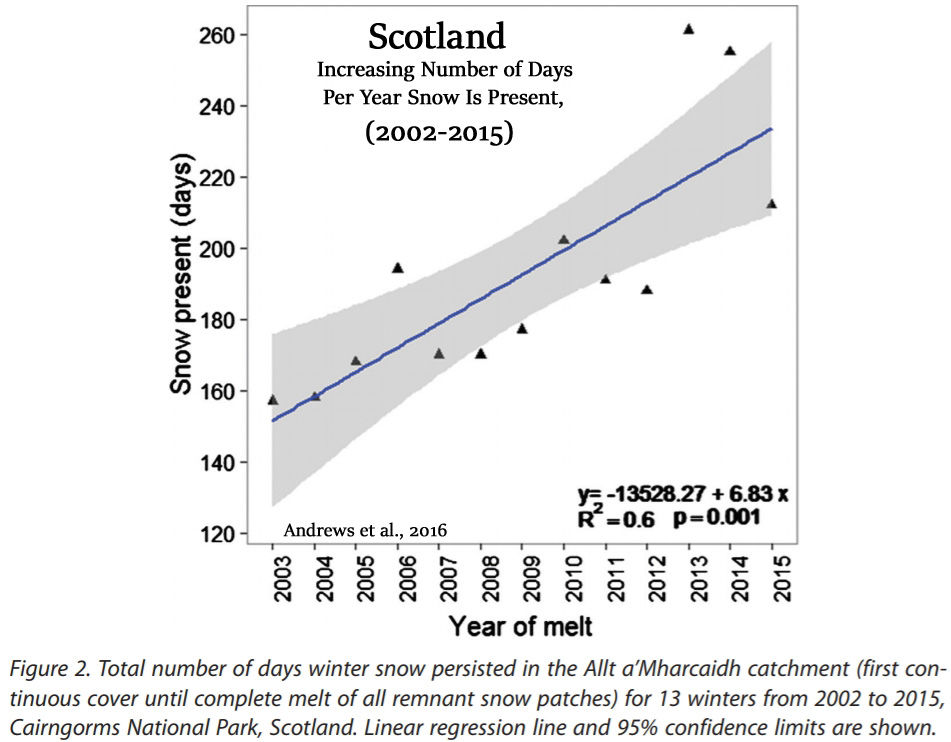
Long-term observations of increasing snow cover in the western Cairngorms [Scotland] … For 13 consecutive winters between 2002 and 2015, the date for the onset of continuous winter snow cover, and subsequent melt, was recorded on slopes of north and north-easterly aspect at altitudes between 450m and 1111m amsl. Results show that the period of time during which snow is continuously present in the catchment has increased significantly by 81 (±21.01) days over the 13-year period, and that this is largely driven by a significantly later melt date, rather than earlier onset of winter snow cover.
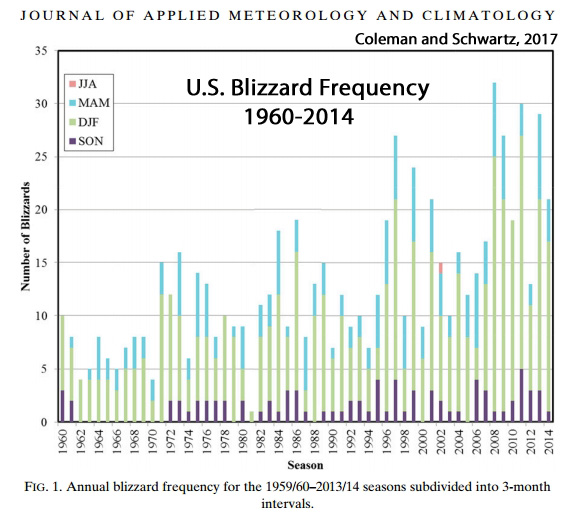
Data revealed 713 blizzards over the 55 years, with a mean of 13 events per season. Seasonal blizzard frequency ranged from one blizzard in 1980/81 to 32 blizzards in 2007/08. Federal disaster declarations resulting from blizzards totaled 57, with more than one-half of them occurring in the twenty-first century. Storm Data attributed 711 fatalities during the 55-yr study period, with an average of one individual per event; 2044 injuries were reported, with a mean of nearly three per blizzard. Property damage totaled approximately $9.11 billion in unadjusted dollars, with an approximate mean of $12.6 million per storm. Seasonal blizzard frequencies displayed a distinct upward trend, with a more substantial rise over the past two decades. … The modeled increase in blizzard activity showed a nearly fourfold upsurge between the start [1960] and end [2014]of the study period at 5.9 and 21.6 blizzards, respectively. On the basis of current model trends, the expected blizzard total for a season is 32 blizzards by 2050; uncertainty s on whether the linear trend will continue or stabilize in the near future.
No evidence of widespread decline of snow cover on the Tibetan Plateau over 2000–2015 … Our results show no widespread decline in snow cover over the past fifteen years and the trends of snow cover phenology over the TP has high spatial heterogeneity.
Ice Stable, Thickening, Growing In Recent Years
Ice rises are a useful resource to investigate evolution and past climate of the DML coastal region. We investigate Blåskimen Island ice rise, one of the larger isle-type ice rises at the calving front of the intersection of Fimbul and Jelbart Ice Shelves, using geophysical methods. … Using the Input-Output method for a range of parameters and column setups, we conclude that Blåskimen Island has been thickening over the past nine years [2005-2014]. Thickening rates cannot be determined precisely, but ensemble results show that thickening rate averaged over the ice rise varies between 0.07 m a−1 and 0.35 m a−1 [per year]. On longer timescales, we speculate that the summit of Blåskimen Island has been stable within several kilometers at least in the past ∼600 years but no longer than several millennia.
However, a recent analysis (Turner et al., 2016) has shown that the regionally stacked temperature record for the last three decades has shifted from a warming trend of 0.32 °C/decade during 1979–1997 to a cooling trend of − 0.47 °C/decade during 1999–2014. … This recent cooling has already impacted the cryosphere in the northern AP [Antarctic Peninsula], including slow-down of glacier recession, a shift to surface mass gains of the peripheral glacier and layer of permafrost in northern AP islands.
“Pamir–Karakoram–Western-Kunlun-Mountain (northwestern Tibetan Plateau) Glacier Anomaly” has been a topic of debate due to the balanced, or even slightly positive glacier mass budgets in the early 21st century. Here we focus on the evolution of glaciers on the western Kunlun Mountain and its comparison with those from other regions of the Tibetan Plateau. The possible driver for the glacier evolution is also discussed. Western Kunlun Mountain glaciers reduce in area by 0.12 % yr−1 from 1970s to 2007–2011. However, there is no significant area change after 1999. Averaged glacier thickness loss is 0.08 ± 0.09 m yr−1 from 1970s to 2000, which is in accordance with elevation change during the period 2003–2008 estimated by the ICESat laser altimetry measurements. These further confirm the anomaly of glaciers in this region. Slight glacier reduction over the northwestern Tibetan Plateau may result from more accumulation from increased precipitation in winter which to great extent protects it from mass reductions under climate warming during 1961–2000. Warming slowdown since 2000 happening at this region may further mitigate glacier mass reduction, especially for the early 21st century.
Our results indicated that the glacier area of MAKT [Muztag Ata and Kongur Tagh] decreased from 1018.3 ± 12.99 km2 in 1971/ 76 to 999.2 ± 31.22 km2 in 2014 (–1.9 ± 0.2%). Weak area shrinkage of glaciers by 2.5 ± 0.5 km2 (0.2 ± 0.1%) happened after 2000 and the period 2009–2014 even saw a slight expansion by 0.5 ± 0.1 km2 (0.1 ± 0.0%). The glaciers in this region have experienced an overall loss of –6.99 ± 0.80 km3 in ice volume or –0.15 ± 0.12 m water equivalent (w.e.) a–1 from 1971/76 to 2013/14. The mass budget of MAKT was –0.19 ± 0.19 m w.e. a−1 for the period ~1971/76–1999 and –0.14 ± 0.24 m w.e. a−1 during 1999–2013/2014. Similar to previous studies, there has been little mass change in the Pamir over recent decades despite such uncertainties. Glacier mass change showed spatial and temporal heterogeneity, with strong mass loss on debris-covered glaciers with an average of –0.32 ± 0.12 m w.e. a−1 from the 1970s to 2013/14.
This study investigated the surge dynamics of Aavatsmarkbreen, a glacier in Svalbard and its geomorphological impact based on remote sensing data and field observations. The main objective was to analyse and classify subglacial and supraglacial landforms in the context of glacial deformation and basal sliding over a thin layer of thawed, water-saturated deposits. The study also focused on the geomorphological evidence of surge-related sub- and supraglacial crevassing and glacier front fracturing. From 2006 to 2013, the average recession of Aavatsmarkbreen was 363 m (52 m a−1). A subsequent surge during 2013–2015 resulted in a substantial advance of the glacier front of over 1 km and an increase in its surface area of more than 2 km2.
Antarctica Ice Sheet Will Continue Gaining Mass
We present climate and surface mass balance (SMB) of the Antarctic ice sheet (AIS) as simulated by the global, coupled ocean–atmosphere–land Community Earth System Model (CESM) with a horizontal resolution of ∼1∘ in the past, present and future (1850–2100). CESM correctly simulates present-day Antarctic sea ice extent, large-scale atmospheric circulation and near-surface climate, but fails to simulate the recent expansion of Antarctic sea ice. The present-day Antarctic ice sheet SMB equals 2280±131 Gtyear−1, which concurs with existing independent estimates of AIS SMB. When forced by two CMIP5 climate change scenarios (high mitigation scenario RCP2.6 and high-emission scenario RCP8.5), CESM projects an increase of Antarctic ice sheet SMB [surface mass balance] of about +70 Gt year−1 per degree warming. This increase is driven by enhanced snowfall, which is partially counteracted by more surface melt and runoff along the ice sheet’s edges. This intensifying hydrological cycle is predominantly driven by atmospheric warming, which increases (1) the moisture-carrying capacity of the atmosphere, (2) oceanic source region evaporation, and (3) summer AIS cloud liquid water content.
Our results show that SMB [surface mass balance] for the total Antarctic Ice Sheet (including ice shelves) has increased at a rate of 7 ± 0.13 Gt decade−1 since 1800 AD representing a net reduction in sea level of ∼ 0.02 mm decade−1 since 1800 and ∼ 0.04 mm decade−1 since 1900 AD. The largest contribution is from the Antarctic Peninsula (∼ 75 %) where the annual average SMB during the most recent decade (2001–2010) is 123 ± 44 Gt yr−1 higher than the annual average during the first decade of the 19th century.
We suggest the Lambert-Amery [Antarctica] glacial system will remain stable, or gain ice mass and mitigate a portion of potential future sea level rise over the next 500 years, with a range of +3.6 to -117.5 mm GMSL-equivalent.


Newsweek just can’t get it right. Snow on Christmas Day has never happened in my lifetime. We haven’t had a White Christmas at all, ever. Mind you, if it did snow on Christmas Day, we would be in real strife.
You see, I live in the Southern Hemisphere. :-). It NEVER snows for Christmas.
Merry Christmas to all.
The Newsweek article Kenneth linked to is an interview and it doesn’t appear like you (or Kenneth) have actually read it.
Btw, full headline is “WHICH WHITE CHRISTMAS WILL BE OUR LAST? SNOW IN DECEMBER MAY SOON BE HISTORY—DEPENDING WHERE YOU LIVE”
Sebastian look at NOAA snow cover maps- historical.
You might learn something.
I’ve read it in full. According to NOAA, snow cover has been increasing in the Northern Hemisphere for decades (i.e., there has been more snow cover during 1995-2015 than during 1967-1995).
https://www.ncdc.noaa.gov/sotc/service/global/snowcover-nhland/201510.gif
Here, in an interview with a NOAA representative, the exact opposite is claimed: “[A]s global temperatures rise due to climate change, snow on Christmas Day could increasingly become a rarity—even a distant memory.”
So as someone who understands how these flagrant inconsistencies work, can you explain why it is that snow cover and ice thickness and SMB increases with warming, but yet also simultaneously decreases with warming? Is it kind of like how global warming causes global cooling, or is that a different physical process?
Yes. Was there something relevant you were trying to point out here? When will December snow disappear in the Northern Hemisphere, SebastianH, since snow cover has been increasing for decades? Where did the pattern of decreasing snow cover begin that allows projections of a disappearance of Christmas snow in the near (“soon”) future? Can you answer this headline question?
And why do you think it is that Antarctica has been gaining mass and reducing sea level rise since 1800 (Thomas et al., 2017)…if warming is supposed to do the opposite (according to those claiming Antarctica is melting)?
Why did the Greenland ice sheet gain mass (+40 Gt/yr) and reduce sea level rise during the 1961-1990 period (Fettweis et al., 2017), SebastianH, since CO2 emissions from humans tripled from 2 GtC/yr to 6 GtC/yr during that span? If CO2 emissions causes ice sheets to melt, why didn’t it work that way for those 30 years? What was the mechanism causing the GIS to expand? Do you know? Or will you respond to this question like you did the last time I asked about mechanisms of climate cooling and ice expansion…
SebastianH: “Who cares?”
But somehow your brain interpreted it in that special “skeptic” way …
I’ll answer with what the interviewee answered to that question:
“t’s not straightforward. A lot of people think about global warming happening consistently at the same pace, in the same way, all across the world. And that’s just not the way that it’s going to happen. There’s going to be changes in circulation patterns from warming oceans, and warming air is going to hold more moisture, so you’re going to see more snow in areas like Alaska.”
So did you really read that interview? I doubt it.
Somehow you are one of those who seem to think for global warming to be real it needs to warm everywhere. This is not how climate works and you of all people here should know it after “reading” so many papers.
You don’t like analogies and this one has little to do with the climate, but imagine a refrigerator. What happens when you increase the energy input, e.g. run the compressor more often? Your kitchen will warm, but one area will cool even more. Not unlike what’s happening with our climate.
Yes, “depending where you live”.
Whenever the topic is rising sea levels you emphasize the importance of the tide gauges over satellite measurements of the whole ocean volume since that is where people are located. What happened to that principle when the topic is snow cover? Suddenly the Northern Hemisphere is “everywhere equally”, no it’s “depending where you live”.
As the interviewee states (continuing the above citation): “But that’s going to take precipitation from other areas. If there’s more precipitation over in Alaska, there may be drier air due to the circulation pattern, say, in the Western United States. Climate change is not going to happen at the same rate. It’s not going to have the same impacts in the same places all across the world.”
It’s all about location.
You are probably referring to this paper, are you? https://www.clim-past.net/13/1491/2017/cp-13-1491-2017.pdf
I suggest re-reading that one too. From the author: “An increase in Antarctic SMB is expected in a warmer climate as a result of increased precipitation when atmospheric moisture content increases” and it is clearly stated that the paper is about the SMB, which is not the mass gain/loss of the ice sheet (you make this error all the time), e.g. the author comes to the conclusion that the SMB for the Antarctic Peninsula was 123 +-44 Gt / yr from 2001 to 2010. The GRACE data indicates that the mass loss of that part of the planet was -28.6 +-7.1 Gt / yr from 2002 up until now (see https://data1.geo.tu-dresden.de/ais_gmb/ … you can switch to English on the top right). Do you know what the difference between those two figures is?
Re-read that paper too and don’t just cherry pick some data and ignore everything else in a paper. Also, an SMB increase is not necessarily an ice sheet mass gain. I have not a lot of confidence that you wil recognize the difference any time soon.
As previously stated, it is all about location. CO2 is not causing ice to melt, higher temperatures are doing that. But higher temperatures also increase the humidity of the air and so more snowfall is possible … again, depending on location.
I think I learned more about climate science and the mechanisms involved in the one year since I discovered this blog, than you in whatever timespan you spent on misinterpreting papers to make a point. So the question should be “does Kenneth know?” or are you just searching for quotable sentences in papers that support your worldview and ignoring the rest?
“There’s going to be changes in circulation patterns from warming oceans, and warming air is going to hold more moisture, so you’re going to see more snow in areas like Alaska.”
SebastianH, according to NOAA’s own data, there has been more snow in recent decades for the entire Northern Hemisphere, not just in certain locations. In the Southern Hemisphere, there has been more snow in recent decades too, as Antarctica’s mass has been growing for centuries. In other words, the entire Newsweek article is inconsistent with observational evidence and snow data trends. That was the point of the NTZ article. Did you read it?
So you agree that modern warming is not globally synchronous? Your side claims that the MWP and LIA were regional events, but modern warming is global in its extent. You disagree, as you think modern warming is regional rather than global?
To be clear, then, you agree with the scientific evidence that the following regions of the globe have not warmed significantly, or are colder now than most of the last 10,000 years:
1. Greenland 2. Antarctica 3. North America 4. South America 5. Europe 6. Russia 7. North Atlantic 8. Equatorial Atlantic 9. Pacific Ocean 10. Southern Ocean 11. Indian Ocean 12. Australia/New Zealand 13. China 14. Asia
There are literally hundreds of papers that support the position that none of the above regions of the globe are warmer now than they were 1,000 years ago, or especially during the Holocene Thermal Maximum. So what, exactly, does the “global” in “global warming” mean in your version of reality…if you agree that only certain regions of the globe have warmed, and large regions of the globe have been cooling?
If you live in the Northern Hemisphere, there has been more snow, on average, since the 1950s than there was during the 1920s to 1940s. If you live in the Southern Hemisphere, it’s summer on December 25th. In the place where snow is possible (Antarctica), there has been more snow in recent decades. In other words, observed trends completely contradict what the Newsweek article claims. And yet, for some reason, you’ve chosen to defend it anyway. Why?
So, once again, you didn’t answer my question. At what location “where you live” in the NH (assuming you agree that people don’t live in Antarctica or see snow during summer in the SH) will snow be disappearing soon — which is what is claimed will happen in the Newsweek article? Please identify the NH location(s) where December snow will be “a distant memory”.
Great! So identify the location or locations where snow has (a) already shown a pattern of gradually disappearing and thus (b) will soon be disappearing in the near future. Be specific. Will the NE United States at some point cease increasing its snowcover (like has been observed since the 1980s)? Will Scotland soon experience the disappearance of snow? How about Siberia? Western Canada? Where? Identify the location, SebastianH.
So you claim it’s not the mass gain/loss of the ice sheet, and yet Thomas et al. (2017) have concluded that the increase in SMB since 1800 has led to a removal of water from sea levels. So if you don’t believe that an ice sheet mass loss leads to sea level rise, and an ice sheet mass gain leads to sea level removal, what do you believe Thomas et al. mean when they write:
“Our results show that SMB [surface mass balance] for the total Antarctic Ice Sheet (including ice shelves) has increased at a rate of 7 ± 0.13 Gt decade−1 since 1800 AD representing a net reduction in sea level of ∼ 0.02 mm decade−1 since 1800 and ∼ 0.04 mm decade−1 since 1900 AD.”
To what do you attribute the “net reduction in sea level” since 1800 from the Antarctic ice sheet if not the net mass gains?
Why did the Greenland ice sheet gain mass (+40 Gt/yr) and reduce sea level rise during the 1961-1990 period (Fettweis et al., 2017), SebastianH, since CO2 emissions from humans tripled from 2 GtC/yr to 6 GtC/yr during that span?
That’s not an answer to my question. Please identify the reason why the Greenland Ice Sheet gained 40 Gt a year from 1961-1990. What was the mechanism? Your dodging isn’t making your case look stronger, but thoroughly weakens it.
“Also, an SMB increase is not necessarily an ice sheet mass gain.”
Do you have any data at all that says otherwise.?
Or are you just yapping with zero evidence.. yet again?
“CO2 is not causing ice to melt, higher temperatures are doing that. “
That’s right, CO2 will never cause anything to melt, because it doesn’t affect temperature.
Yes, there has been some slight warming since the extreme cold of the Little Ice Age. (coldest period in 10,000 years)
Arctic sea ice has dropped back slightly from the extreme high of the LIA and late 1970s (coldest period in 80 years)
Thank goodness we are currently at the top of the natural warming/cooling cycle, hey seb. !!
Unfortunately, with the AMO turning, and solar energy dropping, that HIGHLY BENEFICIAL warm period is coming to a close…. 🙁
We will be wishing that CO2 actually did have some warming effect, but the radiative GHE hasnever been measured, it is not real, and only exists in climate models.
Those countries that have been FOOLISH enough to listen to the anti-CO2 propaganda, and ceased their coal fired electricity production, will likely find themselves with all sorts of energy supply issues.
And the reply vanished again … so either find it or leave it. But please learn what the difference between SMB and the ice sheet mass is, especially when talking about gains and losses.
Let me try to educate you, since this appears to be something you’re unfamiliar with.
With an increase in SMB, this means that the mass gains are greater than the mass losses. Even the title of this NASA paper spells this out:
NASA Study: Mass Gains of Antarctic Ice Sheet Greater than Losses
When the gains are greater than the losses, this leads to a net reduction in sea levels.
“The good news is that Antarctica is not currently contributing to sea level rise, but is taking 0.23 millimeters per year away,” Zwally said.
So when the Thomas et al. (2017) paper says that Antartica’s SMB has been positive overall since 1800, and that this positive SMB has been reducing sea levels during these 200+ years (curiously, just as human CO2 emissions have risen), this means that, as the NASA title suggests, the mass gains (net) have been greater than the mass losses.
Do you understand now? Here’s how SMB and sea level reduction work again:
Thomas et al., 2017
https://www.clim-past.net/13/1491/2017/cp-13-1491-2017.pdf
Our results show that SMB [surface mass balance] for the total Antarctic Ice Sheet (including ice shelves) has increased at a rate of 7 ± 0.13 Gt decade−1 since 1800 AD representing a net reduction in sea level of ∼ 0.02 mm decade−1 since 1800 and ∼ 0.04 mm decade−1 since 1900 AD. The largest contribution is from the Antarctic Peninsula (∼ 75 %) where the annual average SMB during the most recent decade (2001–2010) is 123 ± 44 Gt yr−1 higher than the annual average during the first decade of the 19th century.
There is a difference between measured gains an imaginary losses.
If you think the loses are greater than the gains over that last few year..
…PROVIDE EVIDENCE or stop yapping.!
“As previously stated, it is all about location.”
Yep, there has been NO WARMING anywhere that is not directly affected by ocean cycles and events.
and, as you well know, seb, even though your green sludge brain-washing will only allow you to DENY the facts……
…. there has been NO WARMING between the major El Nino events
No warming from 1980-1997
https://s19.postimg.org/iwoqwlg1f/UAH_before_El_nino.png
and no warming from 2001-2015
https://s19.postimg.org/b9yx58cxf/UAH_after_El_nino.png
“And the reply vanished again …”
Gees, even the software used here seems to have adapted an auto-flush for your comments, seb
Your BS is pretty easy to recognise, take the hint !!
“Let me try to educate you”
K, not even you can accomplish the impossible !!
You know what they say, “thick as a brick”
…. and there are many bricks in seb’s wall.
Irrelevant comparison to planetary climate. A refrigerator has a confined, insulated, and isolated space; the planet does not.
“The GRACE data indicates that the mass loss of that part of the planet “
GRACE data has been shown to be totally wrong for ice mass over volcanic regions, ie West Antarctic Peninsula and Greenland.
Also, the satellite itself was known to have major issues from its very launch. Most real scientists know this, but climate scientists are not real scientists.
Sorry you are too scientifically incompetent to understand how gravity sensing works, and what affects it.
Comment vanished? Please look it up in the spam bin, not posting that again …
” not posting that again …” – SebH
Promises, promises.
“not posting that again …”
so, no wasted space.. thanks 🙂
“I think I learned more about climate science and the mechanisms involved”
Its not showing… at all !!
Your comprehension is still that of a 5 year old.
So again we have seb picking a minor, totally irrelevant point, and yapping mindlessly, with zero purpose except attention-seeking
It’s called “humor,” SebH. It was a lead-in to his season greeting. It wasn’t anything requiring analysis or criticism. At most, a simple “and the same to you,” would have sufficed.
Yet again SebH shows how strong the cluelessness is with him.
I love it when the fools print this kind of stuff because of the Al Gore effect. Here in North Central Indiana we had our first White Christmas in a quite a few years. The hard freeze is on here so the snow, and anymore that is added to it, will be around well beyond the New Year. If the models are correct we will have a fair amount of snow accumulation between now and the first week of January. The highest temp forecast for the next week is -2 C with lows running -22 C to -10 C. That Global warming is doing quite a job.
Don’t you love some anecdotal evidence. On December 24th 2001 Germany saw record low temperatures around -27°C and on December 24th 2012 Germany saw record high temperatures around +18°C (Steve – comment below – could have seen a short wearing Santa walking around 5 years ago).
So much for global warming, +40 degrees in just 11 years. And today the thermometers will measure around +10°C, so it must be global cooling, right?
Nope, you are doing quite a job misunderstanding what global warming is and is not. But I think you know that 😉
Most people can see what the topic of the blog post is and respond to that as I did with my anecdotal evidence. But that’s just most people.
Why don’t you try it Seb. Dispute the point being made in the blog post with counter evidence. BTW I’m in for more of that “anecdotal evidence” before the year is out.
http://www.drroyspencer.com/2017/12/major-east-coast-snowstorm-for-new-years-eve/#comment-277667
Most people recognize when a reply is a reply to their comment …
Why do you need me to dispute the blog post when I am replying to your anecdotal evidence?
First off my reply was in response to the Blog posts subject, yours was not.
Secondly, I was speaking of the current weather in my state and country that was right in line with the subject of the blog post. But thanks for recognizing that “global warming” is not global and in fact skips all over and when it isn’t where someone is at during a particular time then that is just “anecdotal evidence”.
Oh, here is some more “anecdotal evidence” that the Continent I live on is friggin Cold right now and has considerably more snow than the global warming experts that wrote chapter 15 of the IPCC assessment report
https://wayback.archive.org/web/20130218204735/http://www.grida.no/publications/other/ipcc_tar/?src=/climate/ipcc_tar/wg2/569.htm
don’t have a clue what their talking about.
https://realclimatescience.com/wp-content/uploads/2017/12/2017_12_26_06_06_00.png
“you are doing quite a job misunderstanding what global warming is and is not”
Seb, you have NEVER understood what “global warming” is.
You are so ignorant that you still believe that CO2 has something to do with it, even though there is not one skerrick of measured proof.
And you refuse to understand even the most basic facts of the pressure temperature gradient and oceans/solar cycles.
It is very sad that you hold your base level IGNORANCE so tightly, refusing to see passed your brain-washed miasma.
Funny how alarmists skip all over the globe to what every event or area that is having weather they believe supports their argument while completely ignoring any place that does not agree with their projections.
But let a person point out the current weather in their area that supports the skeptics view and it’s just “anecdotal evidence”.
Here is some more of that “anecdotal evidence” for you Seb.
http://www.post-gazette.com/news/nation/2017/12/26/Christmas-brings-Northeast-blizzard/stories/201712260041
No “but”, you are doing exactly what you just found “funny” in the first paragraph of your reply. No climate scientist is picking local weather events and ignores what is going on elsewhere. That’s what skeptics do when they compile lists of “signs of global cooling” or in your case, the current temperatures outside your home/city.
“No climate scientist is picking local weather events “
Of course they do, all the time….
If its warm or extreme.. its ALWAYS global warming linked to CO2 according to so climate twerp.
Why do you continue to LIE about things that are so obvious.
It make you look even more DISHONEST with each such LIE.
Got 1 1/2″ of global warming last night.
Last year was among one of the ALL TIME coldest, snowiest winter on record.
Rutgers University monitors snow cover methodically. Their results show winter snow cover in the northern hemisphere increasing significantly.
https://climate.rutgers.edu/snowcover/chart_seasonal.php?ui_set=nhland&ui_season=1
Notice that Sebastian, ignored the Rutgers Snow Labs link you posted that destroys warmist/alarmist claims?
By the way it ended up 3 1/2″ of global warming snowfall at my city. The winter average is around 12″ total.
Thank you for thinking I am the all-seeing entity that can reply to every comment that will ever exist.
Can you explain why spring snow cover decreases?
https://climate.rutgers.edu/snowcover/chart_seasonal.php?ui_set=nhland&ui_season=2
Winter and fall snow extent INCREASING, in all regions.
Please explain, or seek attention elsewhere.
Wouldn’t you agree that having less snow during the spring would be TOTALLY BENEFICIAL for all plants, crops etc.
Add the extra CO2, and you get much more growth.
Notice how Sebastian completely ignores the WINTER snowfall and blizzard frequency increase, which is what the 2001,2007 IPCC reports specifically addresses?
No one here is disputing the decrease in spring snowfall, you need to stop trying to deflect from the WINTER snowfall discussion to create a bogus strawman argument attempt.
You are pathetic.
Headline in Canadian newspaper from 20,000 years ago…
“World Warming drastically, scientists say. Someday no one will know what mile high ice is like. And it’s all your fault! Unless cooking food stops, we’ll never be able to reverse the run away melting.”
When I see Santa getting around in board shorts at Xmas in the northern hemisphere, then I will think that maybe, just maybe the global warming fear mongering sheeple and morons are entitled to say ‘told you so’
Puget Sounds has a White Christmas
http://komonews.com/news/local/photos-white-christmas-in-western-washington
Apparently this has only happened 2 times before in 100years: 1926 & 2008
I was going to link to KOMO but I’m late.
However, the first time I saw this there were only about 15 photos.
They keep adding. Now up to 54.
I have visions of all those Newsweek readers, snowbound, looking out the window and wondering when history will sweep the sidewalk.
Some explanation perhaps …
it’s not the “Newsweek” we knew anymore …
Meet The Mysterious Duo Who Just Bought Newsweek (2013)
see this story – http://bit.ly/2BRldYC
(Forbes online edition – no adblock)
Weird links to Olivet_University and
its founder, the Korean “theologian”,
David Jang (Jae‐Hyung Jang), who has
odd ideas about the climate and etc.,
no doubt learned whilst he was an
acolyte of the Rev. Sun Myung Moon.
Story: http://nyti.ms/2C7j5v7
(New York Times 2013)
So anything we read in the current
incarnation of “Newsweek” must be
tainted by that heritage ?
Newsweek’s “heritage” has long been one of lies and deception. It goes back to long before they went under as a printed publication and long before they sat on the Clinton-Lewinski affair in 1998.
The latest example of Newsweek “News”.
http://www.breitbart.com/big-journalism/2017/12/25/newsweek-trump-nazis-stole-christmas/
Here’s one of my favorites Newsweek “news”: http://brainsandeggs.blogspot.de/2016/11/why-did-hillary-lose-to-trump-vol-iii.html
Let’s shoot the messenger again, shall we? Linking to Breitbart for anything should make everyone highly suspicious or “skeptical” if you will. Especially when it’s an article about defending Trump.
Happy Holidays!
Thanks Sebastian.
Every time I read one of your rants, it proves that the skeptic view is correct.
Seb thinks that Newsweek is a valid “messenger” but NOAA, Rutgers, and various scientific papers are not! Too funny!
My rants? So should I feel confirmed when AndyG55 or any other commenter writes a really infuriating reply to what I wrote?
The skeptic view is different from the deniers view. Being skeptical doesn’t mean criticizing one side and blindly believing anything the other side publishes. I have the feeling most of you call themselves skeptical just because it sounds better, in reality, you have a very strong opinion what should be and what can’t be real and stick to it no matter what. Right or wrong?
Still trying to ignore the official predictions published by the IPCC, Sebastian?
From the 2001 IPPCreport:
“15.2.4.1.2.4. Ice Storms
Milder winter temperatures will decrease heavy snowstorms but could cause an increase in freezing rain if average daily temperatures fluctuate about the freezing point. It is difficult to predict where ice storms will occur and identify vulnerable populations. The ice storm of January 1998 (see Section 15.3.2.6) left 45 people dead and nearly 5 million people without heat or electricity in Ontario, Quebec, and New York (CDC, 1998; Francis and Hengeveld, 1998; Kerry et al., 1999). The storm had a huge impact on medical services and human health. Doctors’ offices were forced to close, and a large number of surgeries were cancelled (Blair, 1998; Hamilton, 1998). One urban emergency department reported 327 injuries resulting from falls in a group of 257 patients (Smith et al., 1998b).”
https://wayback.archive.org/web/20130218204735/http://www.grida.no/publications/other/ipcc_tar/?src=/climate/ipcc_tar/wg2/569.htm
Reality:
https://realclimatescience.com/wp-content/uploads/2017/12/75471-1.jpg
Reality:
https://realclimatescience.com/wp-content/uploads/2017/12/75469-1.png
Reality:
https://realclimatescience.com/wp-content/uploads/2017/12/75470-1.jpg
As usual reality is a foreign concept for you, Sebastian.
♦ IPCC TAR (2001): “Milder winter temperatures will decrease heavy snowstorms“
♦ Kunkel et al., 2002: “Surface conditions favorable for heavy lake-effect snow decreased in frequency by 50% and 90% for the HadCM2 and CGCM1 [models], respectively, by the late 21st Century. This reduction was due almost entirely to … an increase in average winter air temperatures.”
♦ IPCC AR4 (2007): “Snow season length and snow depth are very likely to decrease in most of North America“
♦ Kapnick and Delworth, 2013: “In response to idealized radiative forcing changes, both models produce similar global-scale responses in which global-mean temperature and total precipitation increase while snowfall decreases. … By using a simple multivariate model, temperature is shown to drive these trends by decreasing snowfall almost everywhere”
And then the observations….
https://climate.rutgers.edu/snowcover/images/nhland_season1.png
Simply put, the IPCC climate models projecting a decrease in snow with warming are not supported by observations. So why does Newsweek publish articles like these…and why does SebastianH fail to understand that there is a lack of observational support for Newsweek’s claims such that he defends their conclusions anyway?
Sebastian, I was hoping you could tell me what your degree was in, as you clearly have been exposed to higher education.
My guess is that it is some aspect of Humanities, since you have that knack of focusing on obscurity, rather than seeing the big and blindingly obvious.
“exposed to higher education.”
But seb proved to be immune to anything remotely related to science.
Trump doesn’t need defending, he is doing a great job of bringing sanity and common sense back to the USA.
His slow destruction of the AGW global agenda is beautiful to watch. 🙂
And I am really glad that Breitbart gets under your skin, and you cannot face the facts and truth that is being written there.
“very strong opinion what should be and what can’t be real ”
No , we look at the science, THE FACTS.
You know, like the FACT that there is no measurable proof of CO2 warming our convectively controlled atmosphere.
You are the one holding FANTASY views based on ZERO science. You have been brain-washed so deeply that your mind has turned to green sludge, and you don’t even realise it.
It quite hilarious watching you avoid and twist and turn in your vain attempts to produce something, anything, to support your baseless AGW religion.
“when AndyG55 or any other commenter writes a really infuriating reply “
Sorry you find it so infuriating to have your constant errors, lies, mis-information and general lack of knowledge brought to notice.
You desperately PLEA for attention, then complain when you get it.
You poor sad, lonely child.
Seb
Yes, I have a strong opinion about it but it is based on being skeptical of the human caused climate change meme from the very beginning. Like anyone that has not recently fallen off the Turnip truck and values their freedom and liberties, I was skeptical the moment it became obvious to me that governments were pushing human caused climate change as a crisis that required them to gain more control or ownership of private sector assets to combat it.
sunsettommy, you can’t have it both, an increase in storms and a decrease in storms (or global ACE).
Why does Kenneth fail to understand that climate scientists aren’t saying that snow cover will decrease where it is cold? Why would snow cover be a thing of the past in regions where temperatures regularly drop to -10°C from a global average increase of 2 or more degrees? If anything the increased humidity will increase snow in some of those regions.
Maybe it becomes clearer what I mean when you take a look at the spring season: https://climate.rutgers.edu/snowcover/images/nhland_season2.png
Computer science.
I am literally laughing out loud right now. You are a strange person with very strange views and I hope nobody will ever let you decide anything important.
So where on Earth, specifically, is snow cover going to decrease? Be very specific as to the geographical location(s) where December snow will soon become a distant memory, as Newsweek puts it (and you agree). I ask because, as climate scientists have written, snow cover is supposed to decrease “almost everywhere”. So where is the exception? What locations?
Kapnick and Delworth, 2013: “In response to idealized radiative forcing changes, both models produce similar global-scale responses in which global-mean temperature and total precipitation increase while snowfall decreases. … By using a simple multivariate model, temperature is shown to drive these trends by decreasing snowfall almost everywhere”
“I hope nobody will ever let you decide anything important”
You have a truly weird sense of your own worth and knowledge… totally empty and unsubstantiated.
You can try and yap your way out of what has been clearly said by climate scientists, but it is only mindless denial of the plain facts.
“I am literally laughing out loud right now.”
You mean “giggling inanely” as you preen yourself in the mirror, right?
Your attention seeking trolling is a joke, seb.
I’d like to think you could do better, but you just keep sliding backwards.
” supposed to decrease “almost everywhere”. So where is the exception? What locations? “
I’m sure you have asked that before, Kenneth
Surely seb isn’t squirming around doing everything he can to avoid answering…. ! 😉
Yes, I’ve asked 3 times now, and he keeps on dodging. I’ve also asked him what the mechanism was that caused the Greenland Ice Sheet to gain mass and remove sea water from the oceans during the 30 years between 1961-1990. I’ve also asked him to identify what caused the abrupt warming of +0.8 C in the NH between 1880 and 1940, and the cooling of -0.5 C between 1940 and 1970, but he won’t answer that either. He keeps on dodging the mechanism questions. He also won’t answer why (mechanism) Arctic sea ice was so much higher than now during the LIA and so much lower than now during the MWP and RWP…when CO2 levels were in the 270s ppm for each period:
https://notrickszone.com/wp-content/uploads/2017/11/Arctic-Sea-Ice-Extent-North-of-Iceland-3000-Years-Moffa-S%C3%A1nchez-and-Hall-2017.jpg
Poor seb obviously hasn’t been able to find anything on his “fact check” sites. 😉
He has been almost totally DEVOID of meaningful science for quite a long time, poor trollette.
Icelandic sea index shows the late 1970s up there with the extreme extent of the LIA.
https://s19.postimg.org/bkgbf2prn/Icelandic_sea_ice_index_2.png
Must have made hunting pretty hard for the PBs.
Pity the recovery from those extremes, down towards more normal extents of the MWP and prior, seems to have stopped.
“Computer science.”
Been obvious for ages that there is very little actual hard science, physics, maths etc in your semi-education.
You live in a land of pseudo-facts.
Do you write Fantasy computer games?
Or mindless yaps for twitter type comments.?
Sebastian reckons he studied Computer Science.
But probably failed the logical processing part.
Mind you, he could still get a job writing code for climate modelling😁
Now Sebastian is a very confused man, since he thinks I am talking about Tropical/Hurricane storms, since he writes this in reply to my Snow comment:
“sunsettommy, you can’t have it both, an increase in storms and a decrease in storms (or global ACE).”
This is what I was talking about, that he in a daze replied to:
“15.2.4.1.2.4. Ice Storms
Milder winter temperatures will decrease heavy snowstorms but could cause an increase in freezing rain if average daily temperatures fluctuate about the freezing point. It is difficult to predict where ice storms will occur and identify vulnerable populations. The ice storm of January 1998 (see Section 15.3.2.6) left 45 people dead and nearly 5 million people without heat or electricity in Ontario, Quebec, and New York (CDC, 1998; Francis and Hengeveld, 1998; Kerry et al., 1999). The storm had a huge impact on medical services and human health. Doctors’ offices were forced to close, and a large number of surgeries were cancelled (Blair, 1998; Hamilton, 1998). One urban emergency department reported 327 injuries resulting from falls in a group of 257 patients (Smith et al., 1998b).”
https://wayback.archive.org/web/20130218204735/http://www.grida.no/publications/other/ipcc_tar/?src=/climate/ipcc_tar/wg2/569.htm
As you SHOULD be able to see that there are ZERO reference to ACE index and non winter storms, it was all about WINTER events only, along with three links showing increased snow and blizzard events in recent decades.
Then Sebastian tries his misleading misdirection, since the subject was WINTER snow events, not spring that you bring up.
“Maybe it becomes clearer what I mean when you take a look at the spring season:
https://climate.rutgers.edu/snowcover/images/nhland”
Again quoting the IPCC, you keep ignoring:
“15.2.4.1.2.4. Ice Storms
Milder winter temperatures will decrease heavy snowstorms but could cause an increase in freezing rain if average daily temperatures fluctuate about the freezing point. It is difficult to predict where ice storms will occur and identify vulnerable populations…..”
WINTER is the time of discussion, which the IPCC says would DECREASE in both the 2001 and 2007 reports you keep ignoring. They are clearly WRONG as the data make clear, which you were shown several times.
Your so called rebuttal was out of season and dead on arrival.
Don’t you get tired of being dishonest and clueless?
“he could still get a job writing code for climate modelling”
CHIMP5. 🙂
Please check the Spam bin, my long reply to Sebastian is still not approved.
You approved two later comments I made.
I stopped reading Nuisance Week and Slime Magazine many decades ago. The only reason I read them was to learn about things I didn’t yet know, but whenever they had an article about something with which I was already familiar, it virtually always made significant errors. I realized that was probably also the case with articles about the subjects I was as yet unfamiliar. And back the it wasn’t activism that was responsible, just incompetence. But today they are both incompetent and blatantly dishonest. How they are still in business is a real mystery.
The reason to read Newsweek is the same as the reason to read various other publications of the left. To learn where they are coming from and what the “talking points” of the democrats will be. Or one can just watch CNN and MSNBC because the democrats feed their talking points to those “news” outlets who broadcast them with out challenge and promote them.
I used to read National Review online frequently. Now I scan it only to see what the talking points of the Republican establishment portion of the DC swamp will be.
I’m sure there is the same kind of situation in Germany. One knows which publications or other “news” outlets to check out to learn what a particular political segment is up to.
OT, just posted at WUWT,
Apparently China’s efforts to use gas, include coal to gas processes.. all the more CO2 for the world’s plant life! 🙂
https://wattsupwiththat.com/2017/12/26/chinas-great-climate-joke-switching-to-gas-made-from-coal/
They even mispelled “weak” in their name. (sarc)
This book was authored in 1891 by a guy who looks to have written about 30 books on the history of the New England region. This link is to one he wrote concerning weather events going back to the 1630s in N.E. You can download for free on Google Books and use for a perspective check on both extreme weather events, but also, peoples’ attitudes about the events they experienced and more generally, about the climate they lived in. It seems NOT much has changed in the last 380 (or so) odd years.
https://books.google.com/books/about/Historic_Storms_of_New_England.html?id=twkAAAAAMAAJ
One aspect of climate/weather in US history is that the American Revolution was fought during the LIA. Why does this matter?
In the US military we called bad weather “Ranger weather”.
It was “Ranger weather” that helped George Washington pull off his surprise attack against the Hessians at Trenton Dec. 26, 1777 there by saving the revolution.
http://www.history.com/this-day-in-history/washington-leads-troops-on-raid-at-trenton-new-jersey
It was the cold winters with heavy snow fall that allowed Frank Knox, Washington’s Chief of Artillery, to transport 55 heavy cannon on sledges the 300 miles across rough country, lakes, and Rivers, from Ft. Ticonderoga to Dorchester Heights overlooking Boston and it’s Harbor to drive the British out of what was then their most important base in New England.
https://www.gilderlehrman.org/content/dragging-cannon-fort-ticonderoga-boston-1775
For you, Sebastian.
Photos: Record-breaking snowfall blankets Erie, Pennsylvania, with over 60 inches of snow
By Ashley Williams, AccuWeather staff writer
December 27, 2017, 10:56:27 AM EST
Excerpt:
“Snowfall totals broke records in Erie, Pennsylvania, as snow covered much of the northeastern United States on Christmas.
From 7 p.m. on Dec. 24 to 7 p.m. Dec. 26, Erie had received 60.5 inches of snow, which shattered numerous records for the city. Nearly all of this snow fell on Monday and Tuesday.
“This is now the biggest two-day snow total on record for Pennsylvania, besting the old record of 44 inches, which was set in Morgantown from March 20-21, 1958,” AccuWeather Meteorologist Bill Deger said.”
https://www.accuweather.com/en/weather-news/photos-record-breaking-snowfall-blankets-erie-pennsylvania-in-53-inches-of-snow/70003657
Record cold and Snowfall in areas of Eastern America and Canada.
Snicker……….
The roll call of unusually cold and snowy winter events are long at this website:
https://www.iceagenow.info/
The IPCC, Warmist/alarmists and plain ignorant leftists are very wrong.
Gosh, Sebastian runs away after I post real evidence on why he was wrong, several times.
You have no argument left, here at all?