Even though CO2 concentrations hovered well below 300 ppm throughout most of the Holocene, newly published paleoclimate reconstructions affirm that today’s surface temperatures are only slightly warmer (if at all) than the coldest periods of the last 10,000 years. This contradicts the perspective that temperatures rise in concert with CO2 concentrations.

Bottom Graph Source: Rosenthal et al. (2013)
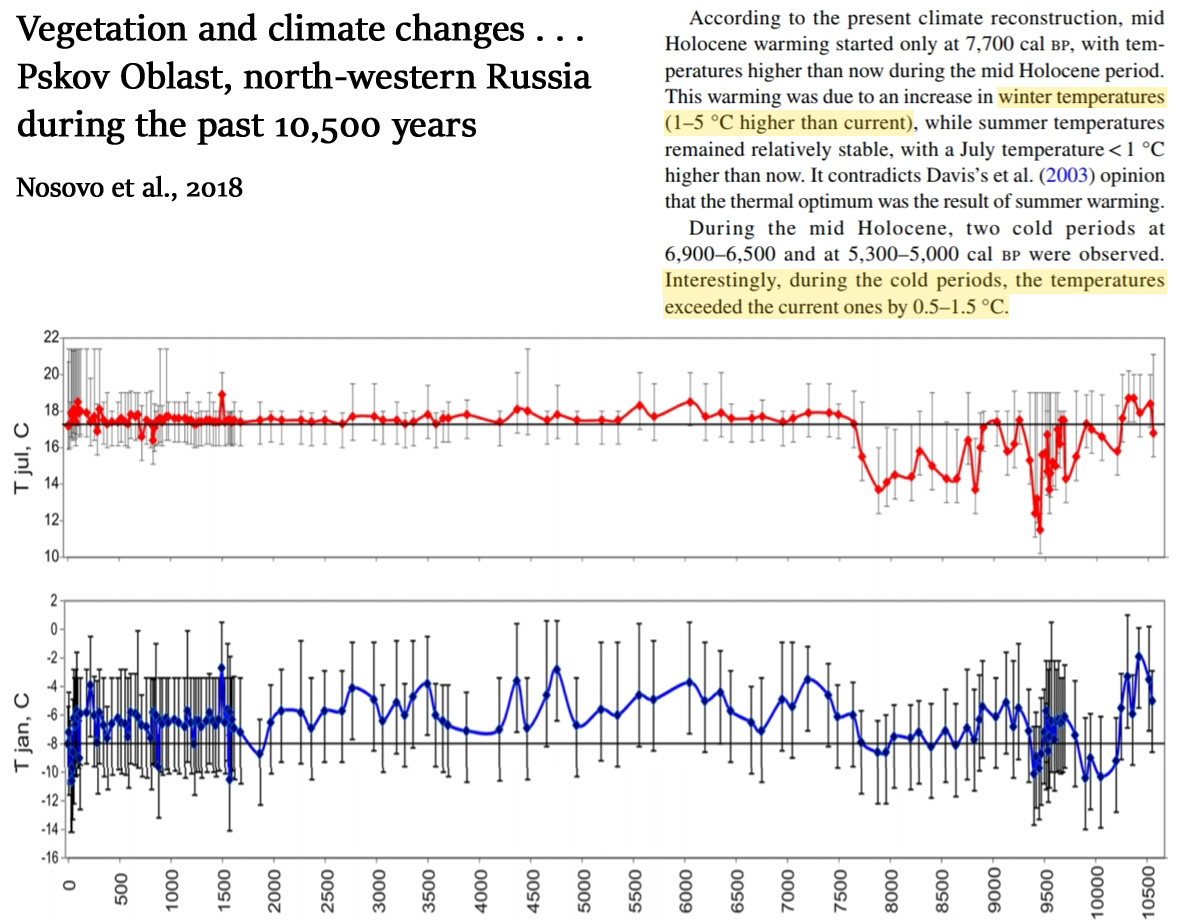
1. Even Past Cold Periods Were 0.5–1.5 °С Warmer Than Today
“According to the present climate reconstruction, mid Holocene warming started only at 7,700 cal bp, with temperatures higher than now during the mid Holocene period. This warming was due to an increase in winter temperatures (1–5 °С higher than current), while summer temperatures remained relatively stable, with a July temperature<1 °С higher than now. … During the mid Holocene, two cold periods at 6,900–6,500 and at 5,300–5,000 cal bp were observed. Interestingly, during the cold periods, the temperatures exceeded the current ones by 0.5–1.5 °С.”
“The transition from the mid Holocene thermal maximum to the following period occurred without considerable climatic changes. The mean annual temperatures remained much higher than the current ones by 0.5–2.5 °С until 2,500 cal bp. Local maximum temperatures were observed at 4,800, 4,300, 3,500 and 2,900–2,700 cal bp. The present climatic reconstruction demonstrates a gradual cooling down to current levels at ca. 2,500 cal bp, and then followed by a new warming phase with up to 1–2 °С increase at approximately 1,500 cal bp.”
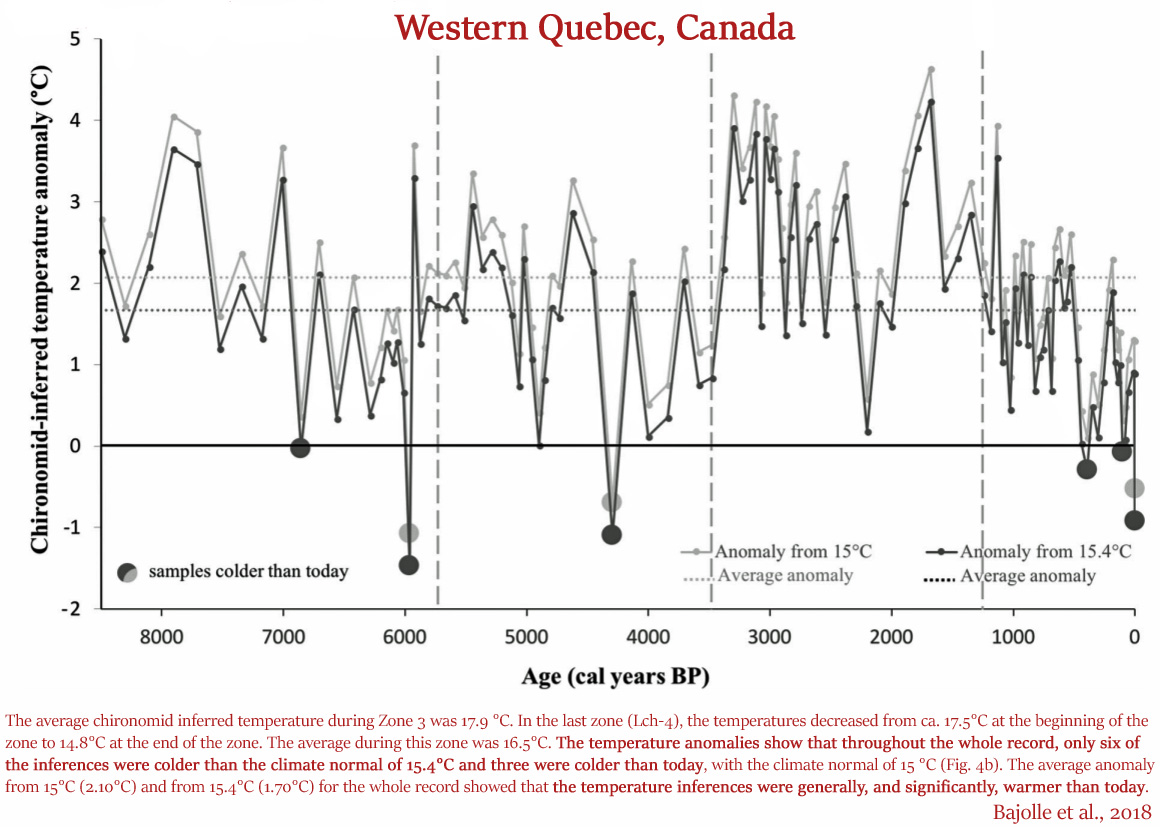
2. Only 3 Of 116 Holocene Temperature Anomaly Records Were Colder Than Today
“The mean annual temperature recorded at the closest meteorological station [La Sarre: 1961–1990] is 0.8 °C, with August temperature averages of 15.0 °C (1961–1990) and 15.4 °C (1981–2010). … During zone Lch1 (8500–5800 cal year BP), the average reconstructed temperature was 16.9 °C, with a decrease from 19 °C (maximum) to 17 °C at the end of the zone. In zone Lch-2 (ca. 5700–3500 cal year BP), temperatures had an average of 16.8 °C, with a decrease from 17.8 °C around 5200 cal year BP to 16.2 °C at 3400 cal year BP. Zone Lch-3 (ca. 3500–1200 cal year BP) started with inferences for high temperatures (19.3–18.5 °C), followed by a decrease to 16.8 °C between ca. 3000 and 2500 cal year BP. An increase (18.3 and 19.6 °C) was inferred for the period between 1800 and 1500 cal year BP. The average chironomid inferred temperature during Zone 3 was 17.9 °C. In the last zone (Lch-4), the temperatures decreased from ca. 17.5 °C at the beginning of the zone to 14.8 °C at the end of the zone. The average during this zone was 16.5 °C. The temperature anomalies show that throughout the whole record, only six of the inferences were colder than the climate normal of 15.4 °C and three were colder than today, with the climate normal of 15 °C (Fig. 4b). The average anomaly from 15 °C (2.10 °C) and from 15.4 °C (1.70 °C) for the whole record showed that the temperature inferences were generally, and significantly, warmer than today.”
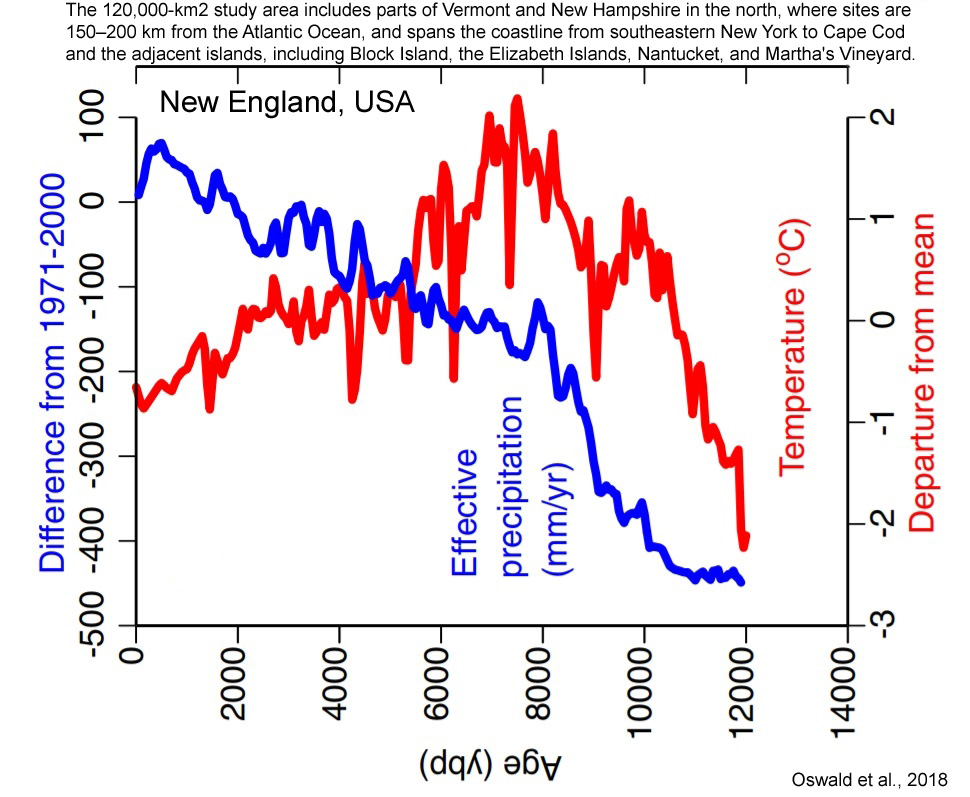
3. New England (USA) Colder Now Than Nearly All Of The Last 11,000 Years
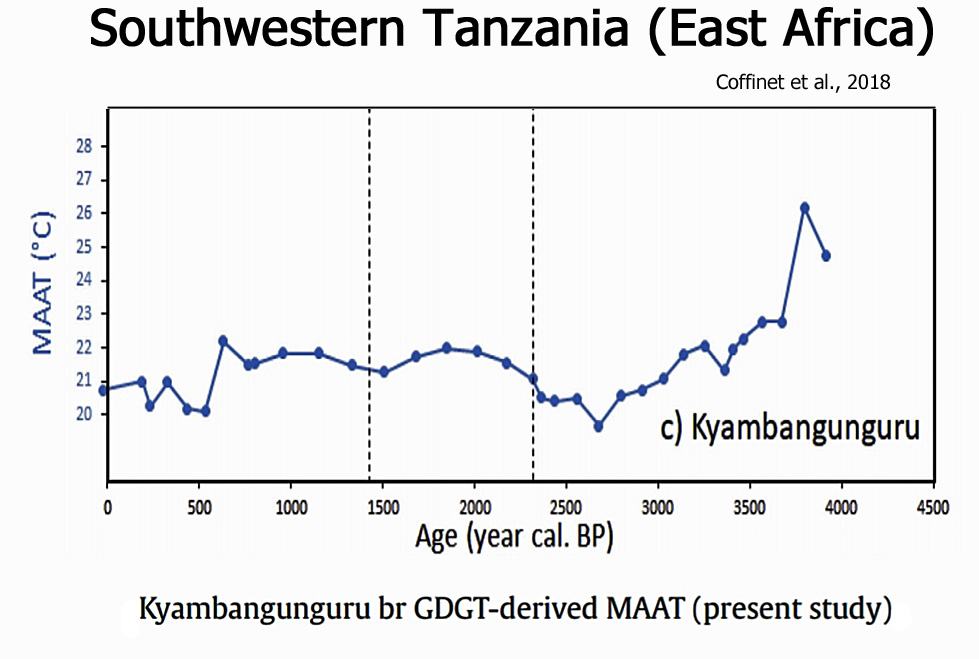
4. Today’s Temperatures Still Just As Cold As The Global Little Ice Age
“This study represents the first detailed late Holocene quantitative air temperature reconstruction from the RVP [Rungwe Volcanic Province, southwestern Tanzania/East Africa] region. We identified a succession of cold/warm/cold events, largely in phase with the other regional East African climate records and with the cold periods identified worldwide by Wanner et al. (2011). This further supports that global scale processes may be the main drivers of the Holocene climatic variability. Moreover, warm conditions during the MCA [Medieval Climate Anomaly] followed by abrupt cooling during the LIA were observed at Kyambangunguru and elsewhere in East Africa suggesting that these two recent events occurred globally.”
5. Modern Temperatures -2.9°C Colder Than 7,000 Years Ago
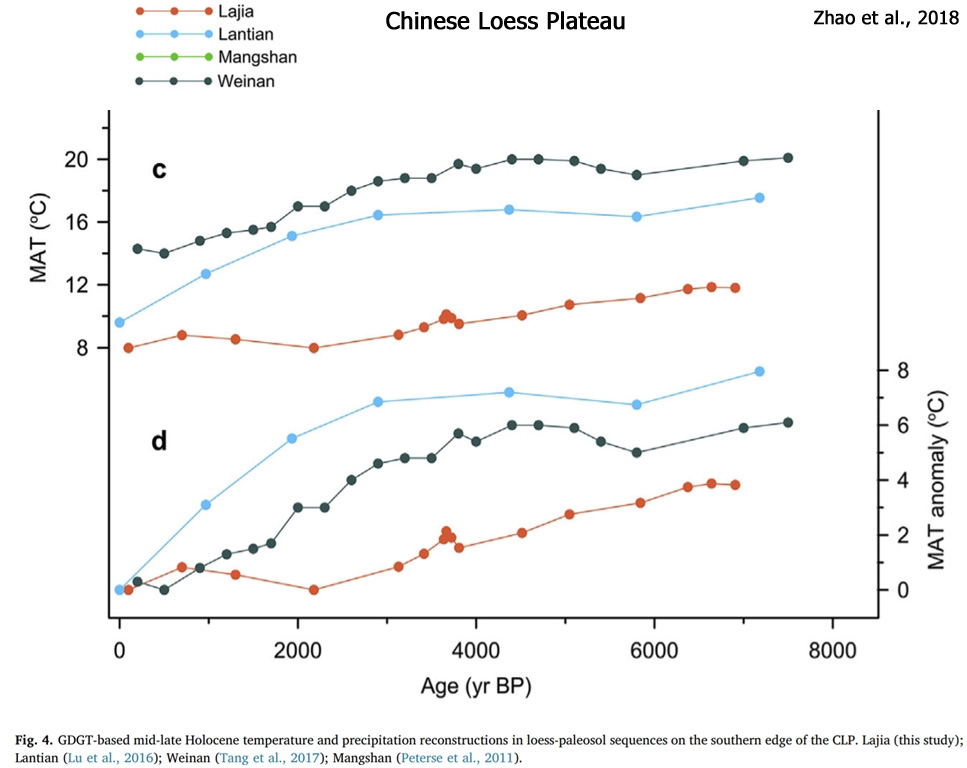
“According to the interpolation of meteorological data of the two nearest weather stations at Linxia (ca. 46 km away; MAT [mean annual temperature] = 7.3 °C) and Minhe (ca. 54 km away; MAT [mean annual temperature] = 8.3 °C)… In this study, we reconstructed mid-late Holocene climatic changes using GDGT distributions in a loess-paleosol sequence in the Lajia Ruins of the Neolithic Qijia Culture, Guanting Basin, in the southwestern end of the Chinese Loess Plateau. … MAT [mean annual temperature] decreased from 11.9 °C to 8.0 °C [today], during the past ca. 7000 yr, and a drastic decline in MAP [mean annual precipitation] (70 mm), accompanied by a 0.8 °C decline in MAT [mean annual temperature], occurred at 3800–3400 yr BP.”
6. Temperatures “7–9°C Higher Than Modern during The Early Holocene”
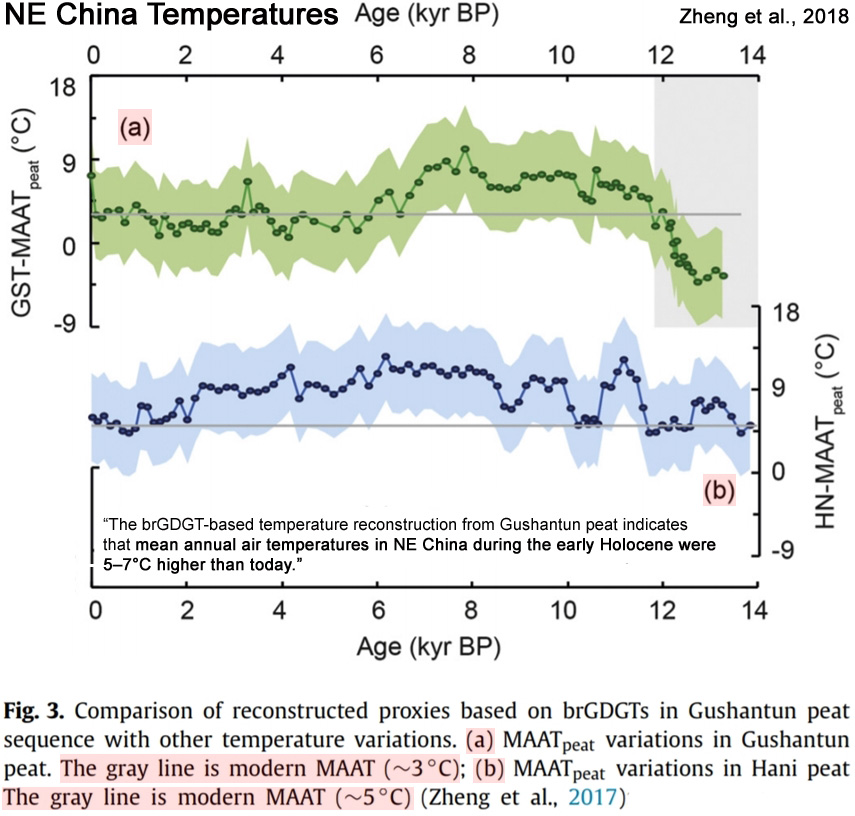
“In this study we present a detailed GDGT data set covering the last 13,000 years from a peat sequence in the Changbai Mountain in NE China. The brGDGT-based temperature reconstruction from Gushantun peat indicates that mean annual air temperatures in NE China during the early Holocene were 5–7°C higher than today. Furthermore, MAAT records from the Chinese Loess Plateau also suggested temperature maxima 7–9°C higher than modern during the early Holocene (Peterse et al., 2014; Gao et al., 2012; Jia et al., 2013). Consequently, we consider the temperatures obtained using the global peat calibration to be representative of climate in (NE) China. … The highest temperatures occurred between ca. 8 and 6.8 kyr BP, with occasional annual mean temperatures >8.0 ± 4.7°C, compared to the modern-day MAAT of ∼3°C.”
7. 1950-2015 Just 0.7°C Warmer Than Coldest Temps Of The Last 9,000 Years
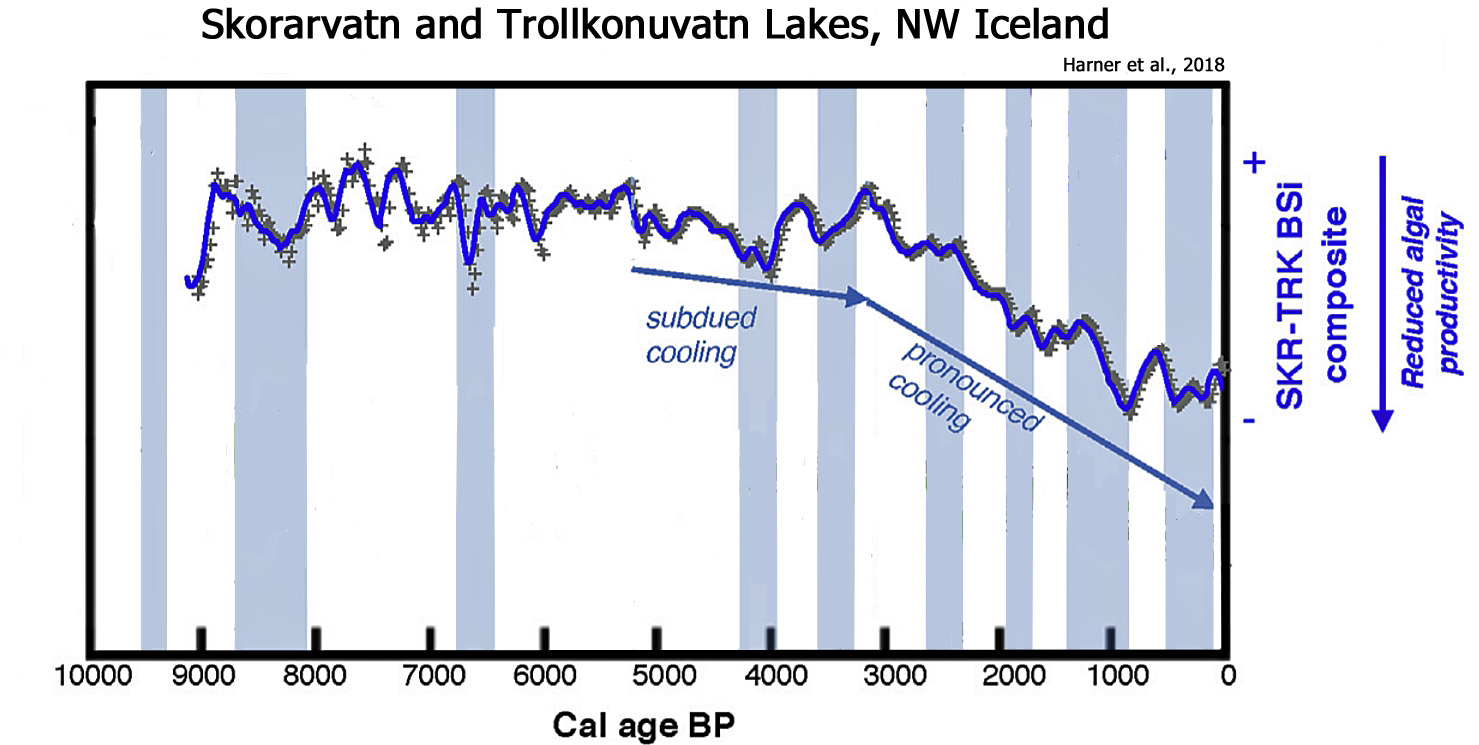
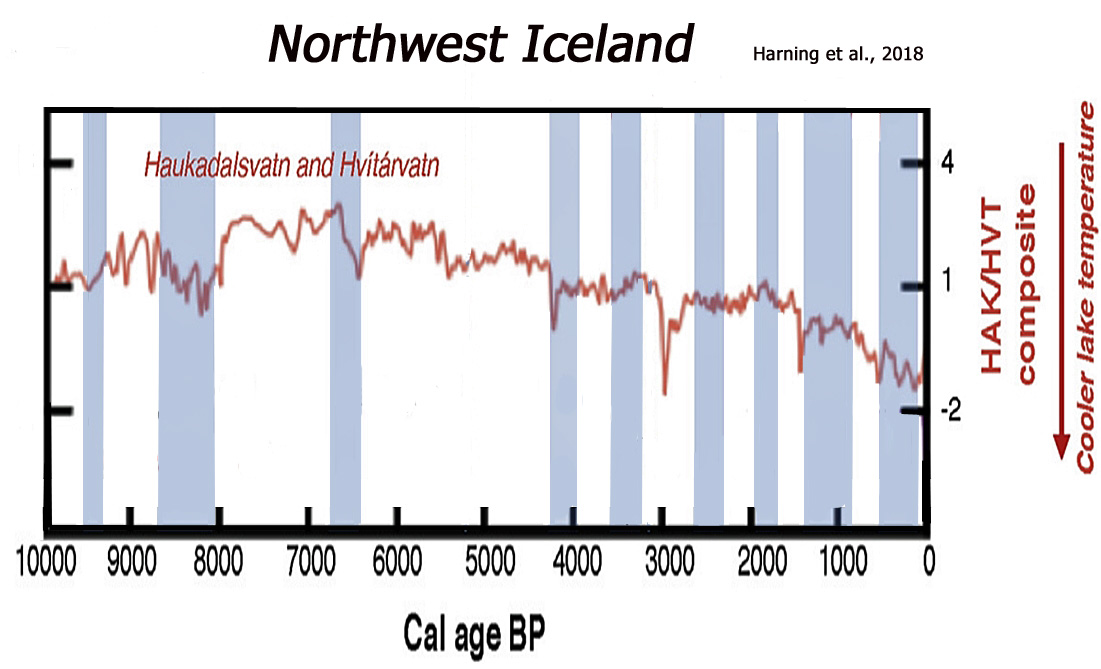
“Iceland’s terrestrial HTM [Holocene Thermal Maximum] has previously been constrained to ~7.9 to 5.5 ka based on qualitative lake sediment proxies (Larsen et al., 2012; Geirsdottir et al., 2013), likely in association with progressive strengthening and warming of the Irminger Current (Castaneda et al., 2004; Smith et al., 2005; Olafsdottir et al., 2010). Numerical modeling experiments for Drangajokull suggest that peak air temperatures were 2.5 – 3°C warmer at this time relative to the 1961-1990 CE average (Anderson et al., 2018). … During the Little Ice Age (LIA, 1250-1850 CE), the Vestfirðir region entered the lowest multi centennial spring/summer temperature anomalies of the last 9 ka. Based on recent numerical modeling simulations, this anomaly is estimated to be 0.6-0.8°C below the 1950-2015 average on Vestfirðir (Anderson et al., 2018).”
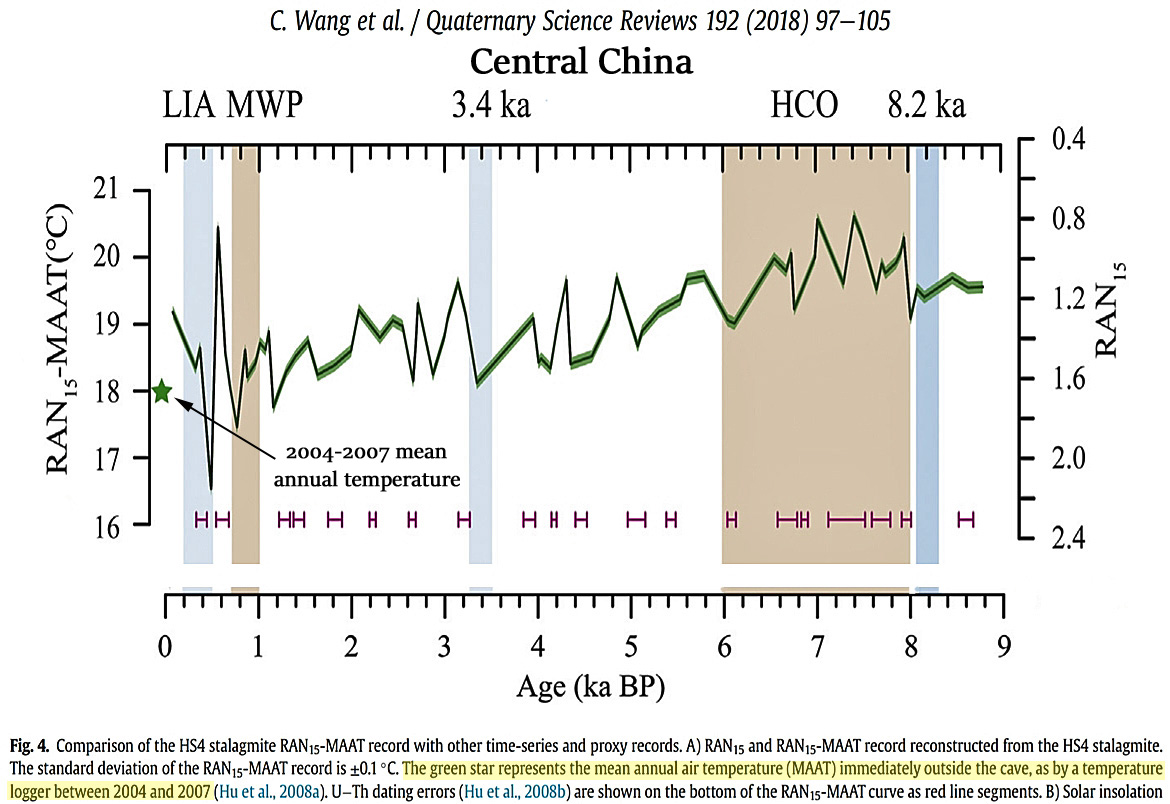
8. 2004-2007 Temps Colder Than All But 3 Other Holocene Periods
“The average RAN15-MAAT of 18.4°C over the most recent part of the record (<0.8 ka BP) [the last 800 years BP] overlaps with the range of MAATs, ca. 16.2°C to 18.7°C (av. 17.5°C) measured since 1952 at the nearest meteorological station (Yichang, located ca. 100 km away) and is very close to the av. MAAT of 18°C measured directly outside the cave by a temperature logger between 2004 and 2007 (Hu et al., 2008a). This agreement between reconstructed temperatures and instrumental measurements increases our confidence in the potential of the RAN15 proxy. RAN15-MAATs in HS4 vary from 16.5°C to 20.6°C (av. 19°C), during the last 9 ka BP, and broadly follow a long-term trend of declining temperatures in line with declining solar insolation at 30°N in July (Laskar et al., 2004). … Interestingly, the most recent 0.9 ka BP [900 years BP] is distinguished by greater variability with the highest (20.5°C) and lowest (16.5°C) RAN15-MAATs occurring consecutively at 0.6 ka BP [600 years BP] and 0.5 ka BP [500 years BP].” [Surface temperatures dropped by -4.0°C within ~100 years.]
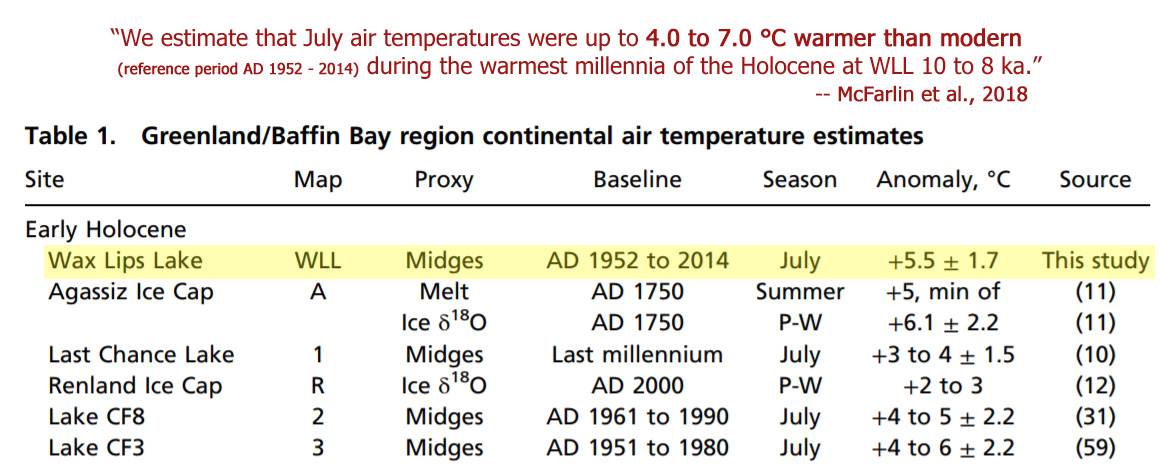
9. 1952-2014 Temps 4.0 to 7.0 °C Colder Than 8,000 – 10,000 Years Ago
“(Greenland) Early Holocene peak warmth has been quantified at only a few sites, and terrestrial sedimentary records of prior interglacials are exceptionally rare due to glacial erosion during the last glacial period. Here, we discuss findings from a lacustrine archive that records both the Holocene and the Last Interglacial (LIG) from Greenland, allowing for direct comparison between two interglacials. Sedimentary chironomid assemblages indicate peak July temperatures [Greenland] 4.0 to 7.0 °C warmer than modern during the Early Holocene maximum [10,000 to 8,000 years ago] in summer insolation. Chaoborus and chironomids in LIG sediments indicate July temperatures at least 5.5 to 8.5 °C warmer than modern.”
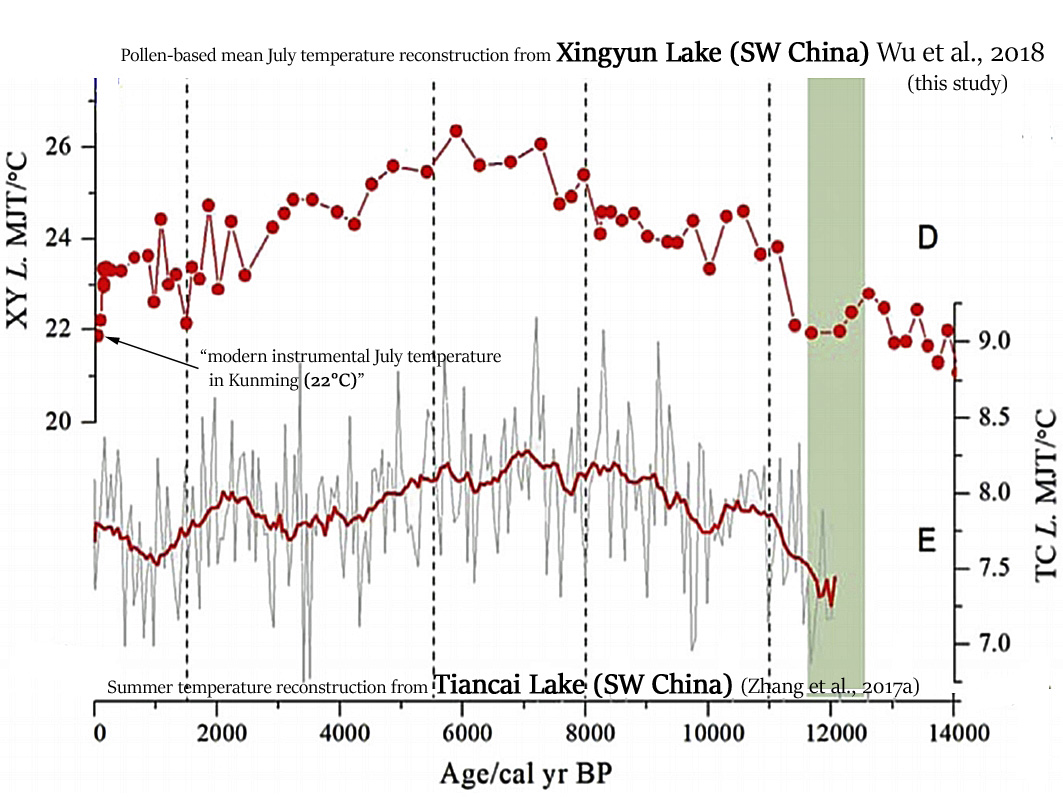
Modern Derived Temps 0.2°C Above Coldest Of Last 14,000 Years
“Summer temperatures (MJT) at Xingyun Lake in the late glacial were low, increased during the early Holocene, were highest during the middle Holocene, and then decreased during the late Holocene.The range of inferred values [for the Holocene] was 21.0°- 26.5°C. The pollen inferred temperature derived from surface samples (21.2°C), is close to the modern instrumental July temperature in Kunming (22°C), supporting the reliability of reconstructions from down-core pollen assemblages.”


1) do you think your cherry-picked locations are a sufficiently representing the global temperature record?
2) I’m asking because the usual reconstructions for the Holocene don’t vary by this much. Or do you see this differently?
3)
When posted together with that graph … you are basically repeating your demonstration, that you have no clue how CO2 and temperature are connected. Still on this trip of denying that it’s basic physics? And by it I mean the sulubility of CO2 in water in relation to temperature.
In essence: I call BS on your claim that “newly published paleoclimate reconstructions affirm that today’s surface temperatures are only slightly warmer (if at all) than the coldest periods of the last 10,000 years.” Nearly all global reconstructions joined with the measured temperature increase in the instrumental record show that it’s at least as warm today as in the warmest past periods of the Holocene.
Considering there have been nearly 300 graphs published in peer-reviewed scientific journals just since 2017 alone…
https://notrickszone.com/450-non-warming-graphs-1/
…from all over the world that look a lot like these 10 reconstructions (much colder today than during the Early- and Mid-Holocene), or that show no unusual warmth in the modern era relative to the last several millennia, or even relative to the Little Ice Age (the coldest period of the last 10,000 years), then no, I’m not impressed about your “calling BS” here.
I am not looking to impress you. I am just informing you that your usual cherry-picking is not the same as a global reconstruction and many of those global ones do exist. So why not look at them instead? Because they don’t agree with your imagined world?
ROFLMAO.
You aren’t informing anyone of anything.
You DO NOT have that capability.
You are just HIDING behind your manifest ignorance and DENIAL of the science so that your brain-hosed mind doesn’t have to face any actually REALITY.
Cherry-picked from basically EVERY part of the world. Your desperate DENAIL of science is getting quite hilarious.
Really seb.. you have NOTHING.
Stop being a CLIMATE CHANGE DENIER, seb.
So, as usual, ZERO EVIDENCE from seb
Just mindless yapping.
I call BS on your comments, seb..
.. because that is all they are.
There is no causal link from atmospheric CO2 to temperature.
YOU HAVE ZERO EVIDENCE that there is.
You are CLUELESS, in every respect.
Global temperatures are only just above those of the LIA.
Despite ALL the data from all over the world..
.. you are still in a state of manic CLIMATE CHANGE DENIAL.
Spike55, apparently you have not paid attention in school and don’t pay attention now. That would explain your reply about causal links from CO2 to temperature and lamenting about evidence without providing any yourself. I repeat myself, psychologist would pay to talk to you. Such a fascinating mind …
You KNOW there is zero evidence of CO2 causing warming. Sorry basic comprehension is beyond you.
Your continued desperate attempts at evasion and distraction to avoid providing such evidence are quite hilarious. 🙂
If you don’t understand basic science.. why do you keep commenting and making an abject fool of yourself ?
Q1. In what way has the climate changed in the last 40 years, that can be scientifically attributable to human CO2 ?
Q2. Do you have ANY EMPIRICAL EVIDENCE at all that humans have changed the global climate in ANYWAY WHATSOEVER?
Only slight warming in the last 40 years has been from two El Ninos ocean releases.
Do you have ANY EVIDENCE AT ALL that they were caused by human emissions?
Apart from the slight beneficial warming since the coldest period in 10,000 years, in what way has the global climate changed?
STILL waiting ..
.. but no expectations, except that you will post yet another evidence free, evasion/distraction rant to avoid answering simple questions with REAL EVIDENCE.
4-7 degrees warmer than now during the Holocene, seb
Less than a degree of real warming out of the LIA, seb
The world is still very much in a cold period of this interglacial, and unfortunately, looks like dropping back down, rather than continuing the slight, but highly beneficial natural warming that we have had.
seb:
You wrote, “Nearly all global reconstructions joined with the measured temperature increase in the instrumental record show that it’s at least as warm today as in the warmest past periods of the Holocene.”
Do you have an obsession with “reconstructions joined with the measured…”?
I can only assume you are attempting to paraphrase the visual results presented by Mann et al. some two decades ago, or perhaps Marcott & Shakun from five years ago.
But if one looks ONLY at proxies, one discovers rather quickly that the modern temperature records diverge from the proxy record over the past century. This suggests that the proxies do not in fact correlate with the modern efforts to calculate a global mean surface temperature anomaly.
How would you suggest squaring this circle?
Here’s what the proxy record looks like along side the urban-affected instrumental record:
https://notrickszone.com/wp-content/uploads/2017/08/Holocene-Cooling-Northern-Hemisphere-Briffa-2002-Divergence.jpg
This is the reason why Mann et al. (1998) hid the decline using “Mike’s Nature Trick” and replaced it with the instrumental record, as shown by Dr. Muller:
https://notrickszone.com/wp-content/uploads/2017/08/Hide-the-Decline-Using-Mikes-Nature-Trick.jpg
Northern Hemisphere proxy reconstructions show the same thing – cooling after the 1940s and a warming trend in the 1970s-2000s that matches or nearly matches the 1920s-1940s warming.
https://notrickszone.com/wp-content/uploads/2017/06/Holocene-Cooling-Northern-Hemisphere-Schneider-2015-Wilson-2016-Long.jpg
–
https://notrickszone.com/wp-content/uploads/2017/08/Holocene-Cooling-Northern-Hemisphere-20th-Century-Christiansen-Ljungqvist-2012.jpg
–
https://notrickszone.com/wp-content/uploads/2017/04/Holocene-Cooling-Northern-Hemisphere-Stoffel-2015.jpg
–
https://notrickszone.com/wp-content/uploads/2018/04/Northern-Hemisphere-126-Proxy-Temperatures-1800-to-2000-Xing-2016.jpg
Marcott’s graph also utilizes the same shenanigans:
http://www.comments.sciencemag.org/content/10.1126/science.1228026
What Marcott has produced for us is a climatic history of the Holocene based upon tree-ring proxies.
1. The proxy data in the accompanying Excel file show no dramatic increase in the 20th century. This can easily be checked simply by plotting the supplied data. 2. Figures S5 and S6 show no recent upturn at all. 3. The Phd thesis of the first author uses the same data sets and plots similar graphs, but with no trace of any sharp increase. This earlier contradictory work is not cited in the paper.
–
Marcott himself:
“Our global paleotemperature reconstruction includes a so-called “uptick” in temperatures during the 20th-century. However, in the paper we make the point that this particular feature is of shorter duration than the inherent smoothing in our statistical averaging procedure, and that it is based on only a few available paleo-reconstructions of the type we used. Thus, the 20th century portion of our paleotemperature stack is not statistically robust and cannot be considered representative of global temperature changes”
Why choose a proxy record that completely hides the LIA decline?
And you don’t want me to use the c-word? Do you still believe the tree ring proxy is more reliable than the instrumental record and that the later one has somehow been manipulated to show a warming that doesn’t exist? 😉
Ehm no … that graph doesn’t show this and you should know that if you read the paper. You keep bringing these graphs up as if global reconstructions would not exist at all. Why?
You keep making EMPTY comments as though you actually had evidence.
But you NEVER produce any of it…
Why ??
All REAL data shows NH at a similar temperature now as I around the 1940s.
They also show the late 1970s as the coldest period out side of the climb out of the LIA.
Stop your data DENIAL, seb. It makes you look like NOTHING but a mindless troll.
https://s19.postimg.cc/vws4z68s3/arctic_temp.png
https://s19.postimg.cc/jftrrchtf/Greenland_Dec_temps.png
https://s19.postimg.cc/5if59yngz/Ireland_AMO_article.jpg
https://s19.postimg.cc/o1d61lfoz/Ncdc_measured.jpg
https://s19.postimg.cc/rdfnulv37/Arctic-_Surface-_Temps-_Since-1920.jpg
https://s19.postimg.cc/guvpice2r/Portugal_grapes.jpg
All real data …. riiiiiiiight.
Stop cherry picking and construction a world that doesn’t exist in reality with physics that don’t work in reality.
[…] 10 New Reconstructions Show Today’s Temperatures Still Among The Coldest Of The Last 10,000 Years (Source) […]
Of course the alarmists never, ever cherry-pick😉
“This contradicts the perspective that temperatures rise in concert with CO2 concentrations.”
Which ding bat claims that perspective Seb?
On a different note Seb I strongly suggest you indulge reading the Quantum Physics 101 referred to in the 2nd last post above.
The technical article also answers Malcolm Hughes 2009 email that said “… whilst CO2 is a good candidate to explain it (global warming) It is far from proven” The article above shows the proof that it is not a candidate at all.
[…] K. Richard, September 10, 2018 in […]