Danish Professor Henrik Svensmark is a leading physicist of cosmic radiation. At the end of last year he made a presentation at the 12th International Climate Conference in Munich, where he demonstrated that the climate is indeed modulated in large part by cloud cover, which in turn is modulated by solar activity in combination with cosmic rays.
His theory is that cosmic rays, which are extremely fast-flying particles – which originate from dying supernovae – travel through the cosmos, strike the Earth’s atmosphere and have a major impact on cloud cover and thus climate on the Earth’s surface.
This, Svensmark says, has been confirmed in numerous laboratory experiments.
Video source: EIKE.
In his presentation, the renowned Danish scientist showed how solar activity modulates the cosmic rays striking the atmosphere, and thus the climate-impacting cloud cover. Dr. Svensmark shows that there are powerful correlations worldwide between solar activity and climatic cycles, and so the sun is clearly playing a role in combination with the cosmic cloud-seeding rays. Hundreds of studies confirm this.
Observations and proxy data show that “when you have high cosmic rays, you have a cold climate” because of greater cloud cover. According Svensmark, the net effect of clouds is to cool the Earth by up to 30 W/m2.
Clouds are extremely important for the Earth’s energy budget. The net effect is about 20 to 30 watts per square meter.”
That figure is great in terms of impact on climate change, and it is grossly neglected by CO2-fixated climate scientists.
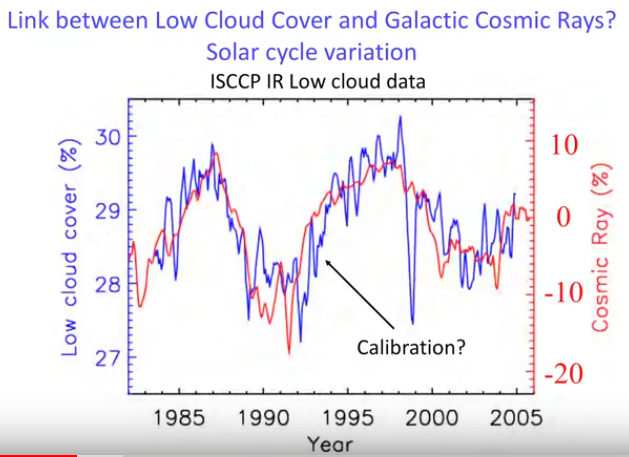
His research shows there is clear link between low cloud cover formation and galactic cosmic rays:
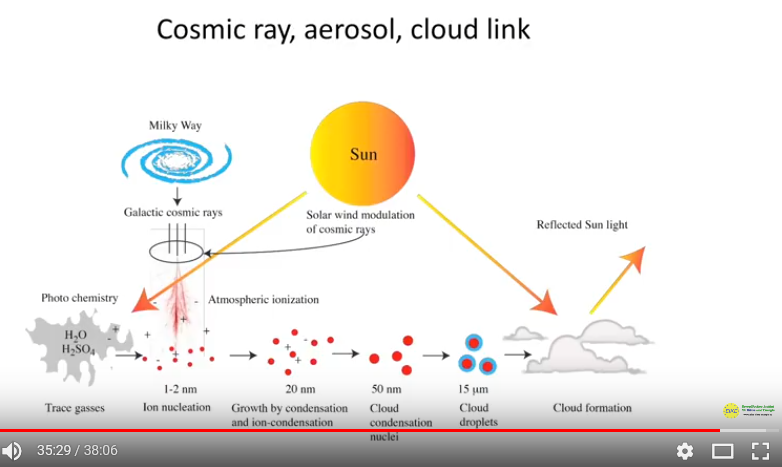
Sun modulates the cosmic ray intensity hitting the Earth’s atmosphere
In his presentation (see video) he explains the mechanism of how the cosmic rays seed low level clouds, which act to cool the climate. In periods of intense solar activity, the sun’s magnetic field engulfs and shields the Earth’s atmosphere from the cloud-seeding cosmic rays, thus less low level clouds are formed and the Earth warms.
Vice versa, i.e. during periods of low solar activity, the sun’s magnetic field is weaker, and so more cosmic rays are able to penetrate into the atmosphere and seed clouds. The resulting clouds act to cool the planet.
Confirmed by experiments
Svensmark’s experiments confirm that solar cycles impact energy changes in the oceans by an order of 1.5 W/m2 over an 11-year cycle and that his findings are consistent with climate changes over the Holocene and even geological times going back more than 100 million years.
Over geological history, especially when the Earth traveled through one of the spiral arms of the Milky Way, cosmic rays striking the atmosphere were very intense and thus led to extremely cold conditions known as the Snowball Earth episodes. Other scientists insist the episodes were caused by intense volcanic eruptions.
Significant solar changes in Earth’s energy budget
Dr. Svensmark summarizes the solar activity/cosmic ray climate modulation system with the following chart:
In the end, changes in solar activity lead to significant changes in the earth’s energy budget, and thus climate change, Svensmark believes. This explains why the Earth has seen “coolings and warmings of around 2°C repeatedly over the past 10,000 years.”
He concludes:
The Sun became unusually active during the 20th Century and as a result part of the ‘global warming’ observed.”


https://www.sciencedaily.com/releases/2017/12/171219091320.htm
• Low clouds made with liquid water droplets cool the Earth’s surface.
•Variations in the Sun’s magnetic activity alter the influx of cosmic rays to the Earth.
•When the Sun is lazy, magnetically speaking, there are more cosmic rays and more low clouds, and the world is cooler.
•When the Sun is active fewer cosmic rays reach the Earth and, with fewer low clouds, the world warms up.
The implications of the study suggests that the mechanism can have affected:
• The climate changes observed during the 20th century
• The coolings and warmings of around 2°C that have occurred repeatedly over the past 10,000 years, as the Sun’s activity and the cosmic ray influx have varied.
• The much larger variations of up to 10°C occuring as the Sun and Earth travel through the Galaxy visiting regions with varying numbers of exploding stars.
————————
According to Feldman et al. (2015), the 22 ppm increase in CO2 concentration resulted in a 0.2 W m-2 per decade radiative forcing.
Due to changes in the Sun’s geomagnetic constitution that affect changes in decadal-scale cloud cover over the course of the last 3 decades, the forcing from absorbed surface solar radiation via the reduction in cloud cover is about 10 times greater than the (tiny) alleged per decade forcing from CO2 concentration changes. And, unlike CO2, SW radiation resulting from changes in cloud cover can penetrate by 10s of meters into the ocean, whereas IR cannot penetrate past the hair-thin skin layer. Therefore, even tiny changes in cloud cover can modulate ocean heat content on magnitudes-greater scale than tiny parts-per-million (0.000001) changes in atmospheric CO2 — even assuming that the forcing values for CO2 are not just theoretical and model-based, but real.
——————-
http://www.sciencemag.org/content/308/5723/850.abstract
“Long-term variations in solar radiation at Earth’s surface (S) can affect our climate, the hydrological cycle, plant photosynthesis, and solar power. Sustained decreases in S [surface solar radiation] have been widely reported from about the year 1960 to 1990. Here we present an estimate of global temporal variations in S by using the longest available satellite record. We observed an overall increase in S [surface solar radiation] from 1983 to 2001 at a rate of 0.16 watts per square meter (0.10%) per year [1.6 W m-2 per decade].”
—
https://link.springer.com/article/10.1007/s00704-016-1829-3
“The present paper describes how the entire series of global solar radiation (1987–2014) and diffuse radiation (1994–2014) were built, including the quality control process. Appropriate corrections to the diffuse component were made when a shadowband was employed to make measurements. Analysis of the series reveals that annual mean global irradiance presents a statistically significant increase of 2.5 W m−2 (1.4 %) decade−1 (1988–2014 period)
—
http://www.atmos-chem-phys.net/13/8505/2013/acp-13-8505-2013.html
“[T]here has been a global net decrease in 340 nm cloud plus aerosol reflectivity [1979-2011]. … Applying a 3.6% cloud reflectivity perturbation to the shortwave energy balance partitioning given by Trenberth et al. (2009) corresponds to an increase of 2.7 W m−2 of solar energy reaching the Earth’s surface and an increase of 1.4% or 2.3 W m−2 absorbed by the surface.”
—
http://www.atmos-chem-phys.net/12/9581/2012/acp-12-9581-2012.html
“The Earth’s climate is driven by surface incident solar radiation (Rs). Direct measurements have shown that Rs has undergone significant decadal variations. … By merging direct measurements collected by Global Energy Budget Archive with those derived from SunDu [sunshine duration], we obtained a good coverage of Rs [surface incident solar radiation] over the Northern Hemisphere. From this data, the average increase of Rs [surface incident solar radiation] from 1982 to 2008 is estimated to be 0.87 W m−2 per decade [2.3 W/m-2 total]”
—
ftp://bbso.njit.edu/pub/staff/pgoode/website/publications/Palle_etal_2005a_GRL.pdf
“Traditionally the Earth’s reflectance has been assumed to be roughly constant, but large decadal variability, not reproduced by current climate models, has been reported lately from a variety of sources. There is a consistent picture among all data sets by which the Earth’s albedo has decreased over the 1985-2000 interval. The amplitude of this decrease ranges from 2-3 W/m2 to 6-7 W/m2 but any value inside these ranges is highly climatologically significant and implies major changes in the Earth’s radiation budget.”
—
Sapozhnikova et al., 2018
http://iopscience.iop.org/article/10.1088/1755-1315/211/1/012039/pdf
“In spite of the small changes in the solar constant, they are supposed to have a modulating influence on the local (regional) climate [Frӧhlich, 2010; Lean and Rind, 2008], which can be more sensitive to changes in the solar activity [Grey et al., 2010; Lockwood, 2012]. … The cross-spectrum and the coherency spectrum point to the relation of the cloudiness to the solar cycle, with the variations in the cloudiness occurring, according to the phase spectrum, approximately in phase with the solar cycle. The cloudiness variations modulate the solar radiation intensity at the surface level by screening the direct and increasing the diffusive radiation, and it could be the reason for the (СО2+Н2О) variations on the scale of the solar cycle period. Comparison of the phase spectra […] shows that the solar cycle-like variations of CO2+H2O are approximately in phase with the variations of the cloud cover.”
—
Van Geel and Ziegler, 2013
https://www.researchgate.net/profile/Bas_Geel/publication/275459414_IPCC_Underestimates_the_Sun's_Role_in_Climate_Change/links/5543916f0cf234bdb21bd1e8.pdf
“[T]he IPCC neglects strong paleo-climatologic evidence for the high sensitivity of the climate system to changes in solar activity. This high climate sensitivity is not alone due to variations in total solar irradiance-related direct solar forcing, but also due to additional, so-called indirect solar forcings. These include solar-related chemical-based UV irradiance-related variations in stratospheric temperatures and galactic cosmic ray-related changes in cloud cover and surface temperatures, as well as ocean oscillations, such as the Pacific Decadal Oscillation and the North Atlantic Oscillation that significant affect the climate. … [T]he cyclical temperature increase of the 20th century coincided with the buildup and culmination of the Grand Solar Maximum that commenced in 1924 and ended in 2008.”
Since TSI estimates based on proxies are relatively poorly constrained, they vary considerably between authors, such as Wang et al. [40] and Hoyt and Schatten [41]. There is also considerable disagreement in the interpretation of satellite-derived TSI data between the ACRIM and PMOD groups [42,43]. Assessment of the Sun’s role in climate change depends largely on which model is adopted for the evolution of TSI during the last 100 years [44,45,46]. The ACRIM TSI satellite composite shows that during the last 30 years TSI averaged at 1361 Wm-2, varied during solar cycles 21 to 23 by about 0.9 Wm-2, had increased by 0.45 Wm-2 during cycle 21 to 22 to decline again during cycle 23 and the current cycle 24 [47]. By contrast, the PMOD TSI satellite composite suggests for the last 30 years an average TSI of 1366, varying between 1365.2 and 1367.0 Wm-2 that declined steadily since 1980 by 0.3 Wm-2. On centennial and longer time scales, differences between TSI estimates become increasingly larger. Wang et al. [40] and Kopp and Lean [48] estimate that between 1900 and 1960 TSI increased by about 0.5 Wm-2 and thereafter remained essentially stable, whilst Hoyt and Schatten [41] combined with the ACRIM data and suggest that TSI increased between 1900 and 2000 by about 3 Wm-2 and was subject to major fluctuations in 1950-1980 [46,49]. Similarly, it is variably estimated that during the Maunder Solar Minimum (1645- 1715) of the Little Ice Age TSI may have been only 1.25 Wm-2 lower than at present [40,50,51,52] or by as much as 6 ± 3 Wm-2 lower than at present [39,41], reflecting a TSI increase ranging between 0.09% and 0.5%, respectively (fig. 2).”
So you believe the forcing of the cloud cover change is around 2 W/m²? What is the total forcing of all clouds again? Something around 20 W/m²? So you believe the cloud cover decreased by roughly 10%? Or are we again forgetting half of the equation?
Why do you think that matters? It’s about the heat transfer. Inhibit heat from “escaping” and you got yourself a new equilibrium at a higher heat content level. No need for penetration.
Not understanding these basic principles is pretty bad for a skeptic. What are you even skeptical of when you don’t understand these basic things?
That’s what satellite observations point to for the 1979-2011 period. +2.3 W m-2 of absorbed solar radiation warming the oceans from albedo changes. Other estimates are higher when we begin in the mid- to late-80s.
http://www.atmos-chem-phys.net/13/8505/2013/acp-13-8505-2013.html
“[T]here has been a global net decrease in 340 nm cloud plus aerosol reflectivity [1979-2011]. … Applying a 3.6% cloud reflectivity perturbation to the shortwave energy balance partitioning given by Trenberth et al. (2009) corresponds to an increase of 2.7 W m−2 of solar energy reaching the Earth’s surface and an increase of 1.4% or 2.3 W m−2 absorbed by the surface.”
https://link.springer.com/article/10.1007/s00704-016-1829-3
“Analysis of the series reveals that annual mean global irradiance presents a statistically significant increase of 2.5 W m−2 (1.4 %) decade−1 (1988–2014 period), mainly due to what occurs in summer (5.6 W m−2 decade−1).”
Tropical regions have an even higher solar brightening trend…
http://onlinelibrary.wiley.com/doi/10.1002/2013JD021322/abstract
“Trends in downwelling global solar irradiance were evaluated at high elevation sites on the island of Maui, Hawaii. Departures from monthly means were assessed for the 6-month Hawaiian wet and dry seasons over the period 1988 to 2012. Linear regression analysis was used to characterize trends in each season. For the dry season (May-October), statistically significant (p ≤0.05) positive trends of 9–18 W m-2 (3–6%) per decade were found at all four high elevation stations tested. Wet season trends were not significant, except at the highest elevation station, which had a significant negative trend. No consistent trends in aerosol concentrations have been observed at high elevations in Hawaii, therefore, the observed dry-season brightening is most likely the result of decreasing cloud cover. Supporting this hypothesis, analysis of 15 years (1997-2012) of high temporal resolution Geostationary Operational Environmental Satellite (GOES) imagery over the Hawaiian Islands showed a statistically significant decrease in leeward cloud cover amounting to 5–11% per decade over the stations.”
No, 3.6% to 6.8%, or somewhere in that range. Trenberth’s energy budget data are used to calculate the W m-2 values.
http://file.scirp.org/Html/22-4700327_50837.htm
“There is general consistency of a reduction in total cloud cover as temperature anomaly increases, with cloud cover decreasing from about 1984 until year 2000 followed by a flattening out to 2009, which is the end of the available cloud cover data. The decrease in total cloud cover anomaly is approximately 4.5 percent of sky, against the long-term average (all months 1984-2009 inclusive) of 66.4 percent of sky, which means a reduction of 6.8% of the cover.”
“The reduction in total cloud cover [between 1984-2009] is significant in the context of the energy budget described by Trenberth et al., which indicates that cloud reflect 23% of the 341 Wm−2 (i.e. 79 Wm−2) of incoming solar radiation. The reduction in total cloud cover of 6.8% means that 5.4 Wm−2 (6.8% of 79) is no longer being reflected but acts instead as an extra forcing into the atmosphere, some of which will be lost when it adds to the longwave radiation to space. Of course clouds have many other effects on the earth’s radiation budget many of which are not fully understood, but a change of 5.4 Wm−2 is potentially of considerable significance.
“To put this [5.4 Wm-2 of solar radiative forcing via cloud cover reduction between 1984-2009] into context, the IPCC Fifth Assessment Report, section 8.5.2, states that the total anthropogenic radiative forcing for 2011 relative to 1750 is 2.29 Wm−2 for all greenhouse gases and for carbon dioxide alone is 1.68 Wm−2. The increase in radiative forcing caused by the reduction in total cloud cover over 10 years is therefore more than double the IPCC’s estimated radiative forcing for all greenhouse gases and more than three times greater than the forcing by carbon dioxide alone [from 1750 to present]. Even the upper limits of the IPCC’s estimates fall well short of the increase in radiative forcing caused by the reduction in total cloud cover.”
“Herman et al. determined 340nm Lambertian equivalent reflectivity of the Earth from 1979 to 2011 and found a 3.6% ± 0.2% decrease in cloud reflectivity over that period, which after applying the shortwave energy balance in Trenberth et al. concluded an increase of 2.7 Wm−2 insolation, of which 2.3 Wm−2 was absorbed by the Earth’s offset slightly by increased longwave cooling. This is less than the 5.4 Wm−2 described above, possibly because it focuses on 340 nm reflectivity, but it likewise finds a reduction in cloud cover and a consequent increase in surface temperature.”
And, unlike CO2, SW radiation resulting from changes in cloud cover can penetrate by 10s of meters into the ocean, whereas IR cannot penetrate past the hair-thin skin layer.
Because cloud radiative forcing dominates over CO2 forcing in determining energy budget changes, a small change in cloud cover will render ppm changes in CO2 rather negligible.
https://www.ncbi.nlm.nih.gov/pubmed/17780422
“The size of the observed net cloud forcing is about four times as large as the expected value of radiative forcing from a doubling of CO2. The shortwave and longwave components ofcloud forcing are about ten times as large as those for a CO2 doubling.”
“The combined effect of LW absorption and emission-that is, the greenhouse effect-is a reduction in the LW radiation emitted to space. The greenhouse effect of clouds may be larger than that resulting from a hundredfold increase in the CO2 concentration of the atmosphere“
http://lightning.sbs.ohio-state.edu/geo622/paper_thermostat_Ramanathan1991.pdf
“Water vapour and cloud are the dominant regulators of the radiative heating of the planet. … It would take more than an order-of-magnitude increase in atmospheric CO2 to increase the maximum [sea surface temperature] by a few degrees“
Nope, no need for penetration…if the expected impact on ocean temperatures for CO2 is minimal to negligible, and not dominating, relative to changes in direct SW radiative forcing via albedo changes. Do you then acknowledge that CO2 cannot maintain a dominant influence?
No need to repeat your quotes. Do you know that there is another component to the effect of cloud cover than by how much solar radiation of the surface changes with more or less cover? You know … the second half of the equation?
That or rather the quotes that follow aren’t an answer to my question. You specifically state that it matters that the radiation penetrates. This shows to me that you have no real idea of how the GHE works. So why does it matter?
Huh? You seem to evade what this is about. Let’s assume for a moment that the oceans would not receive any sunlight and had an internal source of energy of the same size. Now assume we radiate IR towards the ocean surface. Do you think it matter if that radiation is able to penetrate or just affects the surface layer in order to cause a heat content buildup?
It doesn’t matter that other influences on the climate are bigger by value. That doesn’t make the CO2 effect (or rather the increased GHE) magically disappear. Day and night temperature changes are also far bigger than the average temperature increase. Do you want to argue that the day and night change overrides climate change?
Yes, it’s the “greenhouse effect of clouds” which is…
https://www.ncbi.nlm.nih.gov/pubmed/17780422
“The combined effect of LW absorption and emission-that is, the greenhouse effect-is a reduction in the LW radiation emitted to space. The greenhouse effect of clouds may be larger than that resulting from a hundredfold increase in the CO2 concentration of the atmosphere (2).”
Because any change in the modulation of direct shortwave will have orders of magnitude more influence on the temperature of the ocean than any negligible change in the longwave that cannot penetrate past the ocean skin. Shortwave modulation therefore dominates as a regulator of ocean heat.
Your thought experiments lack any merit whatsoever. Without sunlight or solar heat, there would be no ocean. So we can’t even begin.
How amusing. Of course you don’t think it matters. If you acknowledged it does matter, it’d destroy your argument that humans are capable of controlling the ocean temperatures just by increasing or decreasing their CO2 output.
No one has claimed that “the CO2 effect” “magically disappears”. As you know, but choose to disingenuously write anyway, I don’t use the word “magic”, nor do I use the word “disappears” with regard to heat transfer. Instead, we say that “the CO2 effect”, as alleged, is overwhelmed by the orders-of-magnitude stronger determinants (i.e., albedo changes via cloud and volcanic aerosols) modulating shortwave solar energy absorption.
No. Decadal-scale changes in (tropical) cloud cover modulates decadal-scale temperature changes, or climate.
Of course it is? Ever witnessed the difference between a cloudy and a clear winter nights? What are you trying to say with this? The day and night temperature change is big as well, but it doesn’t override the general increase in temperatures.
There is no need for penetration. As long as one carries more energy than the other it has a bigger effect. Of course you hopefully know that longwave radiation from clouds or GHGs is not a source of energy for the oceans, do you? The effect of this mechanism is a different one.
That makes no sense at all … what do you think “solar heat” is?
There is nothing amusing about this reply though. If you want to go this route, let’s look at the last paragraph of yours then. The Sun is obviously the root cause for everything going on with the climate, so large of an influence that everything pales in comparison. So nothing else matters, right? Only problem here, the Sun has been pretty much constant over a long time. So the effect it has on changes of the climate aren’t that large and lately its output even decreased, so …
Why does that matter? You claim since we don’t know the results of a very specific experiment that there could as well be no effect at all. That amounts to believing in magic or could just be a lack of understanding of the physics involved. Who knows …
A steady forcing is not overwhelmed by other forcings. If there is a compensating forcing that counteracts CO2 forcing, show us! Otherwise please send me $10 per month since your regular income (hopefully) overwhelms that as well and you wouldn’t notice any change in your account balance anyway, right?
And don’t you think it’s funny that only so called climate skeptics believe in this cloud/volcanism thing and imagine that the whole field of climate science has it wrong? I’d be very skeptical of such a group why aren’t you?
If you say so … and cosmic rays modulate cloud cover and something is completely compensating the CO2/GHG effect, but only when the concentration changes, not the entire effect (I really hope you are not arguing that there is no GHE because you imaging it has never been measured/observed).
No, it means we don’t have enough information to know the extent to which CO2 changes affect the temperature of water bodies. You think we do have this information, and yet when you’re asked to produce it, you can’t. There is just no point to continuing down this dead end with you.
“This shows to me that you have no real idea of how the GHE works”
We have asked MANY times for your explanation, backed by real science, as to how this mythical GHE works.
So far … EMPTY, NADA, NOTHING
Seems you don’t even know your own religion. !
“(I really hope you are not arguing that there is no GHE because you imaging it has never been measured/observed).”
So you ADMIT that it is a thing of MYTHOLOGY.
Do you have any such observations or measurements of CO2 warming ???
About time you woke up to reality.
“Not understanding these basic principles is pretty bad for a skeptic. What are you even skeptical of when you don’t understand these basic things?”
We have all seen just HOW LITTLE your comprehension of real science is, seb.
You cannot even support the most basic principle of your wacked out AGW religion.
Your comment is like a kindy student criticising a teacher.!
The forcing from CO2 is “weak” to negligible at the poles (~1 W m-2).
–
Schmithusen et al., 2015
“Increasing CO2 has a rather small direct effect on the Antarctic climate. It even tends to cool the Earth-atmosphere system of the Antarctic plateau.” There is a “weak absorption of solar radiation by CO2. Over Antarctica, this sums up to 0.5 W m-2 for the autumn, winter, and spring, and up to 1 W m-2 in summer.”
–
Schmithusen et al., 2015
“Over Greenland, the greenhouse effect for CO2 is also comparatively weak.”
–
Scientists have suggested an alternative mechanism that melts polar ice…
–
https://news.wisc.edu/thin-clouds-drove-greenlands-record-breaking-2012-ice-melt/
Thin clouds drove Greenland’s record-breaking 2012 ice melt
–
http://advances.sciencemag.org/content/3/6/e1700584/tab-pdf
“Decreasing cloud cover drives the recent mass loss on the Greenland Ice Sheet … The Greenland Ice Sheet (GrIS) has been losing mass at an accelerating rate since the mid-1990s. … We show, using satellite data and climate model output, that the abrupt reduction in surface mass balance since about 1995 can be attributed largely to a coincident trend of decreasing summer cloud cover enhancing the melt-albedo feedback. Satellite observations show that, from 1995 to 2009, summer cloud cover decreased by 0.9 ± 0.3% per year. Model output indicates that the GrIS summer melt increases by 27 ± 13 gigatons (Gt) per percent reduction in summer cloud cover, principally because of the impact of increased shortwave radiation over the low albedo ablation zone. The observed reduction in cloud cover is strongly correlated with a state shift in the North Atlantic Oscillation promoting anticyclonic conditions in summer and suggests that the enhanced surface mass loss from the GrIS is driven by synoptic-scale changes in Arctic-wide atmospheric circulation.”
–
http://www.nature.com/ncomms/2016/160112/ncomms10266/pdf/ncomms10266.pdf
“Clouds are known to play a pivotal role in regulating the local SEB [Surface Energy Balance], with competing warming and cooling effects on the surface. … The satellite-based cloud observations allow to estimate the cloud impact on the SEB [Surface Energy Balance]. … The annual mean CRE [Cloud Radiative Effect] of 29.5 (±5.2) W m 2 provides enough energy to melt 90 Gt of ice in the GrIS [Greenland Ice Sheet] ablation area during July and August. … The snow model simulations, which capture the evolution of the GrIS SMB [Surface Mass Balance] from 2007 to 2010, indicate that clouds warm the GrIS [Greenland Ice Sheet] surface by 1.2 (±0.1) °C on average over the entire period [2007-2010].”
Interestingly clouds warm the surface in Greenland? So less Sun equals more cosmic rays equals more clouds and thus more warming in Greenland? Interesting, how does that work with your other claim that less clouds cause warming?
You’re shooting in the dark. Read “Chilling Stars” before commenting on this subject.
To what extent do you actually read the papers that are cited here? Do you read more than a few lines before you begin writing your “rebuttal” attempts?
Clouds dominate the radiation budget in the Arctic region (at the poles) in both shortwave and longwave, with gradations in each dependent largely on the season/months (keeping in mind there is no SW forcing during winter). Cloud radiative forcing therefore necessarily overwhelms the tiny contribution (alleged) from CO2 concentrations for the polar regions (i.e., ~1 W m-2).
In the tropics, where there is solar radiation year-round (unlike at the poles), the shortwave facet of cloud radiative forcing (reduction in low clouds = more solar heat absorbed) is far more dominant (on net) than it is at the poles. So there’s also a regional difference in how clouds determine radiation budgets. Because the tropics receive and absorb the vast majority of the Earth’s solar heat and then distribute that heat throughout the entire globe’s oceanic conveyor belt, this is why most graphical depictions show the tropical cloud cover changes and why scientists state that the globe’s radiation budget are “caused by changes in tropical mean cloudiness“.
Here are some more papers to help you understand.
Perovich, 2018
https://www.the-cryosphere.net/12/2159/2018/tc-12-2159-2018.pdf
“The surface radiation budget of the Arctic Ocean plays a central role in summer ice melt and is governed by clouds and surface albedo. … Longwave and shortwave radiation are primary drivers in the surface heat budget during summer melt (Persson et al., 2002). The surface radiative balance consists of contributions from incoming shortwave radiation, reflected shortwave radiation, incoming longwave radiation, and outgoing longwave radiation. Clouds have a major impact on both incoming longwave and shortwave radiative fluxes.”
Nicolas et al., 2017
https://www.nature.com/articles/ncomms15799
“Clouds exert an important influence on the SEB by modulating the radiative fluxes, primarily by enhancing downwelling longwave radiation and attenuating incoming solar radiation. In particular, low-level liquid-bearing clouds can have a determinant role in either causing or prolonging melting conditions over ice sheets.”
http://journals.ametsoc.org/doi/abs/10.1175/JCLI-D-15-0076.1
“The surface energy budget plays a critical role in determining the mass balance of the Greenland Ice Sheet, which in turn has significant implications for global sea levels. Nearly three years of data (January 2011–October 2013) are used to characterize the annual cycle of surface radiative fluxes and cloud radiative forcing (CRF) from the central Greenland Ice Sheet at Summit Station. The annual average CRF [cloud radiative forcing] is 33 W m−2, representing a substantial net cloud warming of the central Greenland surface. Unlike at other Arctic sites, clouds warm the surface during the summer. The surface albedo is high at Summit throughout the year, limiting the cooling effect of the shortwave CRF and thus the total CRF is dominated by cloud longwave warming effects in all months. All monthly mean CRF [cloud radiative forcing] values are positive (warming).”
“Clouds are known to play a pivotal role in regulating the local SEB [Surface Energy Balance], with competing warming and cooling effects on the surface. … The satellite-based cloud observations allow to estimate the cloud impact on the SEB [Surface Energy Balance]. … The annual mean CRE [Cloud Radiative Effect] of 29.5 (±5.2) W m 2 provides enough energy to melt 90 Gt of ice in the GrIS [Greenland Ice Sheet] ablation area during July and August. … The snow model simulations, which capture the evolution of the GrIS SMB [Surface Mass Balance] from 2007 to 2010, indicate that clouds warm the GrIS [Greenland Ice Sheet] surface by 1.2 (±0.1) °C on average over the entire period [2007-2010]. … These results further indicate that not only liquid-bearing clouds but also clouds composed exclusively of ice significantly increase radiative fluxes into the surface and decrease GrIS SMB [Greenland Ice Sheet Surface Mass Balance]”
The less-clouds-cause-warming is the shortwave forcing aspect of cloud radiative forcing. It is more substantial, on net, than the longwave forcing (warming) effect of clouds.
Why do you insist on portraying this as my claim? Scientists publishing in the journal Science have written that cloud cover decreases during the summer melting peak season have driven ice sheet melt since the mid-1990s. Do you think they’re wrong?
http://advances.sciencemag.org/content/3/6/e1700584/tab-pdf
“Decreasing cloud cover drives the recent mass loss on the Greenland Ice Sheet … The Greenland Ice Sheet (GrIS) has been losing mass at an accelerating rate since the mid-1990s. … We show, using satellite data and climate model output, that the abrupt reduction in surface mass balance since about 1995 can be attributed largely to a coincident trend of decreasing summer cloud cover enhancing the melt-albedo feedback. Satellite observations show that, from 1995 to 2009, summer cloud cover decreased by 0.9 ± 0.3% per year. Model output indicates that the GrIS summer melt increases by 27 ± 13 gigatons (Gt) per percent reduction in summer cloud cover, principally because of the impact of increased shortwave radiation over the low albedo ablation zone.”
[…] Professor Henrik Svensmark – Munich Conference: Leading Danish Astrophysicist Says Solar Activ… […]
The rhythm of the sun drives the climate variability, who would have ever thunk it. 🙂
Those believing in guys like Svensmark because they need this to be true to justify further ignoring the consequences of AGW?
So the currently decreasing Sun is causing cosmic rays to increase and thereby increases cloud cover and thus it is cooling? Why has it warmed then in the last decades? Makes no sense at all …
Solar activity has been relatively low only since about 2006…before that it had been strong for almost the entire 20th century. You need to go back and look at the solar activity data.
Pierre, you wrote “Svensmark’s experiments confirm that solar cycles impact energy changes in the oceans by an order of 1.5 W/m2 over an 11-year cycle”. So it should be visible even within a cycle and not only over long periods. This cycle has been pretty weak. Solar activity has been decreasing for a while now. Yet heat content is still increasing. How does this fit together?
I’d also like to see a more current cloud cover graph. All I can find are graphs going to the year 2009 and it doesn’t look like the cloud cover decreased in those. Overall yes, but the last datapoint in December 2009 is higher than at the beginning of the graph in 1983 (https://www.climate4you.com/images/CloudCoverTotalObservationsSince1983.gif). Has it increased from 2009 on? Has it decreased? Should have increased if what you guys claim is true, right? So how does it come that it continued to warm since then?
SebastianH
So that is your only feeble response eh?
Come on SebH lets have some of you analogies, I like them as there really funny 🙂 As a true believer can you quote the great prophets Hansen, Trenberth, or Gore?
so here’s one to get you head around …
Yep this very quote is from NASA, who’s observed and recorded solar events impacting this planets weather and climate are used by NCAR. Not that they can understand it either, but one thing is for sure the sun dictates the rhythms of how our climate changes NOT CO2 — of course if you have any real evidence (in contrast to imaginatively computer modeled nonsense) to bring to the discussion I’m willing to read it. But as I know its highly unlikely for you to supply any observational evidence of atmospheric CO2 warming as you’ve been asked before, I’ll just assume you have none and dismiss your cranky comments as usual.
P.S. IMO 2020 is still on target as the start of effects of the current solar decline on this planet’s climate. It will not stop the atmospheric CO2 continued rise though. I hope you’ve budgeted for better warm cloths for coming winters as you’ll need them 🙂
Have a good time enjoying yourself by churning out the some old half thought out crud you’ve always done.
SebH blathers: “So it should be visible even within a cycle and not only over long periods.”
The heat content of the ocean is orders of magnitude greater than the atmosphere. It takes a long time to lose it’s heat. And the atmosphere isn’t likely to cool noticeably until it does. Perhaps we are seeing the affect of solar calm in the decreasing El Ninos, which is why the earth has stopped warming FOR NEARLY THE PAST TWO DECADES? Much more likely that anything the chatbot mimic has ever come up with.
He’s really laughable, in that he makes things up constantly, or gives us links to people who make things up. And they are virtually always wrong, as wrong can be. It’s like he works at it. A real pest, but then I think that’s his primary joy in life, to annoy others. Well, the more he goes on, the more amused and the less annoyed I get.
That’s probably a good enough reason for Pierre to keep him around. Comic relief.
Yonason,
You mean like the flash of lightning and the rumble of thunder? If they were to happen together then you’d better check that your still alive eh? 🙂
Seriously though, it is one area where cAGW believers always fall down, they have no sense of time, no sense that events and the effects that happen after can have a delay, sometime quite a long delay. Mind-boggling ineptitude on their behalf.
Must be because they were brought-up with the idea that they ‘should’ get instant gratification for whatever modest effort they perform.
That’s certainly plausible.
But that would be drummed out of them in college, and finished off in grad school, if there was any left; if his course of study was sufficiently rigorous, like they nearly all used to be.
I ran into someone a while back who had the nutty notion that “If humans can imagine it, they can do it.” Um, no.
Further conversation indicated that he believed it to be literally true. I don’t know where he acquired that crazy idea, but I believe he was enrolled at the local university. I should have asked him what his major was.
“Makes no sense at all …”
Basic scientific comprehension has always been beyond your ability, seb.
It is encouraging to see scientific investigation and data analysis being applied to climate science rather than computer games that produce whatever the operator wants them to produce.
Cosmic radiation is still climbing:
http://cosmicrays.oulu.fi/webform/onlinequery.cgi?station=OULU&startday=01&startmonth=01&startyear=2000&starttime=00%3A00&endday=23&endmonth=01&endyear=2019&endtime=23%3A30&resolution=Automatic+choice&outputmode=default&picture=on
Tropical ocean surface temperature peaked in 2016:
http://climexp.knmi.nl/data/ihadisst1_0-360E_30–30N_n_2000:2019_a.png
Will be interesting to see how long the cooling trend persists.
You enjoy the correlation game? Who would have thought 😉
So why isn’t it getting cooler?
At the height of the last El Nino, yes. Pretty surprising, isn’t it? Maybe take a look at heat content instead 😉
What cooling trend?
SebH asks “What cooling trend?”
Sorry SebH you’re not allowed there, the consensus forbids it.
🙂 🙂
P.S. What warming trend?
The majority of heat in the climate system comes from the tropical oceans because they are on average hotter than anywhere else on the planet that impacts the climate. Heat flows from the tropical ocean surface, where it is collected, to the atmosphere; gets transported by currents and conduction into the deeper ocean and gets transported to higher latitudes.
When the tropical oceans are cooling, heat is being lost from the climate system. The data from ARGO used for heat content calculation inevitably lags what is happening on the surface due to the thermal inertia of the oceans.
Ocean heat content is being hyped now as “hottest ever” as it sounds much more threatening than stating 2018 had the “18th hottest” global sea surface temperature in the 21st century.
The focus will remain on ocean heat content until it is obviously declining.
I agree with your first paragraph.
An El Nino is a release of stored ocean energy which manifests itself by a warmer surface, not a cooler one. When the surface of an object with a constant energy source warms up it loses more energy than when the surface is cooler.
Huh? 2018 was on track to be the 4th hottest year, how did it become so cold in the last few days of the year?
Ocean heat content or rather total heat content should always be what determines if global warming is happening or not. An average temperature of something can be an indicator, but it’s always about the heat content …
And when will that be? Have you made the same hopeful bet/wish in 2008 when skeptics predicted global cooling the last time? How did that turn out?
When OHC declines for a longer time we can speak of a pause, hiatus or maybe even a global cooling. Until then anonymous internet guy.
OHC in perspective
https://i.postimg.cc/rwSWqS8T/OHC_rosenthal-2013-figure-2c-annotated.png
See that little red squiggle at the end. That’s us humans, according to the “all-knowing-nothing” seb
spike55, I am really glad you are back … how do you think modern OHC graphs showing an amount of Joules for layers of the global oceans could be combined with the graph you posted? Any idea how to convert one to the other form?
[…] Clouds are extremely important for the Earth’s energy budget. The net effect is about 20 to 30 watts per square meter. (Source) […]
SMHI agrees!
https://www.smhi.se/klimatdata/meteorologi/stralning/solstralning-i-sverige-sedan-1983-1.8243
All of the atmosphere above the Arctic Circle does not receive any sunlight during these winter months, yet Arctic air masses are being bombarded with cosmic rays, correct?
Those cosmic rays are then seeding and forming clouds when H2O and H2SO4 aerosols are present, moist air masses that have been warmed by the sun and then move into the Arctic region.
Increased albedo over the Arctic is the result?
Whether or not the Weather is getting hotter or colder is of little consequence.
Period
The sensitivity of earth temperature to clouds is analyzed at http://lowaltitudeclouds.blogspot.com
I note from my notes about a 2013 NASA blog/video post (I’ve lost the reference for it) …
There are many “top-down” pathways for the sun’s influence. E.g, Charles Jackman of the Goddard Space Flight Center has explained how nitrogen oxides (NOx) created by solar energetic particles and cosmic rays in the stratosphere might reduce ozone levels (within the tropopause) by a few percent. Because ozone absorbs UV radiation, less ozone means that more UV rays from the sun would reach Earth’s surface.
Greg Kopp of the Laboratory for Atmospheric and Space Physics at the University of Colorado, pointed out some time ago, that while the variations in luminosity over the 11-year solar cycle amount to only a tenth of a percent of the sun’s total output, such a small fraction is still important.
As he said
Also noted is that the sun’s extreme ultraviolet (EUV) radiation, which peaks during the years around solar maximum. Within the relatively narrow band of EUV wavelengths, the sun’s output varies not by a minuscule 0.1%, but by whopping factors of 10 or more. This will strongly affect the chemistry and thermal structure of the upper atmosphere.
Isaac Held of NOAA went a step further …
He described how loss of ozone in the stratosphere could alter the dynamics of the atmosphere below it.
And the angular momentum budget determines how the weather behaves.
In other words, solar activity felt in the upper atmosphere can, through a complicated series of influences, push surface weather tracks — winds, clouds, storms, etc. — off course.
Basically a Rube Goldberg apparatus that WORKS?! Who’d a thunk it?
Nice, btw. I’ll have to look into that some in a bit. Thanks.
Also of note (for the SebastianH types lurking in the shadows) —
The oceans have a mass about 272 times that of the atmosphere.
The specific heat of water is approximately 4 times that of air.
The density of water is approximately 1000 times that of air.
The oceans’ thermal inertia is many times that of the atmosphere.
From these bare scientific elements it is plainly obvious that the oceans would require far more energy to increase the temperature, than that of the air for the same temperature rise. And that for any rate of applied heating or cooling the oceans take longer to reach a new temperature than the air does.
Anyone who ignores the thermal capacity of the oceans or believes in the nonsense of “spreading sunlight all over the globe at one time such that the solar radiance is reduced to 239 W/m2” simply isn’t thinking straight.
Changing the cloud cover will (of course) affect the atmospheric temperature so much faster than the ocean temperatures.
Fascinating, in other instances you claim that even a large change of something as small as the CO2 concentration can not have a big effect because the concentration is so small … and yet here you go and attribute “strong effects” to a large change of a very small part of the Sun’s radiative spektrum 😉
I guess the logic becomes sound when adding the attribute “whopping” to anything, right?
I have to agree with Yonason here. Everything is connected. Imaginging changing GHG concentrations have no observable effect in our atmosphere is ridiculous.
Does reducing CO2 concentrations over the oceans have an observable effect on their temperatures? If so, what are those observed values, quantified?
Imaginging … SebH giving an honest and sensible answer … is ridiculous.
Oh dear SebastianH, more hand-waving.
Unlike you I’ll give you a reference as I’ve searched for it. And yes it’s from some really educated people at NASA. So no it’s not MY CLAIM it’s theirs!
So squirm off and read the reference, bend it to your peculiar version of reality. But the take-away info is that the SUN controls our climate not some very, very rare atmospheric gas!
https://science.nasa.gov/science-news/science-at-nasa/2013/08jan_sunclimate .
As I’ve posted before, the TSI correlation with temp is just that, correlation, but it isn’t causation. They are, however, connected through other solar phenomenon, as Nils Axel Morner reveals in presenting data from Don Easterbrook (two scientists SebH says aren’t scientists).
https://www.youtube.com/watch?v=G4wov0kc3yg
Sire;u SebJ must have watched it when I posted it, so I’m sure he’ll understand it any day now. hahahahaha, just kidding.
“Fascinating, in other instances you claim that even a large change of something as small as the CO2 concentration can not have a big effect because the concentration is so small … and yet here you go and attribute “strong effects” to a large change of a very small part of the Sun’s radiative spektrum 😉”
It would be fascinating if you could show where and how CO2 this very minor, very rare gas has changed the planet’s temperature. Yes the atmospheric concentrations have changed minutely but the evidence for this doing anything but greening the planet is entirely absent. What is NOT happening with such a slightly upward change in atmospheric CO2 levels – no alarming sea levels rise, no alarming global temperature rise, not more or fiercer storms, and none of all the other alarming tales of woe from the cAGW advocates and their scaremongering.
On the other hand, the sun’s effects on the climate and weather are scientifically observed, even if they are not wholly understood.
And many observations have shown that we have recently had a solar peak, and now many scientists show that there’s solar descent into a probable significant minimum already starting.
If it continues as these scientist say then the weather will get more erratic as the cooler period makes it presence felt — history shows that during a solar minimum there are some hotter interludes with prolonged droughts, some very much wetter times with more storms, but overall it just gets colder, just like the history of the LIA, I hope this time it will not be as harsh. What is for sure is no amount of CO2 warming can modify it and certainly will not stop it, the sun commands it!
This tawdry CO2 sham is over, enjoy the cooling SebastianH it will be much tougher going from now on.
[…] Read more at No Tricks Zone […]
[…] Read more at No Tricks Zone […]
All reporting agencies agree there has been little or no sustained change in average global temperature since about 2002. CO2 has increased since 2002 by 40% of the increase 1800 to 2002 so if CO2 has any effect on temperature at all it can’t be very much.
https://pbs.twimg.com/media/Dv8kE26U0AEKfdY.jpg
Dan Pangburn,
Thank-you. And this shows yet again, that at levels of a few hundred parts per million of CO2 gas in our atmosphere does not have any significant effect on global temperature or our climate. CO2 just keeps the green plants going on our blue/green planet.
The sun controls how our climate changes, not the rare gas CO2.
[…] https://notrickszone.com/2019/01/22/munich-conference-leading-danish-astrophysicist-says-solar-activi… […]
[…] https://notrickszone.com/2019/01/22/munich-conference-leading-danish-astrophysicist-says-solar-activi… […]
[…] Whole story … […]