The Greenhouse Effect On Hiatus
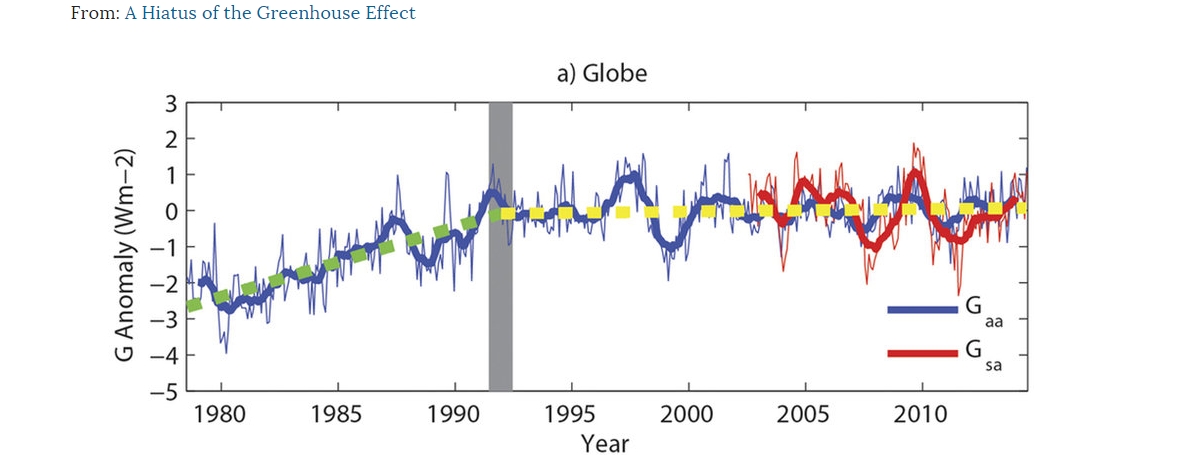
An unheralded but significant 2016 scientific paper – “A Hiatus in the Greenhouse Effect” – is now publicly available. It had previously been paywalled.
Scientists have found the greenhouse effect’s (GHE) influence on planetary temperatures went on “hiatus” during 1992-2014.
The estimated GHE radiative influence for these 22 years was a slightly negative -0.04 Wm-2 per year.
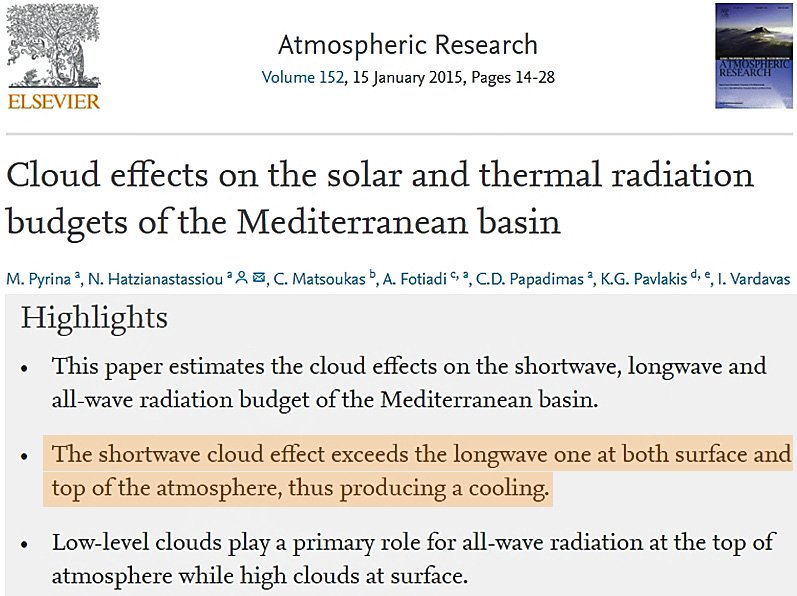
The reason why the GHE influence went on hiatus in recent decades is that (a) decadal-scale changes in cloud cover exert dominant radiative control in longwave forcing (GHE) efficacy, and (b) the shortwave effects of cloud cover changes override the radiative longwave effects, meaning that a decrease in cloud cover will allow more direct shortwave radiation to be absorbed by the Earth system, eliciting a net positive imbalance in the energy budget.
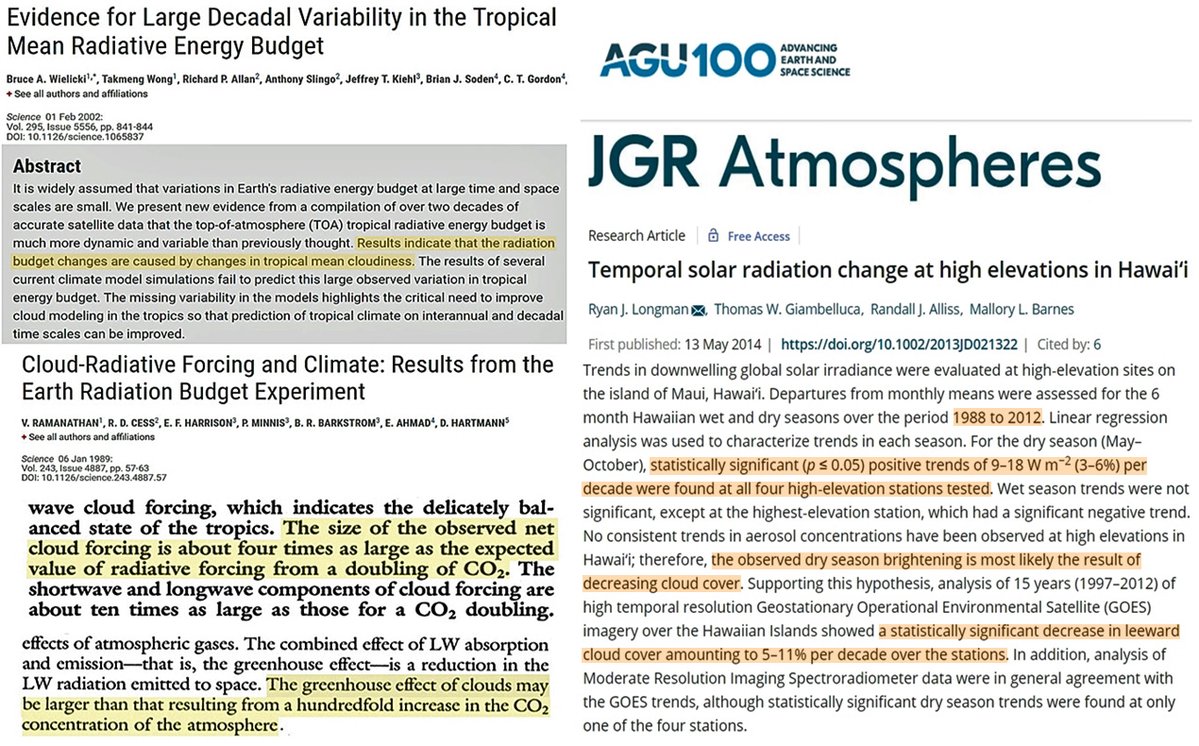
Image Source(s): Wielicki et al., 2002, Ramanathan et al., 1989, Longman et al., 2014
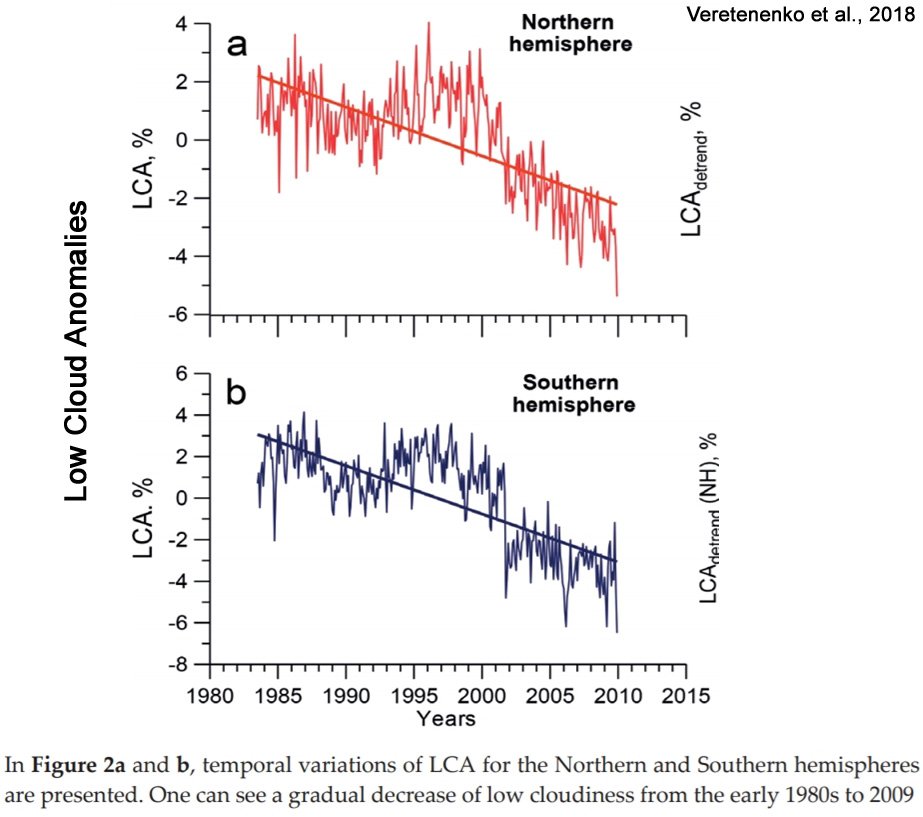
As a consequence, a decadal-scale reduction in cloud cover, which has been observed via satellite since the 1990s, effectively “offsets” or cancels out the GHE influence from gases such as water vapor and CO2.
“Overall, the downward tendency of clouds is the dominant contributor to the greenhouse effect hiatus.” (Song et al., 2016)
The implications for this analysis are profound.
During 1992-2014, the global CO2 concentration rose from 356 ppm to 398 ppm, an increase of 42 ppm.
If this level of CO2 enhancement within the GHE can be so easily “offset” by a decadal-scale decrease in cloud cover, then the climate’s sensitivity to CO2 concentration changes should be regarded as significantly less influential than climate models currently profess.
Indeed, if the climate’s sensitivity to CO2 is so expungeable that a small change in cloud cover can effectively wipe out the potential influence of over 100 gigatons of CO2 emissions, then modern efforts to mitigate CO2 emissions by transitioning to solar and wind power may therefore be not only ineffectual, but rather pointless.

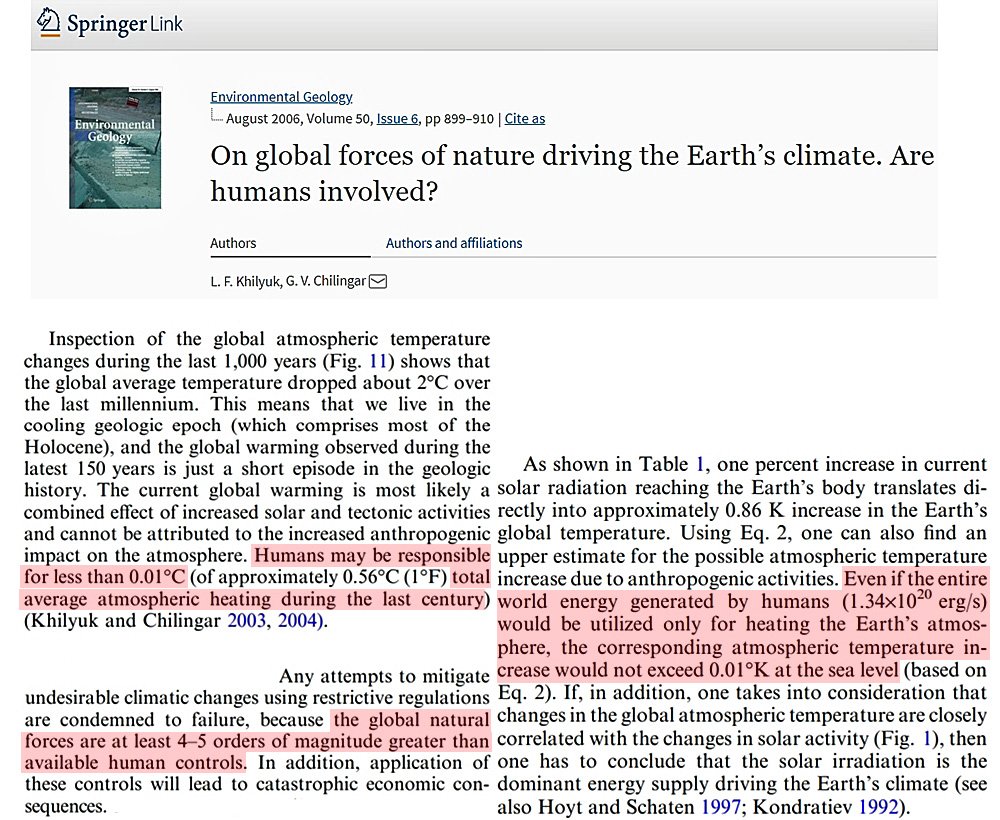
Image Source: Khilyuk and Chilingar, 2006


This Song paper hasn’t aged well …
Someone is completely forgetting ocean temperatures when continuously writing about a slowed down warming. I am also a bit confused why Kenneth is still behind a paper like this when it so clearly supports what science says the GHE is.
Anyway, there was no pause/hiatus. You can find the relevant studies and articles about why that is online. You don’t have to trust me on this (you wouldn’t anyway).
The last picture in this article is a joke, right? Scientist arguing that humans have little impact on warming because they would only increase the global atmospheric temperature by 0.01°K if all consumed energy were to be used to heat said atmosphere? This is almost Gerlich/Tscheuschner level of science. Remember when those two scientists wrote that peer-reviewed paper about why there is no GHE? Fun times when you brought that up all the time 😉
I forgot … so the claim is that the GHE weakend because cloud cover decreased (since the cloud cover is part of the GHE … water molecules in the air and so on). The author also says that there was a slow down in warming.
How does that fit with your (@Kenneth) usual assertion that the warming comes from increased solar radiation on the surface due to cloud cover decrease? On the one hand it’s calling a slow down and on the other hand it’s causing the warming?
Maybe you can enlighten us how that would work.
Oh, so now you forgot that the paper isn’t about a hiatus in warming. You just realized it’s about a hiatus in the radiative greenhouse effect. Does “forgot” in this context mean “I forgot to actually read what the article and paper and title and subtitle says”? How else could you have missed this if you actually did read the article/paper/title/subtitle? Apparently you see pictures and then go straight to the comments.
Um, because there was a warming between the early 1990s and 1998, which coincided with the reduction in cloud cover during this period. Had you read the article, you would have noticed that both the Longman et al. (2014) paper (1988-2012, +9-18 Wm-2 SW cloud forcing, tropical location) and the cloud cover reduction from the late 1980s/early 1980s in both hemispheres are consistent with this trend.
The warming occurred from the late 1980s to the late 1990s, then it leveled off/slowed down after that, consistent with what the IPCC calls the “hiatus” period.
“I forgot” means “I forgot to mention/ask”. But feel free to argue against strawmen … you have a lot of experience with that, don’t you 😉
Kenneth, how is it consistent to claim that a reduced cloud cover caused warming and a reduced cloud cover also compensated the warming from CO2 because we saw a slow down in warming?
I am confused now. First you mansplain to me that it’s about a hiatus of the effect, now it is a hiatus of the temperatures (warming leveled off)? How can a reduced cloud cover compensate for an increase in CO2 forcing when it – at the same time – would cause warming itself? If the cloud cover didn’t decrease further in the 21st century, how did it cause a hiatus in the GHE then?
I never claimed that reduced cloud cover “compensated the warming from CO2”. I wrote that the effects of SW cloud forcing – because it’s so dominant – wiped out the potential for the CO2/H2O GHE to influence planetary temperatures…because that’s what the paper says.
Yes, this must be so confusing for you. The hiatus in temperatures was not even discussed in the article. But I’ll explain it to you again.
Overall, during 1992-2014, there was a warming, with all or nearly all of that warming occurring during the 1992-1998 period, when the cloud cover declined rather precipitously. From 1998-2014, there was a slowdown/hiatus in the warming as the clouds began to level out some.
Here’s what that looks like: https://www.climate4you.com/images/HadCRUT3%20and%20TropicalCloudCoverISCCP.gif
Again, the warming/non-warming isn’t even what this paper is about. It’s about the hiatus in the greenhouse effect, and how clouds dominate the radiation budget in both SW and LW, overriding the effects of the GHGs.
Obviously you didn’t even bother to read more than the title – and then you apparently even misread/misunderstood that.
There is nothing in this article (or the paper it references) that discusses a hiatus or slow down in warming. It isn’t even about temperatures. As the title and subtitle of both the paper and the article and all the text within the article clearly spells out, this is an article and paper about a hiatus in the GREENHOUSE EFFECT and it’s radiative influence on planetary temperatures during 1992-2014.
The only explanation for this is, once again, you did not bother to do anything more than look at the pictures before you began writing. Would that be so hard?
In what? The greenhouse effect? According to the paper, the GHE/LW influence was -0.04 Wm-2/yr during 1992-2014. That would not appear to be an upward trend. But do tell why you think -0.04 Wm-2/yr is not a pause/hiatus (assuming you understand what this means).
Yes, it does clearly support what the science says the GHE is. And that’s why someone who does more than just look at the pictures would find it a little contradictory to claim that CO2’s influence on the 1992-2014 warming was exceptional and profound when the CO2 GHE was completely wiped out by the reduction in low cloud cover, allowing the SW cloud radiative forcing influence to dominate the energy budget change during this period.
This would be problematic for those who understand the implications.
I am guessing that you have never read Gerlich/Tscheuschner’s detailed reply to their critics. You just went with the flow of people trying to explain to professional mathematical physicists that they did not understand the basics of their own specific field.
A blind man’s trust in other blind men is no trust at all.
Not only has SebastianH not read the reply (link and abstract below) to their “critics” (who effectively just made up positions G&T09 never postulated and then proceeded to knock down those made-up viewpoints – a practice SebastianH is well-versed in himself), he’s likely not done more than just skimmed a few pages of the original work – if he did that at all. SebastianH is a believer. He’s unwilling to even consider that his beliefs are not “basic physics”. There is no headway that can be made with someone whose mind is so closed.
Gerlich and Tscheuschner, 2010
https://arxiv.org/pdf/1012.0421.pdf
“It is shown that the notorious claim by Halpern et al. recently repeated in their comment that the method, logic, and conclusions of our “Falsification Of The CO2 Greenhouse Effects Within The Frame Of Physics” would be in error has no foundation. Since Halpern et al. communicate our arguments incorrectly, their comment is scientifically vacuous. In particular, it is not true that we are “trying to apply the Clausius statement of the Second Law of Thermodynamics to only one side of a heat transfer process rather than the entire process” and that we are “systematically ignoring most non-radiative heat flows applicable to Earth’s surface and atmosphere”. Rather, our falsification paper discusses the violation of fundamental physical and mathematical principles in 14 examples of common pseudo-derivations of fictitious greenhouse effects that are all based on simplistic pictures of radiative transfer and their obscure relation to thermodynamics, including but not limited to those descriptions (a) that define a “Perpetuum Mobile Of The 2nd Kind”, (b) that rely on incorrectly calculated averages of global temperatures, (c) that refer to incorrectly normalized spectra of electromagnetic radiation. Halpern et al. completely missed an exceptional chance to formulate a scientifically well-founded antithesis. They do not even define a greenhouse effect that they wish to defend. We take the opportunity to clarify some misunderstandings, which are communicated in the current discussion on the non-measurable, i.e. physically non-existing influence of the trace gas CO2 on the climates of the Earth.”
“Overall, the downward tendency of clouds is the dominant contributor to the greenhouse effect hiatus.” (Song et al., 2016)
Indeed as shown here https://isccp.giss.nasa.gov/analysis/climanal1.html (click on the first image ‘CLOUD AMOUNT’ on the left-hand side).
The enlarged image of ‘CLOUD AMOUNT’ does indeed show that from about 1988 to 2000 the cloud amount fell, from 2000 onward the cloud cover has gradually rose up until about 2002. From 2002 onward it’s just stalled at the about the same level just below the zero line of ‘Anomalies and Deviations’.
I note that this correlates with Hoyt & Schatten, 1993 (updated by Scafetta & Willson, 2014) graph shown at https://notrickszone.com/2019/03/25/satellite-evidence-affirms-solar-activity-drove-a-significant-percentage-of-recent-warming/ .
Now why would increased solar activity (up to about 2001) cause the clouds to reduce globally?
The assertion that clouds have a small warming effect reinforces my suspicion. So they prevent some of the cooling that might transpire with lower solar activity. The “Greenhouse Effect” is neither here or there as far as anybody knows for sure.
These guys are right on the ball.
There were no cluds prior to 1992 and there has been nothing but clear skies since 2014.
I’m here to discuss my new discovery of the non-radiative heat transfer process explained from the laws of physics for the first time anywhere in world literature in my paper “Planetary Core and Surface Temperatures” published in 2013 and then summarised in my book in 2014: http://whyitsnotco2.com.
Facts? What facts? Why bother to even read the post?
Gotta do that, you’ll be in the dark if you don’t.
Question: How did water get here on earth?
Hydrogen and oxygen, not too difficult to see two elements there, what the two become, water, is something that never could be imagined by some tiny, puny human brain bouncing around inside a cranium that is usually solid bone to the core. lol
Nevertheless, water it is. One thing about water: There is a lot of it.
When the sun’s rays reach the earth, the earth’s oceans are going to warm, there is just too much water at the surface covering too much surface area, when it all warms from the heat produced at the sun, the source of the heat, changes occur. You’re going to have evaporation, then condensation, then the atmosphere has these two elements, nitrogen and oxygen, trapped gases from gravity alone, which then can turn everything crazy, like the earth takes crazy pills, clouds then form. It is amazing stuff, call it the greenhouse effect. The air is going to warm, the sun will do it, guaranteed. Just too much water, makes it all happen like no other phenomena can.
The earth is at water overshoot, happened a long time ago. lol
If the earth did not have a molten core, it would a frozen globe from the Tropic of Capricorn to the South Pole and from the Tropic of Cancer to the North Pole. Maybe not that, but something like that.
One trip to Jellystone Park will provide ample evidence that the earth has hotspots.
There was plenty of CO2 in the air back in 1986 at Lake Nyos in Africa.
The source of the CO2 was not anthropogenically sourced, however.
The heat from the sun reaching the earth’s surface with all of that water from pole to pole makes a world of difference.
If it were all ice, you’ll have places like Lake Missoula all over again.
4.5 billion years of heat from the earth’s molten core is going to speak volumes for where some of the heat content, the budget, belongs.
For those interested in Climate (or ‘Climate Change™) here a link to an old book on the latest research in 1905 of climate. Called Climatic Changes: Their Nature and Causes by Huntington and Visher it is freely available at http://www.gutenberg.org/ebooks/37855 . And yes CO2, terrestrial variations, solar variations, and stellar effects are discussed. Remarkably modern considering its age.
Kenneth you are absolutely right about Se BasH. He doesn’t read the article.
A few post back he start to lecture me, that zero % greenhouse gases is impossible. But the article says 1.Thou shall roll back greenhouse gases to zero by 2050! Proof for me he doesn’t read. Why, if he is so sure, that global warming is real, climate change is real, greenhouse gases are real and man is causing all of this, is he not reading the articles here but does he has to bash everybody and everything that is written here. I think he better can be ignored and let him believe what ever he wants to believe. Unless of course you like to ‘discuss’ with him to entertain everybody.
Hey Se BasH, here is one for you. Found online, so you will believe it.
See what nearly 1 degree Celsius can do! You will love it!
https://www.aljazeera.com/news/2019/03/climate-change-impacts-accelerating-wmo-report-190329084310932.html
Little off topic but here is some thoughts about “greenhouse” gases radiative effect on the atmosphere’s (and surface) temperatures :
Look at the [Kiehl & Trenberth 1997] Earth energy budget diagram (the [NASA 2009] diagram gives roughly the same data) :
– it shows that in the infrared spectrum, the net radiative flux between the surface and the atmosphere is 26W/m² and is upward. So we can assume that greenhouse gases absorb at most 26W/m² from the upward radiative flux emitted by the surface (this value is consistent with [Kondratyev 1969] p. 747).
On the other hand, according to this diagram, the atmosphere radiates 165W/m² into space in the infrared spectrum.
Questions :
1) Does the atmosphere behave as a black (or gray) body or do we have to take into acount each absorption / emission band of each atmospheric component in order to correctly take into acount its infrared radiative properties (see [Modest 2003], [Kondratyev 1969]) ?
2) What atmospheric components other than “greenhouse” gases are able to emit 165W/m² into space in the infrared spectrum ?
3) What is the net radiative effect of “greenhouse” gases on the atmosphere’s temperatures ?
4) What is the net effect of “greenhouse” gases combined with convection on the Earth’s surface temperatures ?
Enjoy !
🙂
References :
– [Kiehl & Trenberth 1997]:
http://www.cgd.ucar.edu/cas/abstracts/files/kevin1997_1.html
– [NASA 2009]:
https://earthobservatory.nasa.gov/ContentFeature/EnergyBalance/images/atmosphere_energy_balance.jpg
https://earthobservatory.nasa.gov/ContentFeature/EnergyBalance/images/global_energy_budget_components.png
– [Modest 2003]: M. Modest 2003, Radiative Heat Transfer (chapter 10 : Radiative properties of Molecular Gases).
– [Kondratyev 1969]: K. YA. Kondratyev 1969, Radiation in the atmosphere.
Why bother arguing over the red herring of the Kiehl & Trenberth 1997 cartoon? It’s nonsense! Just a distraction from the topic.
Enjoy yourself 🙂
I haven’t worked through all of this yet, but what I have makes sense.
https://objectivistindividualist.blogspot.com/2018/06/a-summary-of-some-of-physics-errors-of.html
There are lots of errors in the warmist approach to the energy budget.
Maybe the little professor will enjoy that. 😉
A few more goodies from that applied physicist
https://objectivistindividualist.blogspot.com/2018/12/posts-evaluating-earth-energy-budget.html
Cutting to the essence …
But less disregard those important items and just look at what Kiehl & Trenberth 1997 cartoon says…
We have on the left-hand side solar energy incoming from the Sun causing 342W/m² of thermal flux.
Well sure, the Sun is a source of energy, and is represented in the diagram as an incoming thermal flux. This sun powered by a large nuclear reactions which lots of liberate energy.
And then we have on the right-hand side energy incoming from “greenhouse gas backradiation”.
There’s 168 + 67 = 235W/m² absorbed thermal flux coming from the Sun…, and then there’s 324W/m² coming from the atmosphere, 38% more thermal flux than from the Sun. It just magically appears over there, on the right-hand side of their diagram. Can that ever be correct?
Where does the backradiation find the energy to make more thermal flux than came from the Sun?
It comes from the warmed surface. Warmed by 168W/m² from the sun but somehow now can radiates 350W/m²!
Where does the additional energy to causes more thermal flux that warms the surface come from?
It comes from backradiation!
Where does the backradiation get its energy from?
It comes from the warm surface. … etc., etc.
However in the Kiehl & Trenberth 1997 cartoon does not show temperature, or energy, but heat flux, a quantity that has direction and a magnitude, and so it is a vector quantity (https://en.wikipedia.org/wiki/Heat_flux). When adding vector quantities both direction and a magnitude must be properly evaluated, straight addition is not possible (back to the classroom with https://www.physicsclassroom.com/class/vectors/Lesson-1/Vector-Addition ).
It’s well known these models are poor at showing clouds and precipitation, a couple more items these models fail at —
Not good at modeling pressure changes —
https://www.sciencedaily.com/releases/2018/10/181016132032.htm
The findings raise serious questions about the accuracy of regional climate projections in the UK and neighbouring parts of Europe because meteorological conditions in those regions are closely linked to air-pressure changes over Greenland.
https://www.nature.com/articles/s41598-019-41334-7
Uncertainty in hydrological analysis of climate change: multi-parameter vs. multi-GCM ensemble predictions …
These models aren’t accurate enough to be the basis of changing the fundamental economics of the world.
I do not care if the planet warms up or gets cold.
Man adapts
I’ll take warm please. Spent enough time in the cold.
[…] by K. Richard, March 28, 2019 in NoTricksZone […]
[…] https://notrickszone.com/2019/03/28/scientists-the-co2-greenhouse-effect-was-cancelled-out-by-clouds-… […]
[…] https://notrickszone.com/2019/03/28/scientists-the-co2-greenhouse-effect-was-cancelled-out-by-clouds-… […]
Of course the model can’t see a hiatus because they’re tune to force too much warming with rising CO2. This is known as this shows —
https://agupubs.onlinelibrary.wiley.com/doi/full/10.1029/2018EA000401
[my bold]
@tomO
👍👍👍👍👍