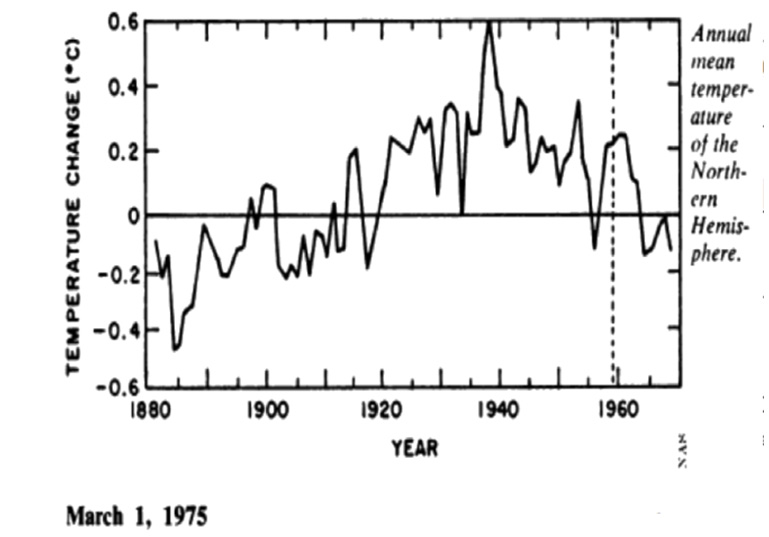
Image Source: National Academy of Sciences, Understanding Climatic Change
About 45 years ago, the “consensus” in climate science (as summarized by Williamson, 1975) was quite different than today’s version.
1. The Medieval Warm Period was about 1°C warmer than present overall while the “largely ice-free” Arctic was 4°C warmer, allowing the Vikings to navigate through open waters because there was “no or very little ice” at that time.
2. The island of Spitsbergen, 1237 km from the North Pole and home to over 2000 people, “benefited” because it warmed by 8°C between 1900 and 1940, resulting in 7 months of sea-ice free regional waters. This was up from just 3 months in the 1800s.
3. Central England temperatures dropped -0.5°C between the 1930s to the 1950s.
4. Pack-ice off northern and eastern iceland returned to its 1880s extent between 1958 and 1975.
5. In the 1960s, polar bears were able to walk across the sea (ice) from Greenland to Iceland for the first time since the early 1900s. (They had somehow survived the 7 months per year of sea-ice-free waters during the 1920s-1940s).
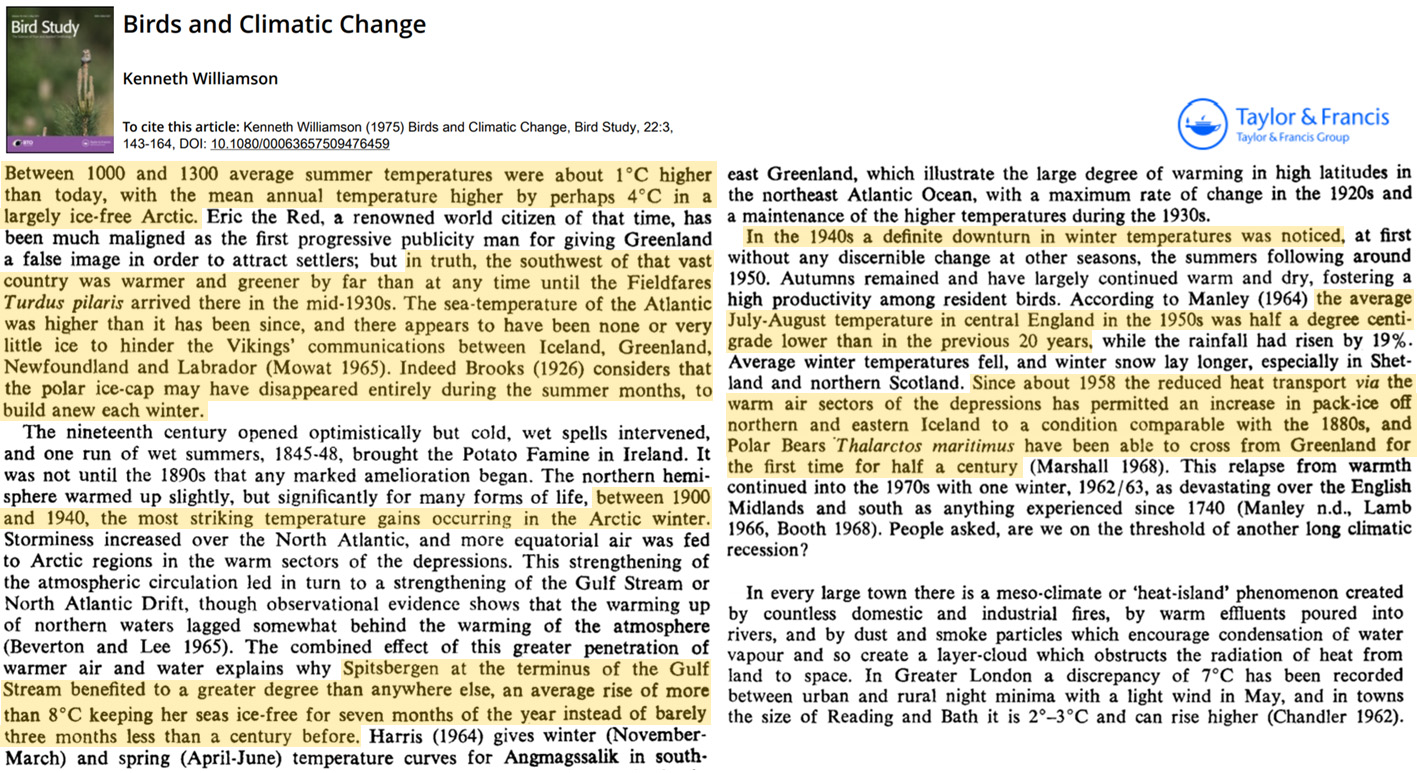
Image Source: Williamson, 1975
As of the mid-1970s, the “consensus” among climate scientists was the globe had warmed by +0.6°C from 1880 to 1940, and then cooled by -0.3°C (to -0.4°C) from 1940 to 1970.
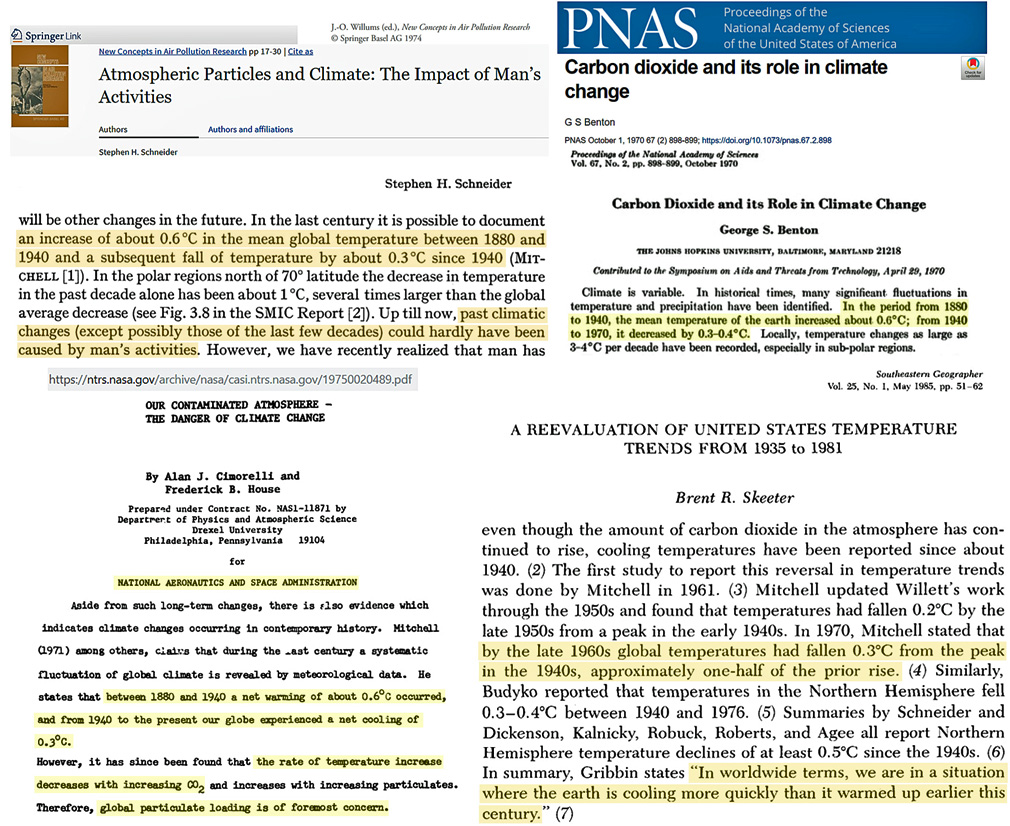
Schneider, 1974, Benton, 1970, Cimorelli and House, 1974, Skeeter, 1985
As recently as 1980, it was still acceptable to publish scientific papers saying the Northern Hemisphere alone had warmed by 1°C between 1880 and 1940 and then cooled by nearly the same amount during the next 3 to 4 decades.
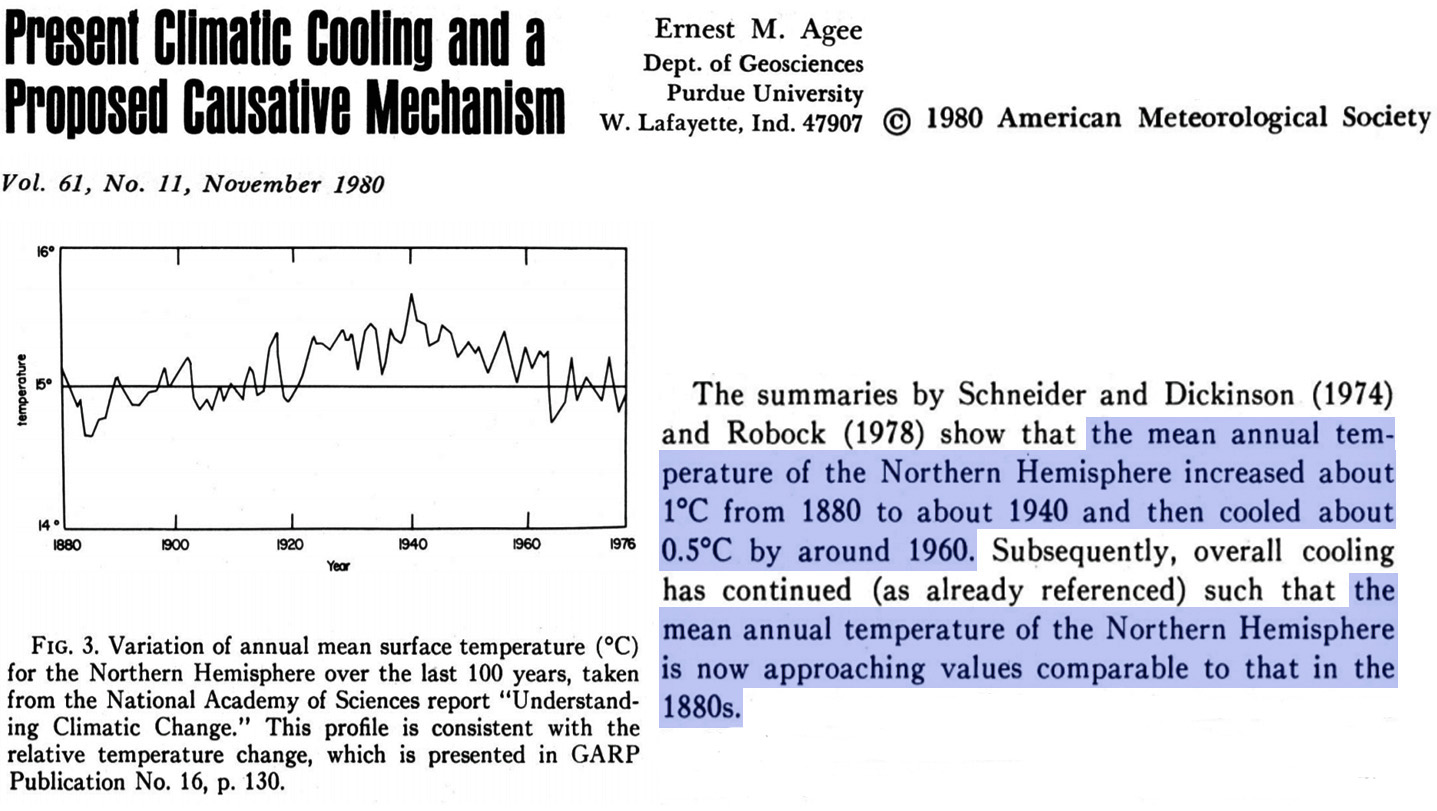
Image Source: Agee, 1980
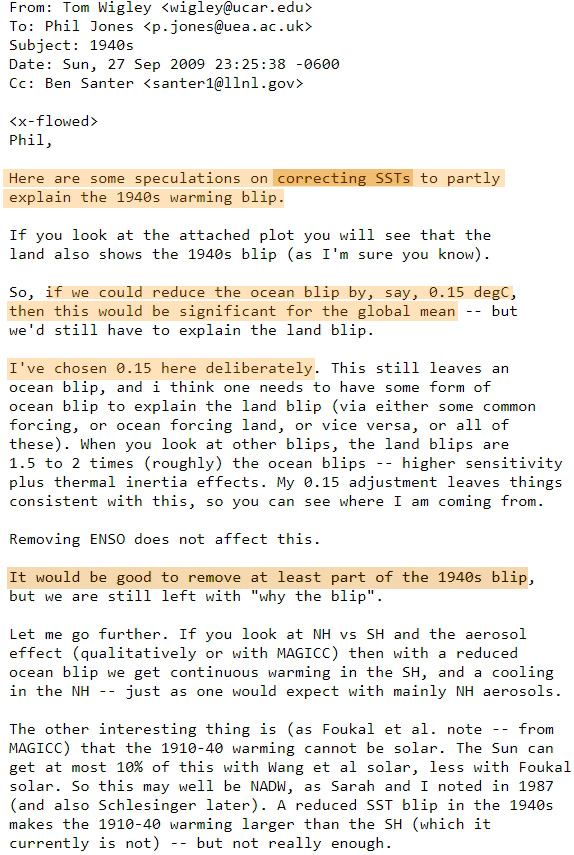
During the 2000s, climate scientists with a keen interest in shaping global temperature data sets (Tom Wigley, Phil Jones, Michael Mann, Gavin Schmidt, Stefan Rahmstorf) exchanged e-mails about “correcting” the temperature data by removing warming from the 1940s “blip” – which they said would be “good” and significant for the global mean because the 1940s were “too warm” .
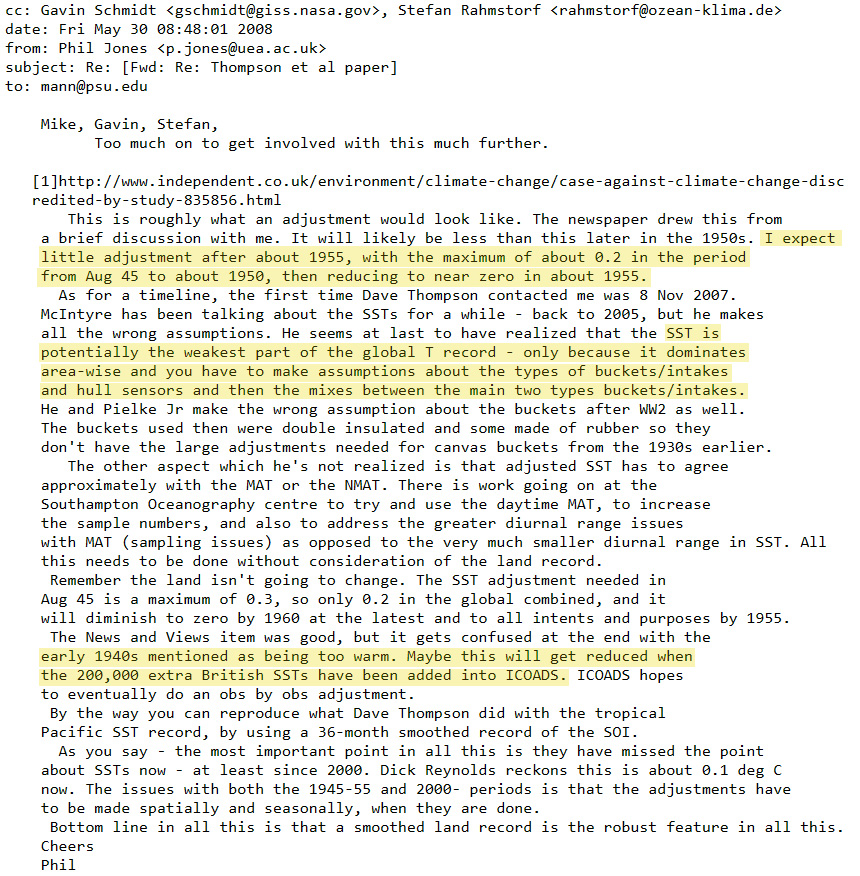
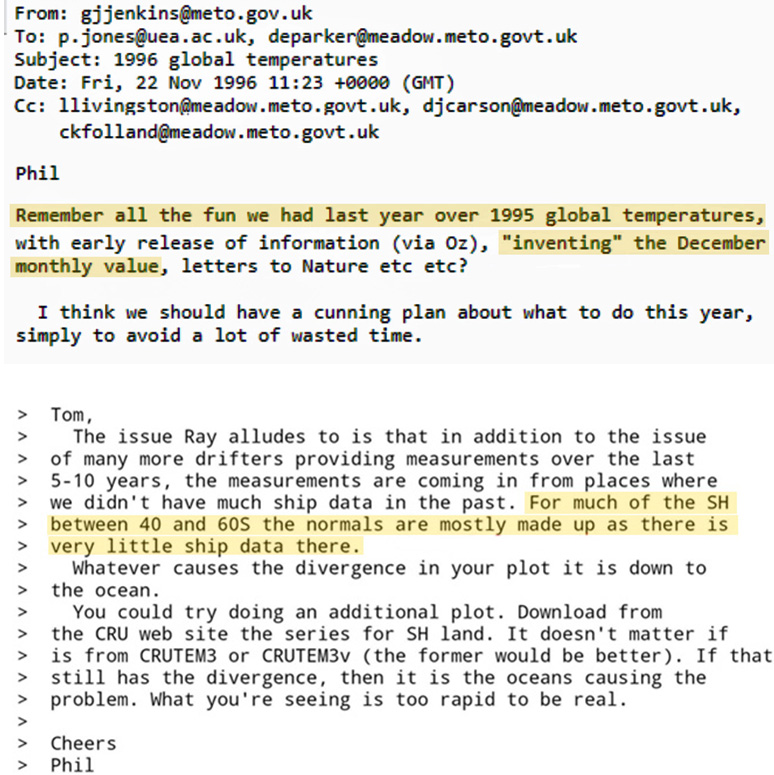
Phil Jones, overseer of HadCRUT temperature data, admitted the pre-1980s sea surface temperatures in the Southern Hemisphere are “mostly made up” due to insufficient coverage. He also corresponded with a colleague about “inventing” monthly temperature anomalies – which apparently was “fun” to do.
Phil Jones even wrote to his colleagues about changing temperature data so as to support the “argument” that the cooling decades coincided with the timing of a rise in anthropogenic aerosol emissions.

Apparently as a consequence of “corrections” to the temperature data, the amplitude of the 1880 to 1940 warming trend has been slashed from +0.6°C (1970s) to +0.1°C today.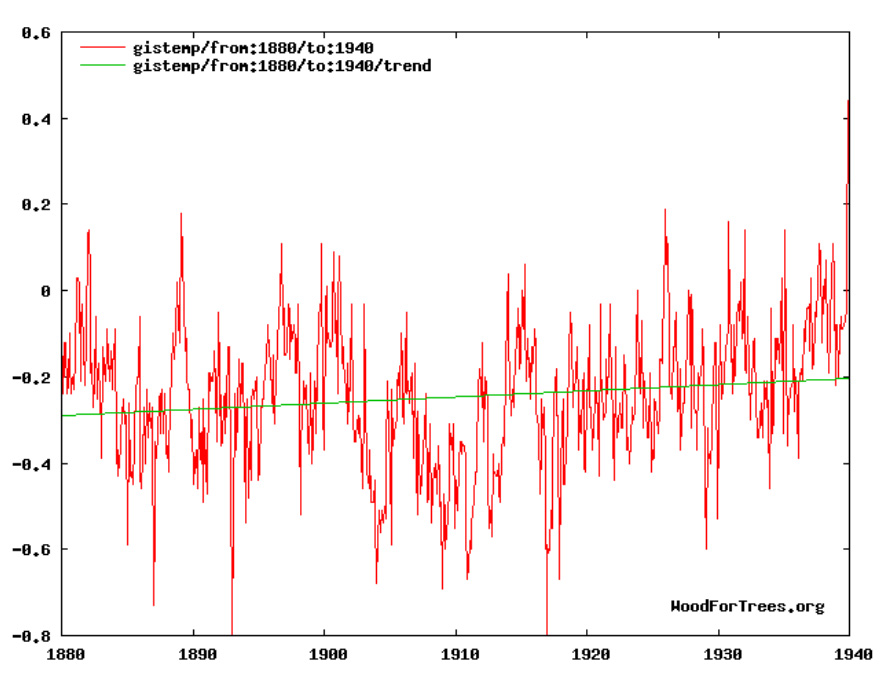
Image Source: WoodforTrees.org
The 1940 to 1970 global cooling has been transformed into a -0.05°C hiatus.
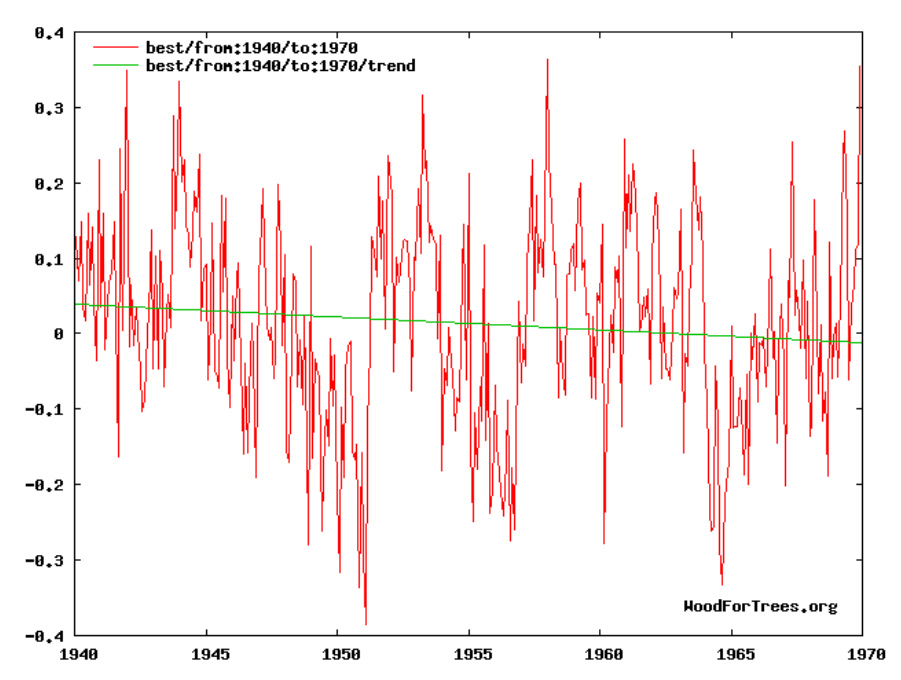
Image Source: WoodforTrees.org
Apparently over 80% of the amplitude of an inconvenient warming or cooling trend can be eliminated from temperature data sets 50-80 years after the original temperatures were recorded.


The upper graph looks like N Hemisphere, from the title.
The lower WFT graphs look like GisTemp, which I believe is global.
Correct. The NH was said to have warmed 1°C between 1880-1940 (Agee, 1980) per the article. The globe warmed by 0.6°C, meaning the SH warming was much more modest (even though the SH SSTs are “mostly made up” for that era).
Excellent work as usual, Kenneth. I have one question though. 3 of the 4 papers that state there was a global warming of 0.6 deg C from 1880-1940 followed by a cooling of 0.3 deg C from 1940-1970 cite J.M. Mitchell’s temperature dataset (apparently from his 1961 study, then his 1972 study, linked below) as their source. Benton doesn’t cite his source.
So I’m wondering – do we know if GISTEMP and HADCRUT showed the same trend changes during these periods as Mitchell’s dataset? If so, that would be even more damning, as it would strengthen the evidence for a consensus regarding the 1880-1970 trend changes.
https://nyaspubs.onlinelibrary.wiley.com/doi/abs/10.1111/j.1749-6632.1961.tb50036.x
https://www.cambridge.org/core/journals/quaternary-research/article/natural-breakdown-of-the-present-interglacial-and-its-possible-intervention-by-human-activities/DE2D651E56017AD5EA6647BCD5F90510
[…] Now Kenneth Richard, 25th July 2019, has taken on, at NOTRICKZONE, to clarify a few facts. The whole title is: “1970s: Earth Warmed 0.6°C From 1880-1940 And Cooled -0.3°C From 1940-1970. Now It’s 0.1°C And -…“ […]
[…] https://notrickszone.com/2019/07/25/1970s-earth-warmed-Zero-6c-from-1880-1940-and-cooled-Zero-3c-fro… […]
[…] https://notrickszone.com/2019/07/25/1970s-earth-warmed-0-6c-from-1880-1940-and-cooled-0-3c-from-1940… […]
[…] K. Richard, July 25, 2019 in […]
Why are you using Gistemp in the first graph and BEST in the second graph?
A claim which the BEST graph would not support:
http://www.woodfortrees.org/plot/gistemp/from:1880/to:1940/trend/plot/best/from:1880/to:1940/trend
A claim which the Gistemp graph would not support:
http://www.woodfortrees.org/plot/gistemp/from:1940/to:1970/trend/plot/best/from:1940/to:1970/trend
I also like you approach to holding up the conspiracy theory angle. I also find it funny that you post those e-mails as images that look like scanned printouts as if they weren’t digitally available anywhere 😉
Anyway, the raw data is available … feel free to use it with your own adjustments or justify why you instead want to use it unadjusted.