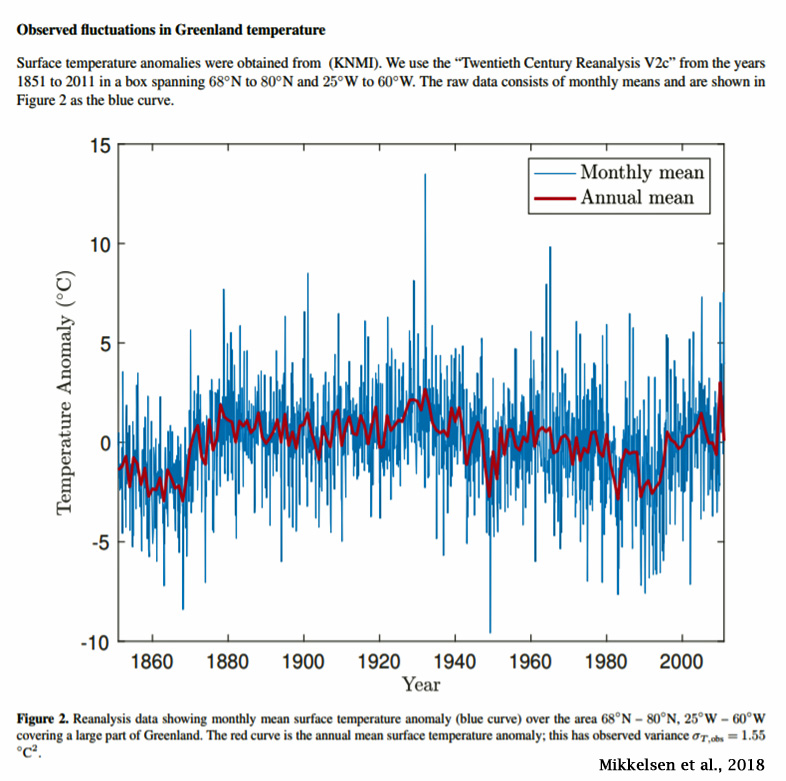
For over 40 years (1961-2002), the Greenland ice sheet cooled, thickened, and gained mass just as anthropogenic CO2 emissions were sharply rising.

Image Source: Mikkelsen et al., 2018
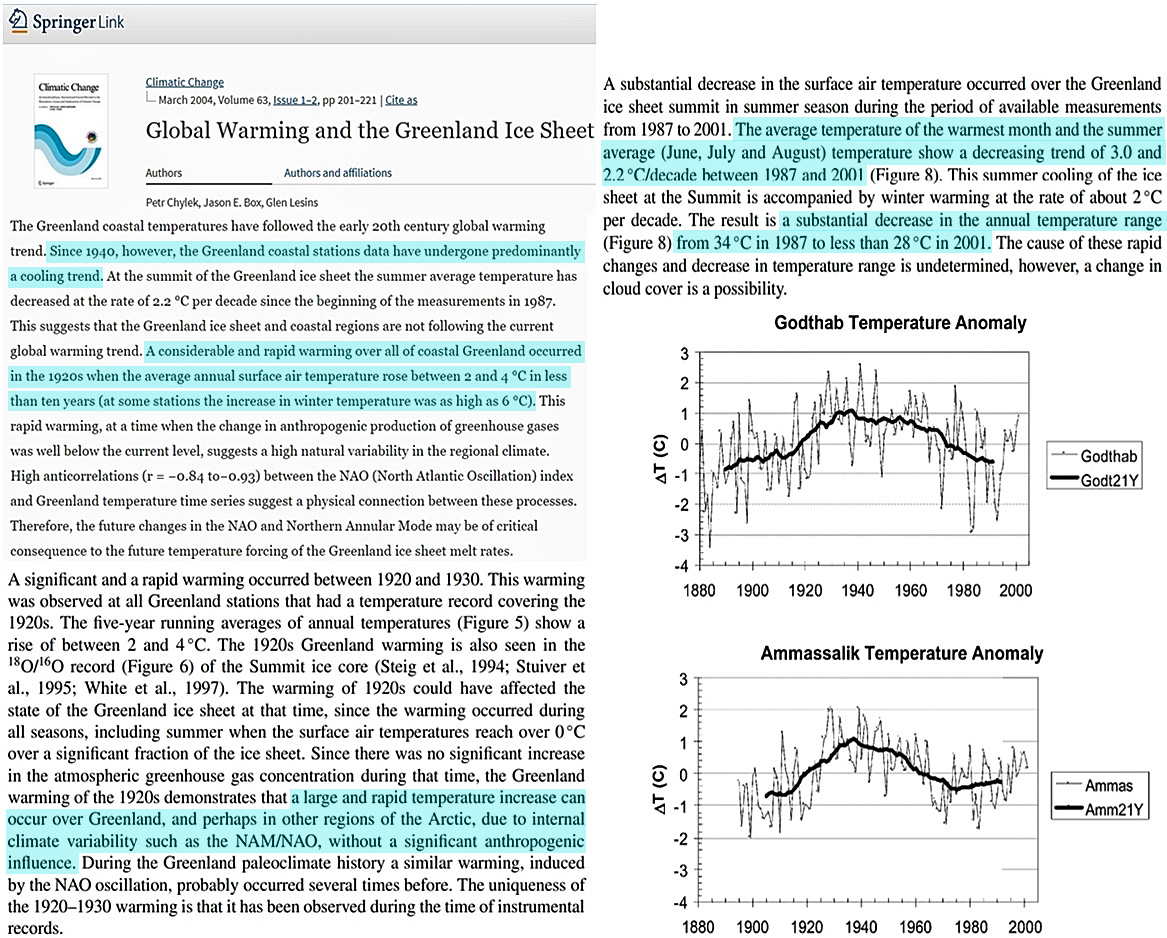
According to Greenland ice sheet instrumental records, there was a dramatic cooling trend during summer months from the late 1980s to early 2000s (Chylek et al., 2004).
“The average temperature of the warmest month and the summer average (June, July and August) temperature show a decreasing trend of 3.0 and 2.2°C/decade between 1987 and 2001.”

Image Source: Chylek et al., 2004
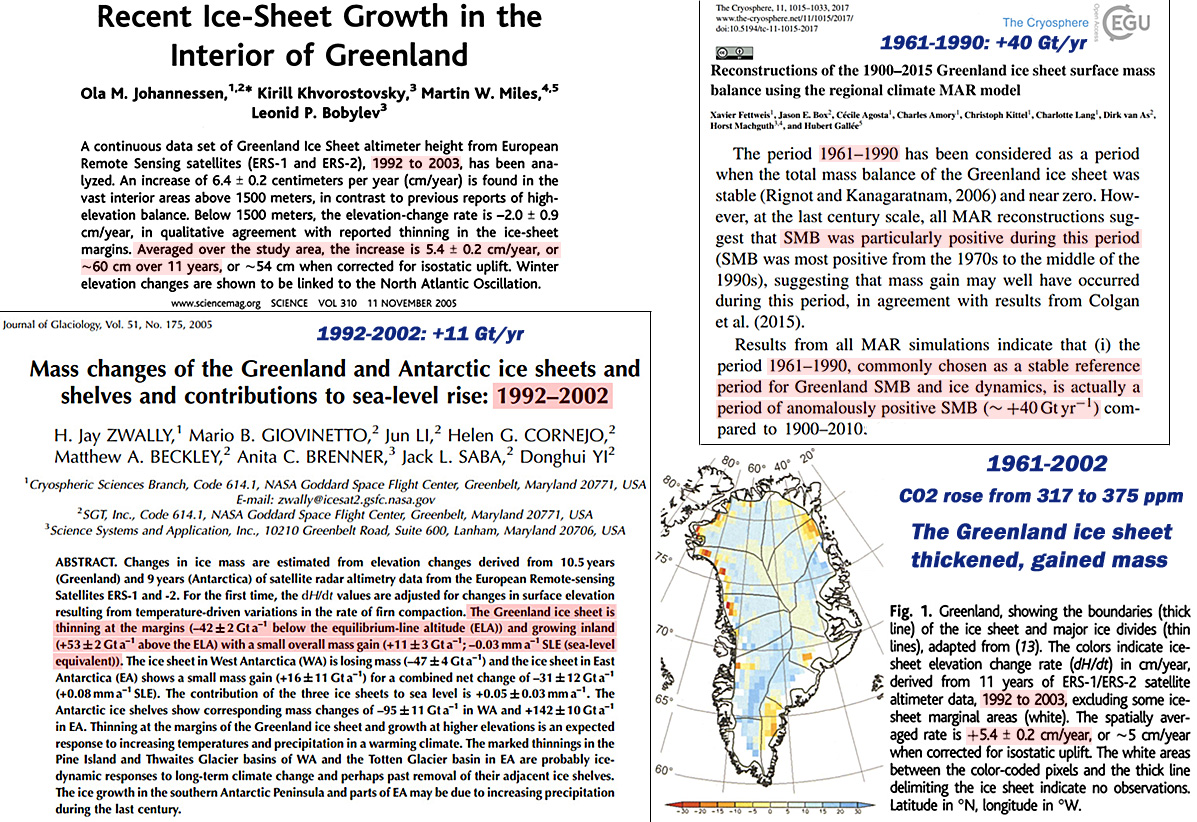
Greenland had been gaining +40 Gt of ice per year during 1961-1990 (Fettweis et al., 2017).
Coincident with the cooling, the ice sheet was still thickening and gaining mass – +11 Gt (gigatons) per year – as recently as 1992-2002 (Zwally et al., 2005).
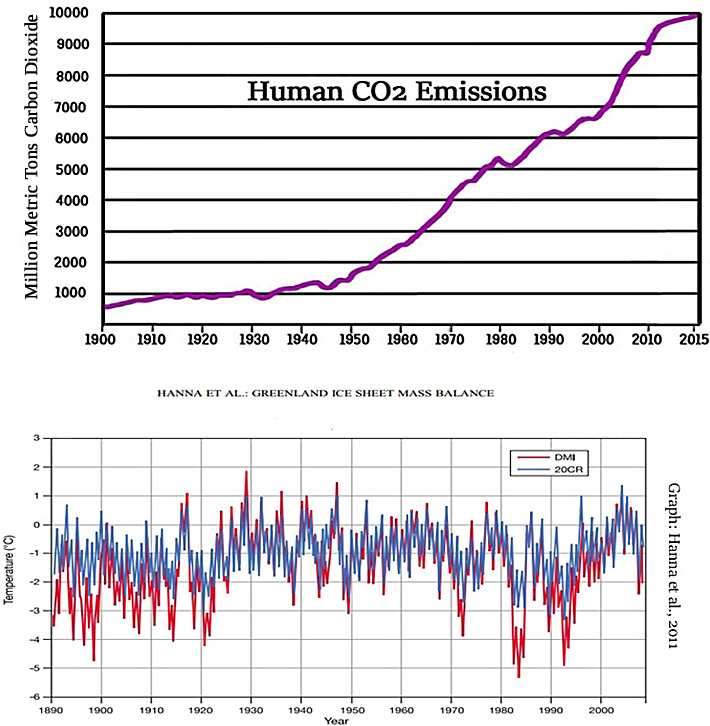
Annual anthropogenic CO2 emissions rates tripled during this 41-year period, and atmospheric CO2 rose by nearly 60 parts per million (317 ppm to 375 ppm).

Image(s) Source: Johannessen et al., 2005, Zwally et al., 2005, Fettweis et al., 2017
After 2002, the Greenland ice sheet began losing mass as the ice sheet temperatures warmed.
This warming and mass loss trend have often been attributed to the rise in CO2 emissions by those promoting anthropogenically-driven global warming (AGW).
But if rising CO2 emissions are the causal mechanism for the post-2002 warming and mass loss, why did the Greenland ice sheet cool and gain about 1.35 trillion metric tons of ice for the duration of 41 years as CO2 emissions rates tripled from ~2.5 GtC/yr (gigatons of carbon per year) to ~7.5 GtC/yr?
Succinctly, why would an ice sheet both lose and gain mass as CO2 rises?


clear as spring water.
[…] Fonte: No Tricks Zone […]
Novarupta was a whale of a volcano that erupted back in 1912. No doubt impacted the atmosphere in one way or another. The eruption would have influenced the weather for a while.
One metric ton of water will occupy one meter cubed.
100 km x 10 km x 1 km is the volume needed to have one trillion metric tons of water/ice.
100,000 meters by 10,000 meters by 1000 meters will be one trillion cubic meters.
62 miles by 6.2 miles by 0.62 miles, not much of Greenland’s land area to have the extra 1.35 trillion metric tons of compacted snow and ice.
Doesn’t take long to add a couple of hundred feet of snow to the ice sheet.
Even more important: CO2 emissions tripled.
Yet CO2 in the atmosphere did not.
https://youtu.be/b1cGqL9y548
There is something wrong with graph showing annual Carbon emissios from 1900 to 2015 ,second up from bottom in this article. The vertical axis goes from 0 to 10000 and the label on sayes it is Gigatons C. I suspect it is a factor of 1000 to high and actually meant to be megaton. A typograph error perhaps???
No, it’s Gigatons of Carbon, or GtC.
https://www.esrl.noaa.gov/gmd/outreach/behind_the_scenes/gases.html
Yes and on the graph you link to in the above comment the vertical axis is labeled Gigaton of carbon and goes from zero to 10 , not zero to 10000 as on the graph you show in the article, either you meant and the vertical axis labels to be from 0.000 to 10.000 and accidentally dropped a period ,or made some other mistake when preparing it , like f.x, using the numbers from the CDIAC webstite table which gives emission numbers for the period from 1751 to 2014 in million metric tons (or megatons ~ not gigatons ) of carbon and and give the estimate for the year 1900 as 534 ( = 0.534 Gtc) and for 2014 as 9855 million metric to which is 9.855 GtC not 9855 GtC. But nevermind the reason for it the vertical scale on the graph in the article is 3 order of magnitudes ( = 10³ = 1000 ) to big as i was pointing out.
Yes, I think it should be corrected, at lest with a update if not on the graph itself.
The graph has now been corrected to “million metric tons carbon dioxide”. Thank you for pointing this out.
Hero’s of the past
Rise up! as
ARCHANGELS
https://www.youtube.com/watch?v=dJ-QLl5qjLg
“Succinctly, why would an ice sheet both lose and gain mass as CO2 rises?”
Maybe it’s because the amount of CO2 in the atmosphere is NOT a function of how much human’s emit but a function of how warm the SST (Sea surface Temperature) is for a give pCO2 (partial pressure of CO2) between the ocean/atmosphere interface.
As the sun provides the vast majority of thermal energy to the planet then the global average temperature, and in large part the SST is dependent on the sun’s activity. As solar activity declines the planet gets cooler (both atmospherically and eventually the SST) and the CO2 fraction in the atmosphere goes down and CO2 dissolved in the oceans goes up.
CO2 levels follow the sun’s activity, when the sun is active the CO2 levels will eventually rise, when the sun’s activity declines the atmospheric CO2 levels naturally decline over time.
At no time does CO2 provide significant atmosphere warming.
[…] https://notrickszone.com/2019/10/31/co2-emissions-tripled-during-1961-2002-as-greenland-cooled-and-g… […]
[…] https://notrickszone.com/2019/10/31/co2-emissions-tripled-during-1961-2002-as-greenland-cooled-and-g… […]
[…] CO2 Emissions Tripled During 1961-2002 As Greenland Cooled And Gained 1.35 Trillion Metric Tons Of I… […]