Dr. Ludger Laurenz
The sun has left its signature in data from numerous weather stations, thus challenging meteorologists and climate researchers who falsely claim the sun plays only a minor role.
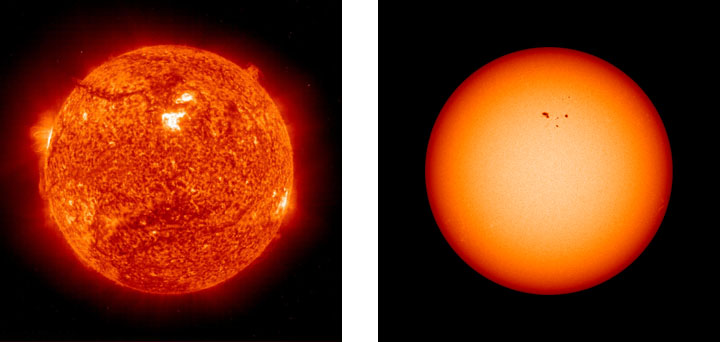
Image: NASA Earth Observatory (public domain).
In the 11-year sunspot cycle (Schwabe cycle), the sun generates a start impulse in the sunspot maximum year. Triggered by this start impulse, recurring weather patterns are found in each cycle for about 10 years beginning with the sunspot maximum.
There is a detection of the solar signal if the beginning of the solar cycle is set a5t the year of the sunspot maximum.
I reported on this at Die kalte Sonne blog here. Using climate data from numerous German weather stations, I have verified a solar imprint. An example is the monthly precipitation amount in Feldberg in the Black Forest, see Figure 1.
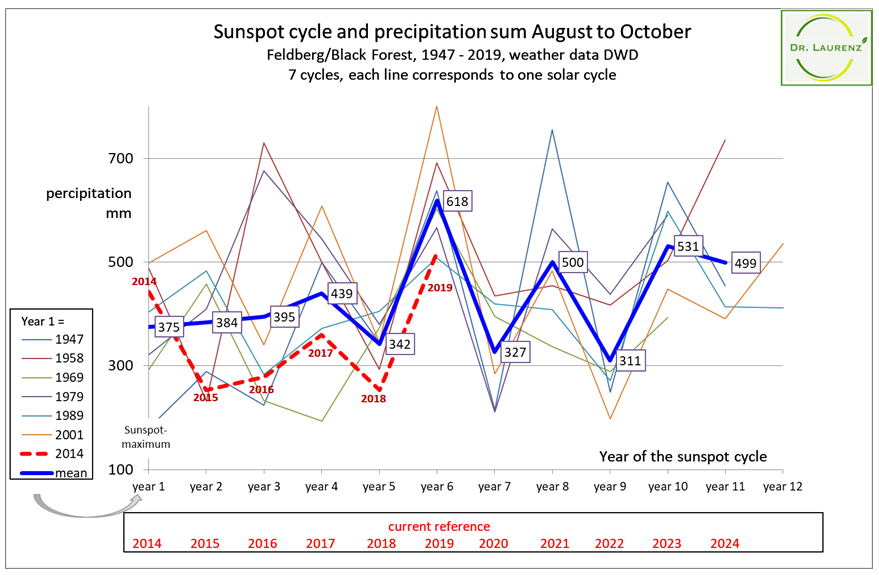
Figure 1: Feldberg/Black Forest. Plot of August to October precipitation amount vs sunspot cycle. Image: Laurenz
The precipitation curves run in a saw tooth pattern. They change annually between an upper and lower level. In phases, all curves run parallel. This parallelism is obviously due to a solar impetus in the year of the sunspot maximum. At times, the curves run in opposite directions, maintaining the up and down trend. This curve could also be influenced by the sun, with delay times varying from year to year and from cycle to cycle. The solar pattern of Feldberg vs rainfall amount in late summer/autumn is detectable at most weather stations along the Rhine River up to the North Sea Islands and Great Britain.
According to previous evaluations, globally solar signals are more likely to appear in the mid-latitudes and less so in the tropics. The signals are by no means always as clear as in the Black Forest. Often they are only detectable in one to three years of the solar cycle, and during one, two or three months of the year. Solar signals are also found in temperature and sunshine duration data, but not as clearly and frequently as in precipitation data.
In the future, a trend forecast going out several years will be possible, but only for periods that have parallel curves. This will be explained using the precipitation data from Des Moines, Iowa, as an example, see Figure 2:

Figure 2: May to August precipitation amount vs sunspot cycle. Des Moines, Iowa. Chart: Laurenz
In Des Moines, the solar signal only becomes visible in cycle years 8 and 9. A trend forecast for 2020 is very uncertain and not possible. In the summer of 2021 (cycle year 8) above-average rainfall is expected, in summer 2022 below average. This “precipitation swing” is directly related to the ENSO dynamics in the Pacific, see Figure 5.
The Quasi Biennial Oscillation (QBO) generates saw tooth curves in many weather trends
The QBO is a “wind stream” located 20 to 40 kilometres above the equator. In it, the wind direction changes about every 2 years, from west-east to east-west. The time of the wind direction change in the QBO is driven by the sun, see Figure 3. During the sunspot maximum year, the QBO’s wind direction at 20 to 25 kilometers altitude, i.e. in the zone of highest ozone concentration, is east-west in each cycle.
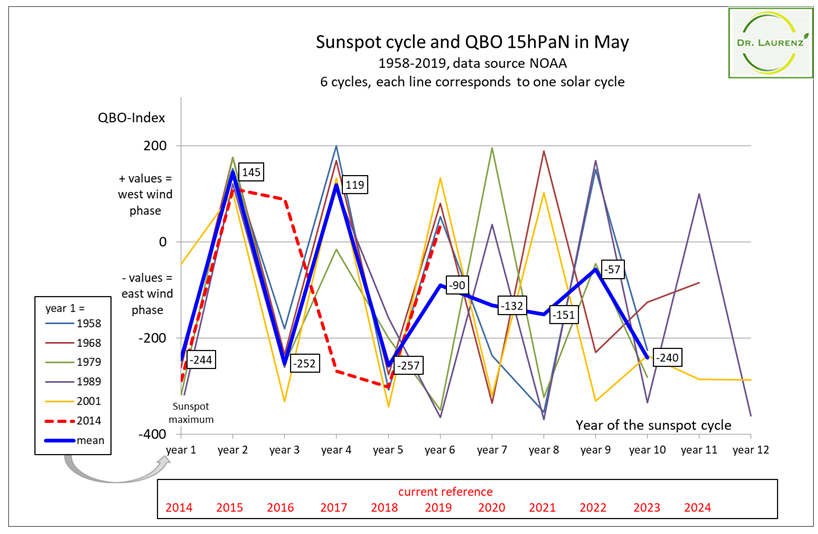
Figure 3: QBO vs solar cycle in May, at approx. 25 kilometers above the equator. Chart: Laurenz
As with the precipitation data from Feldberg in Figure 1, the QBO index curves bounce up and down between an upper and lower level. During the first five years of the solar cycle the curves with data from 20 to 25 kilometers altitude run in sync in almost all months of the year, obviously triggered by the sun’s drive in the year of the spot maximum. From cycle year 6 onward, phase shifts cause non-synchronized saw tooth curves.
The course of the current cycle curve (red dotted line) deviates in cycle years 3 and 4 from the trend of previous cycles. It is possible that the solar signal in sunspot maximum year of 2014 was not strong enough to align the wind direction in the QBO in the same direction for several years as in the previous stronger sun cycles due to an extremely low sun spot count.
The jagged wind direction pattern of the QBO shown in Figure 3 is transferred to tropospheric wind currents with the procession of high and low pressure areas that influence our weather.
Solar signals from the stratosphere to the Pacific
The solar signal can be detected in all zones of the atmosphere and at the ocean surface. The temperature profile in the stratosphere is shown in Figure 4.
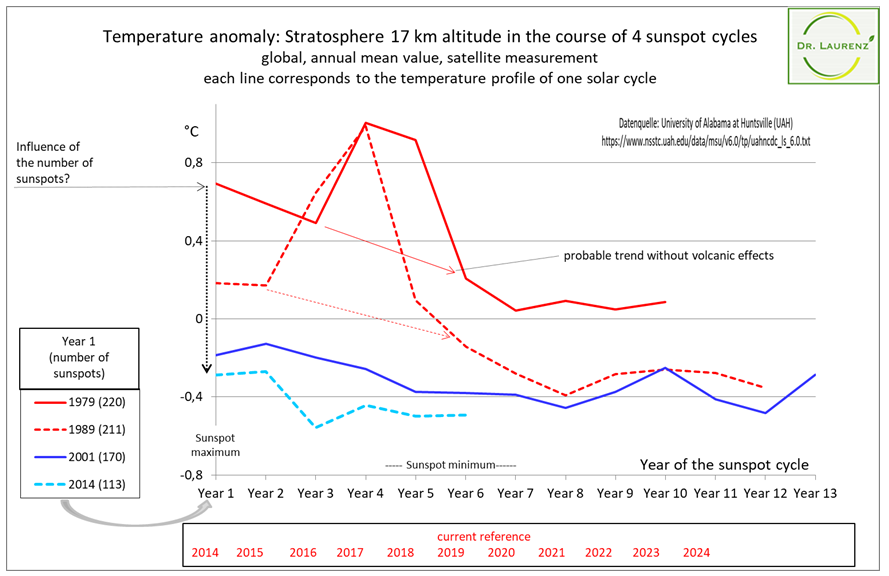
Figure 4: Solar cycle and temperature anomaly, stratosphere, 17 kilometers altitude. Chart: Laurenz
There is a strong correlation between the number of sunspots and the temperature level of the respective cycle. In the first two cycles (red) volcanic effects are to be assumed.
The solar signal is also visible in the temperature trend of the equatorial Pacific or in the Multivariate ENSO Index (MEI), see Figure 5.
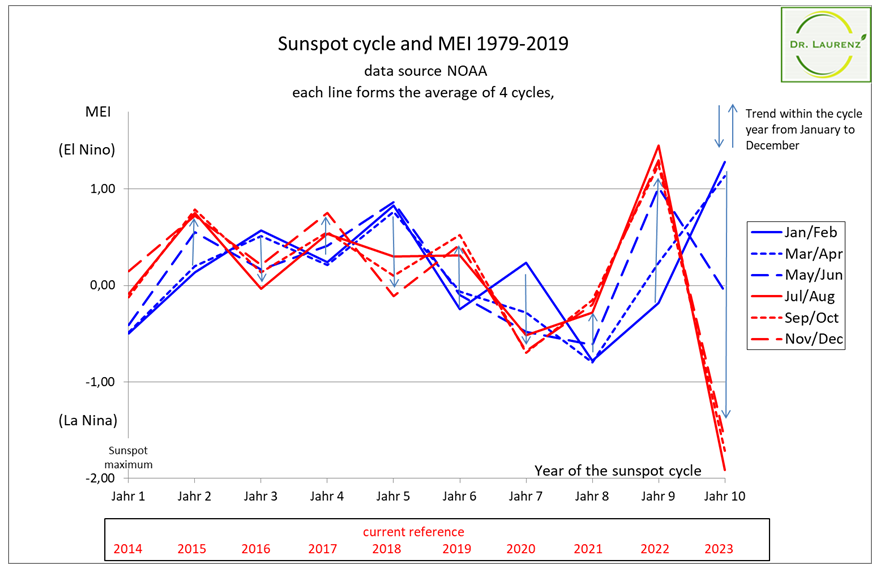
Figure 5: Solar cycle and MEI, 1957 to 2019, in 6 two-month periods. Chart: Laurenz.
The mean value curves of the 4 solar cycles follow a systematic trend. In each of the 4 cycles the strongest El Nino event is in cycle year no. 9, the strongest La Nina event in year 10.
Summary
In the 11-year solar cycle (Schwabe Cycle) the sun generates a start impulse in the sunspot maximum year. Triggered by this start impulse, the data show recurring weather patterns in each sunspot cycle for about 10 years beginning at the sunspot maximum. The solar signal is detectable if the beginning of the solar cycle is taken to be at the year of the sunspot maximum.
Using this, the signals of the Schwabe Cycle from the stratosphere, oceans and the weather trends can be detected without gaps. Solar amplifiers such as UV/ozone dynamics and the interaction between solar activity, cosmic rays and cloud formation have been understood and known for a long time. What is new is the extent to which this amplification impact the weather trends.


[…] über Independent Researcher Finds Solar Schwabe Cycle Signal: Reoccurring Weather Patterns Every 10 Years… […]
Big deal. What the climate’s sensitivity to incoming solar irradiation, dT/dS?
That’s what matters.
Again, what is dT/dS?
[…] Against Mold and Rising Seas Increased step count may reduce death risk from heart disease, cancer Independent Researcher Finds Solar Schwabe Cycle Signal India BANS export of anti-malaria drug touted by Trump as potential Covid-19 cure India’s […]