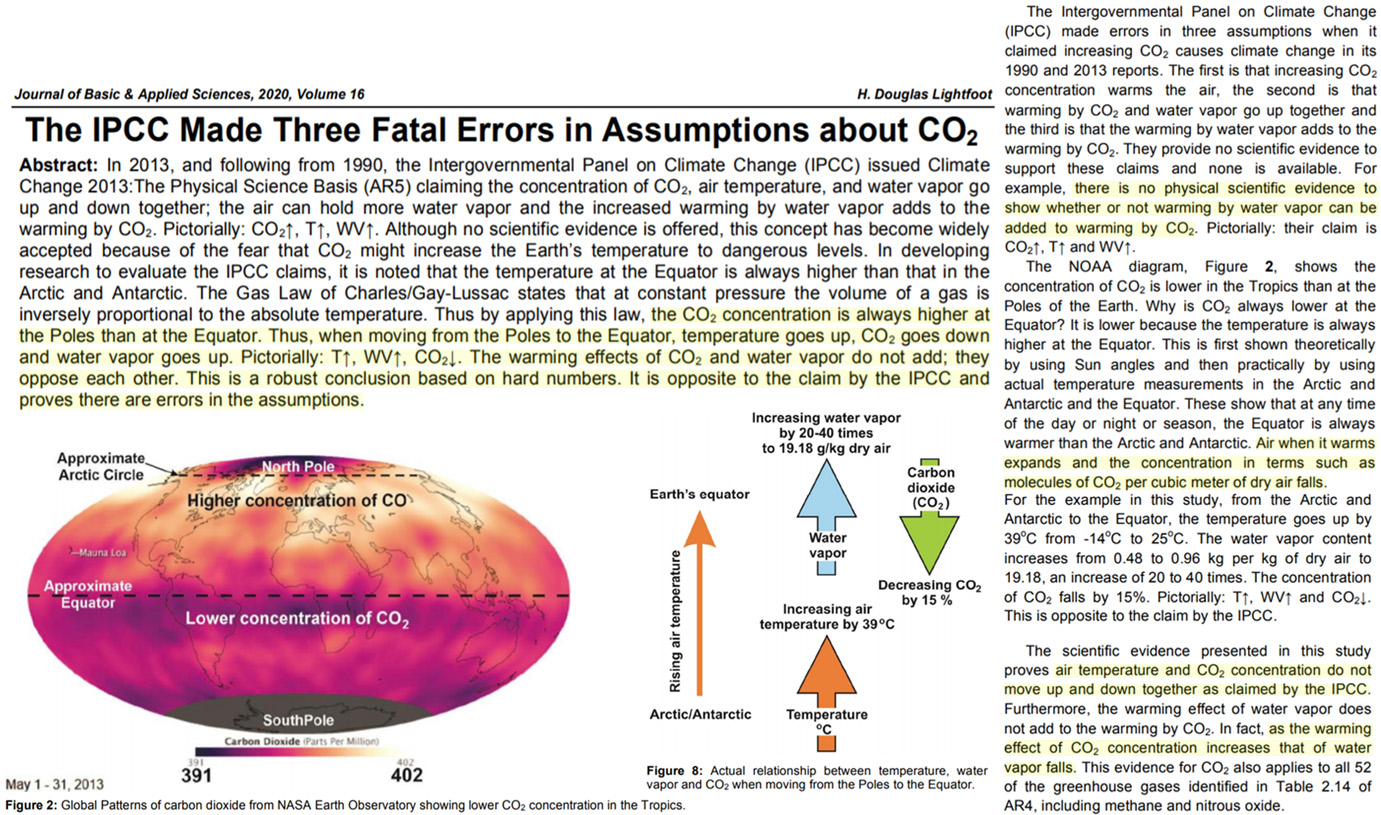
CO2 is higher at the Poles than at the Equator. When air warms, CO2 goes down and water vapor goes up. The warming effects of CO2 and water vapor do not add; they oppose each other. This is opposite IPCC claims.
The IPCC claims doubling CO2 from 280 ppm to 560 ppm over the course of several centuries produces a warming of 1.2°C on its own (IPCC TAR). Since this is not enough to induce catastrophic warming or propel CO2 mitigation policies, IPCC models suggest water vapor perpetually rises along with CO2 and warming, and this rising positive water vapor feedback drives this initial 1.2°C warming up to 3°C, 4°C, and beyond.
The problem with this hypothetical model is that observational evidence fails to corroborate it.
A new paper (Lightfoot, 2020) shows that the claims (a) CO2 and air temperature go up and down together, (b) CO2 and water vapor go up and down together, and (c) warming by water vapor can be added to that of CO2 to give enhanced warming are all not observed to occur in the real world.
Instead, when air warms, CO2 falls as water vapor concentrations (40,000 ppm in the tropics, <1,000 ppm at the poles) rise. Again, this fundamentally contradicts IPCC claims.

Image Source: Lightfoot, 2020
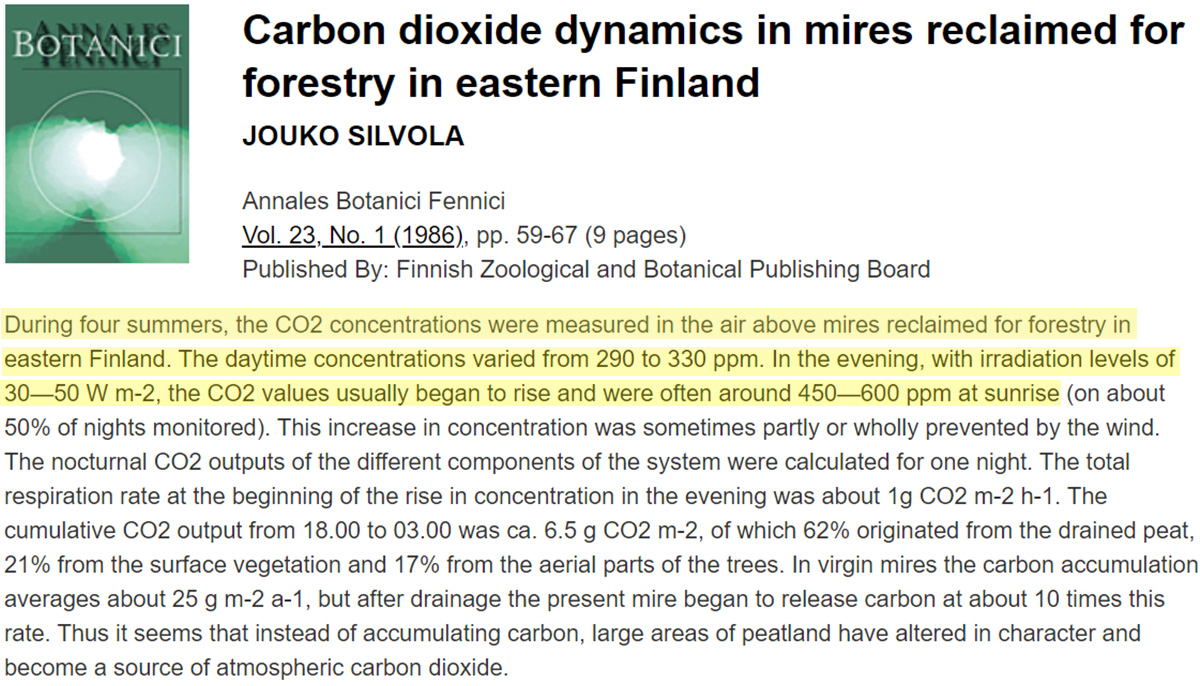
The phenomenon of CO2 falling as temperatures rise can be witnessed throughout the world. The author documents the consistently lower CO2 levels at the equator vs. at the poles and cites the Gas Law of Charles/Gay-Lussac to explain how this works physically. But the CO2-falls-as-air-warms phenomenon could also be witnessed in 24-hour periods in forests or tree-covered areas, where CO2 rises from around 300 ppm in the warmth of the afternoon to over 600 ppm before sunrise, when it is cooler (Fennici, 1986).

Image Source: Fennici, 1986
If CO2 falls as water vapor concentrations rise, there can be no perpetually-rising water vapor feedback or catastrophic CO2-induced global warming. As Lightfoot concludes:


The analysis is overly simplistic, insofar as it is the physical kinetics of mass transfer of CO2 to water that fix the rates of dissolution of CO2 to water.
Certainly the CO2 concentration in the air around a forest is higher in the morning than the afternoon – plants respire mostly at night, rather than during the day
In a mofette field, where plant respiration isn’t a thing, as temps rise by 10°C in the morning, CO2 falls from 750,000 ppm to 1,000 ppm.
This still misses the point of CO2 residency time in the atmosphere. Even a cursory internet search shows that 100+ year residency did not become a thing until the computer models said it was needed for CAGW. Prior to that, when no one had a vested interest in CAGW it was ten years. Using ten years, the CAGW models fell apart.
Funny how CO2 residency times magically changed to be the exact number needed by CAGW computer models to create a crisis.
http://euanmearns.com/the-residence-time-of-co2-in-the-atmosphere-is-33-years/
Who’s going to tell Pippi Långstrump?
🙂
Whoa, I misread that at first… I read it as “as temperature increases, CO2 negatively convects, whereas water vapor convects”. The hamster wheel in my mind spun up for a bit on that one. LOL
You might want to emphasize in the text that you’re addressing atmospheric concentration of CO2, not translational mode movement.
Error! “… at constant pressure the volume of a gas is inversely proportional to the absolute temperature”. Wrong. The volume is proportional to the absolute temp. However, the concentration will be inversely proportional when the gas expands. Thus, the findings should still be correct.
The paper is corrected. Here is the link: http://www.thelightfootinstitute.ca/imglib/IPCC-3-errors-CO2.pdf
Roger Pielke Senior noted this in studying upper air soundings over North America, and posted this on his blog in 2007. “Towards a robust test on North America warming trend and precipitable water content increase”
http://pielkeclimatesci.files.wordpress.com/2009/10/r-337.pdf
This is the journal reference citation: Wang, J.-W., K. Wang, R. A. Pielke Sr., J. C. Lin, and T. Matsui (2008), Towards a robust test on North America
warming trend and precipitable water content increase, Geophys.
Res. Lett., 35, L18804, doi:10.1029/2008GL034564.
Quotation: IPCC models suggest water vapor perpetually rises along with CO2 and warming, and this rising positive water vapor feedback drives this initial 1.2°C warming up to 3°C, 4°C, and beyond.
The official conclusion about the TCR and ECS per the IPCC is like this (AR5, p. 1110 and p. 1112: “ECS determines the eventual warming in response to stabilization of atmospheric composition on multi-century time scales, while TCR determines the warming expected at a given time following any steady increase in forcing over a 50- to 100-year time scale. TCR is likely in the range 1°C to 2.5°C, close to the estimated 5 to 95% range of CMIP5 (1.2°C to 2.4°C; see Table 9.5).
So, stop talking about the ECS. It is only for scaring people. The value of 1.2 C per the IPCC is due to CO2 only and TCR includes positive water feedback.