Over the US, the modest change in cloud cover from 1996-2019 predominantly drove the +11.77 W/m² surface solar radiation forcing during 1996-2012 (then -2.35 W/m² from 2013-2019). These “brightening” and “dimming” magnitudes easily overwhelm the values associated with an annual 2 to 2.5 ppm rise in CO2 forcing (0.2 W/m² per decade).
When cloud cover changes by even a percentage point or two from one decade to the next, the magnitude of the associated forcing can be compared directly to the impact of rising CO2 concentrations. And in a new study, Augustine and Hodges (2021) point out:
“Documented magnitudes of brightening are significant and much larger than the projected increase in downwelling longwave radiation (LW↓) expected for a doubling of CO2 since industrial times (~4 W/m²)”
Translated, the total projected forcing associated with a doubling of the CO2 concentration since 1750 (280 ppm to 560 ppm) is only 3.7 W/m² (Seinfeld, 2008).
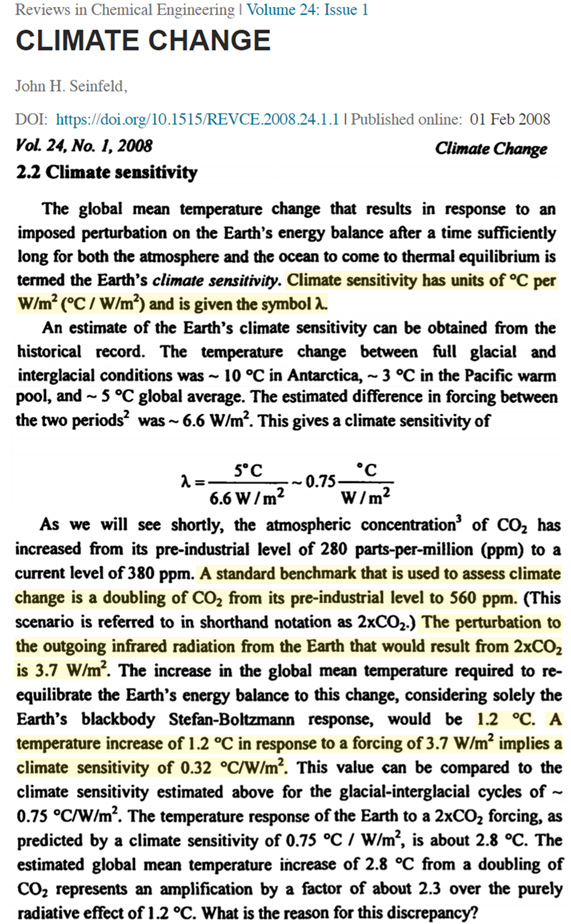
Image Source: Seinfeld, 2008
On a per-decade basis, a 22 ppm rise in CO2 – realized about every 10 years in recent decades – is associated with a forcing of just 0.2 W/m² (Feldman et al., 2015), but only when the sky is clear of clouds. And cloud-free skies are rarely ever observed in the real world atmosphere, as “less than 10 percent of the sky is completely clear of clouds at any one time” (NASA, 2015).
![]()
Image Source: Feldman et al., 2015
In stark contrast to these radiative forcing magnitudes from CO2 changes, small changes in cloud cover can explain 62% of the +11.77 W/m² increase (1996-2012) and -2.35 W/m² decrease (2013-2019) in surface solar radiation over the continental US in the last 20-25 years (Augustine and Hodges, 2021).
Another 3% of the recent brightening/dimming trends over the US are explained by aerosol forcing. And, interestingly, even this forcing is said to be about 3 to 4 times larger than that of the CO2 impact. The 0.05 reduction in aerosol optical depth from 1997-2019 “corresponds to a direct radiative forcing of +1.59 W/m²” (Augustine and Hodges, 2021).
Across Europe, other scientists have suggested the magnitude of surface solar radiation forcing was +10 W/m² per decade from the 1930s to 1950s, -13 W/m² per decade from the 1950s to 1980s, and then +10 W/m² per decade from the 1990s to 2000s.
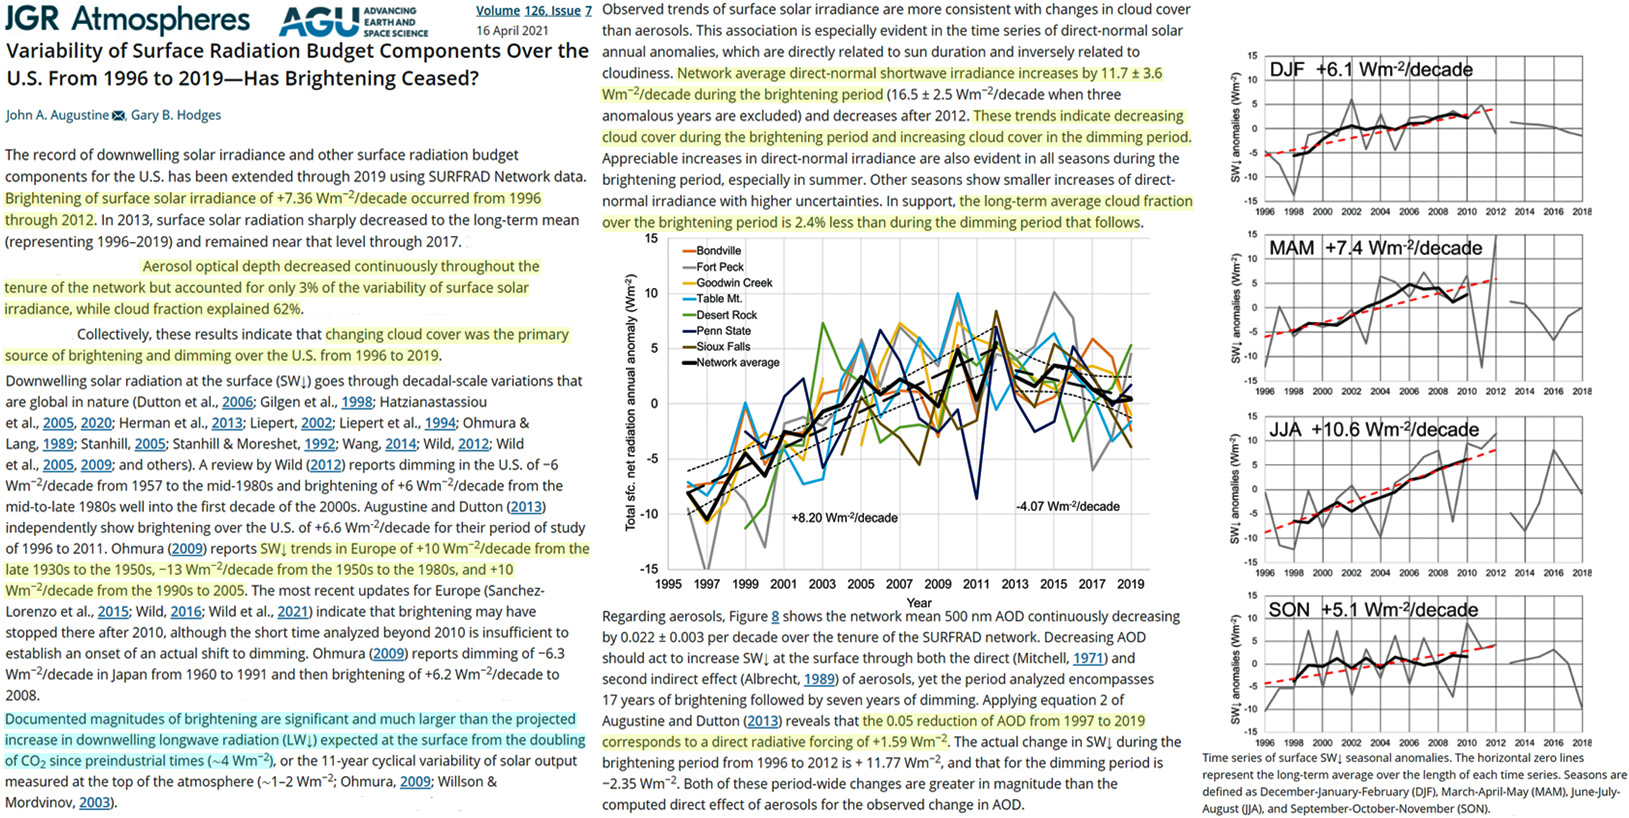
Image Source: Augustine and Hodges, 2021
Across Brazil, another new study (Zuluaga et al., 2021) indicates the decline in cloud cover has resulted in about a +3 W/m² per decade forcing since 1980.
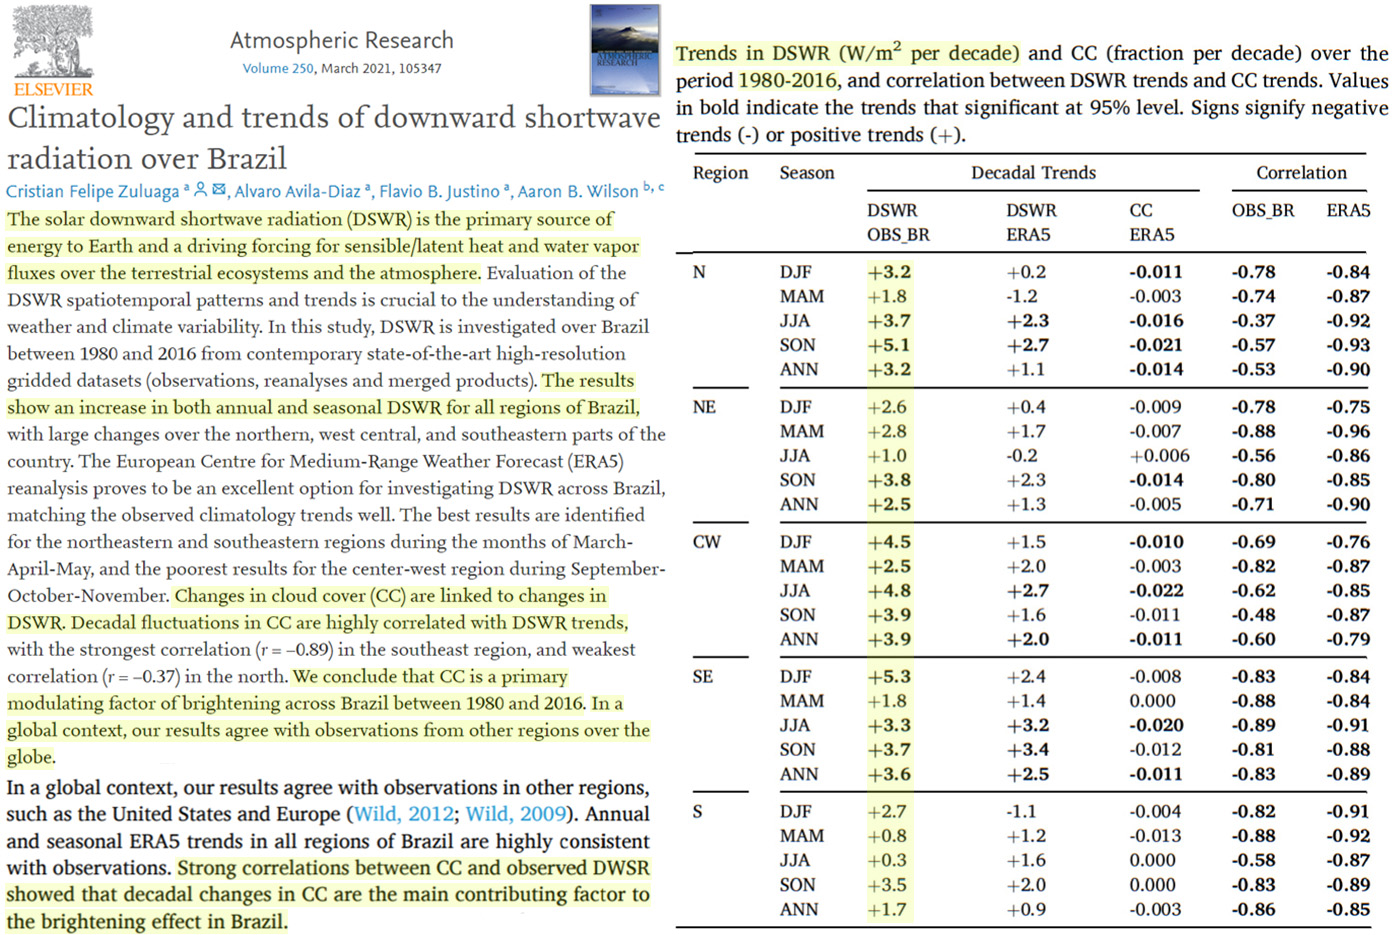
Image Source: Zuluaga et al., 2021
All of these forcing magnitudes easily dwarf the impact from CO2 concentration increases in cloud-free skies and affirm “clouds may be the most important parameter controlling the radiation budget, and, hence, the Earth climate” (Sfîcă et al., 2021).


Readers interested in this subject should take notice of leading research on global brightening/dimming done at the Institute for Atmospheric and Climate Science of ETH Zurich, led by Martin Wild, senior scientist specializing in the subject.
https://rclutz.files.wordpress.com/2017/07/dimming-brightening.png
More at https://rclutz.com/2017/07/17/natures-sunscreen/
If You study Wild he suggests SO2 as an explanation of Solar Dimming and Brightening.
It is natural when it comes from Volcanos(Pinatobo) and it caused low temperatures.
But we have less SO2 in the smoke reducing outlets buy 90% since 1990.
I can show a graph from Sweden with more sun:
https://www.smhi.se/polopoly_fs/1.158487.1584112368!/image/allsack_1983-lastyear.jpg_gen/derivatives/Original_1256px/image/allsack_1983-lastyear.jpg
It is a trend! It is caused by man. It is good!
Yes, SO2 is a player in this. But how volcanism works in the long term is open to interpretation. Dr. Peter Ward:
Eventually, after publishing two papers that developed this story, I came to realize that sulfur dioxide was actually just the “footprint” of volcanism—a measure of how active volcanoes were at any given time. The real breakthrough came when I came across a paper reporting that the lowest concentrations of stratospheric ozone ever recorded were for the two years after the 1991 eruption of Mt. Pinatubo, the largest volcanic eruption since the 1912 eruption of Mt. Katmai. As I dug deeper, analyzing ozone records from Arosa, Switzerland—the longest running observations of ozone in the world, begun in 1927 (Figure 8.15 on page 119)—I found that ozone spiked in the years of most volcanic eruptions but dropped dramatically and precipitously in the year following each eruption. There seemed to be a close relationship between volcanism and ozone. What could that relationship be?
https://rclutz.files.wordpress.com/2020/01/ward-fig2.png
The answer was not long in coming. I knew that all volcanoes release hydrogen chloride when they erupt, and I also knew that chlorine from man-made chlorofluorocarbon compounds had been identified in the 1970s as a potent agent of stratospheric ozone depletion. From these two facts, and a third one, I deduced that it must be the depletion of ozone by chlorine in volcanic hydrogen chloride—and not the absorption of solar radiation by sulfur dioxide—that was driving the warming events that followed volcanic eruptions.
The third fact in the equation was the well-known interaction of stratospheric ozone with solar radiation.
https://rclutz.com/2020/01/16/co2-so2-o3-a-journey-of-discovery/
Also, in a short video by volcanologist John Seach (no longer available online), he says of one West Pacific volcano, that it emits more SO2 than any other volcano, which would presumably include Nyiragongo. And that’s just baseline emissions.
It seems to me that human generated SO2 emissions, like our CO2 emissions, are most likely globally insignificant.
https://acp.copernicus.org/preprints/13/12389/2013/acpd-13-12389-2013.pdf
“Lower stratospheric variability of SO2 could mainly be explained by volcanic activity and no hint for a strong anthropogenic influence has been found.”
Thanks,Kenneth! I’ll add that to my collection.
.. OK, but do we know what’s caused the decline in cloud cover? (Or indeed, aerosol optical depth?)
Is the decrease in cloud cover a global phenomenon or is the effect greater over heavily populated land masses? If the latter, I am speculating that it could be related to decreases in conventional air pollution, particularly particulates and visible smog, as a result of tightened environmental regulations since the 1970s. If clouds require “seeding” with minute dust or other particles to encourage the condensation of atmospheric water vapour, that could be a possible connection.
The atmosphere in the cities of most developed countries is noticeably cleaner and the skies are clearer than in the 1970s.
This is the sort of thing behind the material difference between “irradiance” and “insolation”… which I was trying to explain to, um, SOMEONE a little over a week back…
Add in the albedo changes….
Hat tip Zoe.
https://phzoe.com/2021/06/01/on-albedo/
The argument being whether the CO2 increase or temperature changes are changing cloud cover. What is natural (eg. most of what was before 1950 vs current situation)? You can’t just say 80 to 100% of current long term changes are AGW when you don’t know the causes & measure inputs to explain the past (they just average over long periods & blanket statement to label as natural in the past and unnatural now).
I get a bit lost with what they are measuring (sun comes in, sun bounces of cloud/surface, what stays/keeps bouncing/moving, what escapes into space), and over what period of time.
What’s the difference between “irradiance”, “insolation” & “insolence”?
Undoubtedly cloud cover is related to insolation received at the surface. I have taken the Ceres data produced by Zoe and looked at the variability by month presenting the analysis here: https://reality348.wordpress.com/2021/06/07/questions/
I’m inviting comment before I offer the interpretation.
I agree with this summary: All of these forcing magnitudes easily dwarf the impact from CO2 concentration increases in cloud-free skies and affirm “clouds may be the most important parameter controlling the radiation budget, and, hence, the Earth climate” (Sfîcă et al., 2021).
Basic reason is that clouds don’t warm via back radiation. You can measure enhanced back radiation in a cloudy atmosphere. Its due to the fact that the air comes from the equator, its warm and moist. But albedo is seasonally least in August when solar radiation is 6% weaker than in January and the globe is 2.5 degrees warmer than in January. Global cloud cover is least in August due to the heating of the atmosphere by the continents of the northern hemisphere. Global cloud cover rises steeply to its peak in December and it is in this interval that the greatest variability in albedo is seen. This affects the energy intake in the atmospheric windows over high pressure cells in the southern hemisphere. The Southern hemisphere absorbs more energy than it emits, the difference being transported to the North in the Oceans.
The atmospheric windows are surface pressure dependent. Surface pressure is dependent on polar cyclone activity in the Circumpolar Antarctic Trough and also, the Aleutian Low and the Icelandic Low that come into action in October.
As one of the argued repercussion of global warming is increased warming of the oceans, thus increasing the cloud generation from water vapour. Assuming that this is correct, will/could this prove to be a mechanism to diminish the warming we are seeing, as nature’s own “failsafe”?
[…] Magnitude Of Recent Surface Solar Radiation Forcing Over US Is Tens Of Times Greater Than From CO2 […]