The Franklin Expedition’s greatest enemy: The Little Ice Age
By Die kalte Sonne
(Translation/editing by P. Gosselin)
The topic of “exploring the Earth’s polar regions” is topical again now. This is not only shown by spectacular expeditions such as the MOSAIC Expedition 2019, but also researchers recently discovered the Endurance, the ship of South Pole explorer Sir Ernest Shackleton. The Endurance had sunk in the Antarctic Weddell Sea in 1915. The explorer and his crew managed to save themselves at the time.
Some daring explorers like him have brought science considerable gains in knowledge. Their achievement cannot be appreciated enough. (Epic survival story).
Lead poisoning
Unfortunately, the participants of the Franklin Expedition in 1845 fared quite differently. None survived the search for the Northwest Passage, and only later did the mystery of the expedition’s failure unravel. One reason for this tragic end was probably due to lead. In the mid-19th century, food tins were soldered shut with lead. Sir John Franklin took plenty of provisions with him, but some of them had been carried in cans. So members of the expedition regularly ate lead as well. The few documents that were deposited in metal tubes in prominent specially erected landscape points (e.g., stone pyramids) at that time indicate that the lead had affected the thinking of the crew. They sometimes jotted down confused things on the forms. Nor is it possible to explain the behavior of parts of the crew who apparently returned to the ships that had already been abandoned. Possibly the lead had an influence here.
Extreme cold, cannibalism
Much worse, however, was the climate in the mid-19th century, when the explorer set out to find the sea route from Europe to Asia via America. Franklin, of course, had planned to winter in the Arctic and then find the route to the Pacific during the short Arctic summer. However, the ice did not melt as expected but, contrary to the hopes of the Arctic explorers, actually grew during the summer. As a result, the ships did not make any progress even in the summer; on the contrary, they drifted with the ice in a southerly direction, i.e. opposite to their actual destination.
In 1845, very cool temperatures were noted for the British summer. It was about 2 degrees cooler than usual according to these records. The winters of 1846 and 1847 were thus even colder in England. The summer of 1845 must also have been very wet. It was the year that potato blight destroyed the crops in Ireland, causing famine. The end of Franklin’s expedition was dramatic because there is much to suggest that even cannibalism was practiced in the face of adversity.
Franklin’s unlucky timing
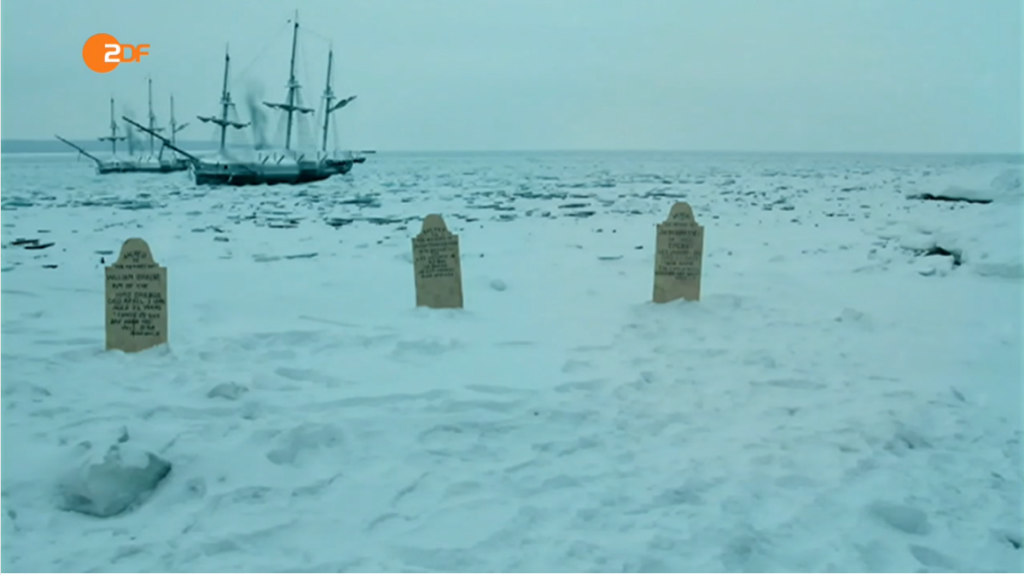
A good overview of the events and the discovery of the ships is given by a program of TerraX or also the podcast “Früher war mehr Verbrechen“. There, the expedition and the failure is described in great detail in a three-part broadcast.

(Image: Screenshot ZDF-Mediathek)
Franklin’s misfortune was the timing. The expedition took place at a time that is likely to be among the coldest in the last 2,000 years.
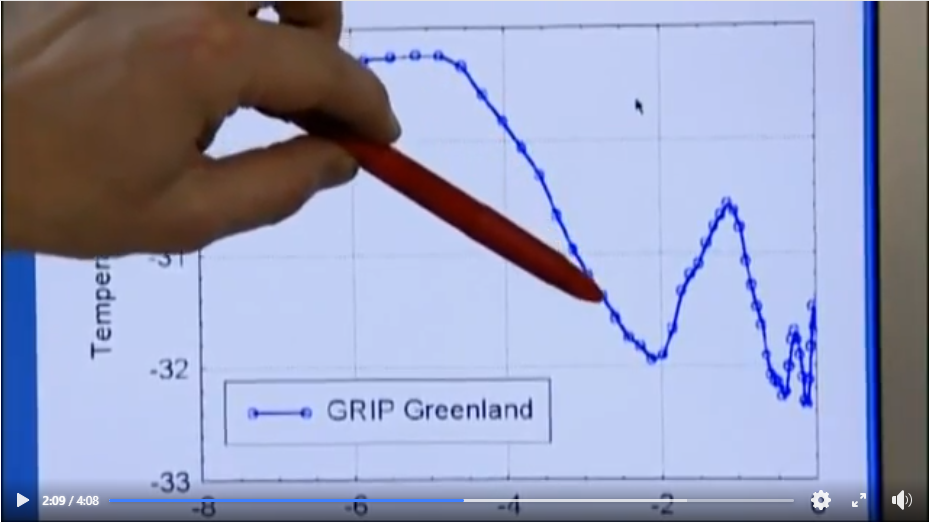
Recently, we reported here on the research of Professor Jørgen Peder Steffensen of the Niels Bohr Institute in Denmark. His research was based on Greenland ice cores that can map very long periods of time. In such cores, temperatures can be read year by year. Steffensen even assumes that the end of the Little Ice Age was also the end of the coldest period of the last 10,000 years.

(Image: Screenshot Facebook)
Very different from Dr. Michael Mann’s Hockey stick
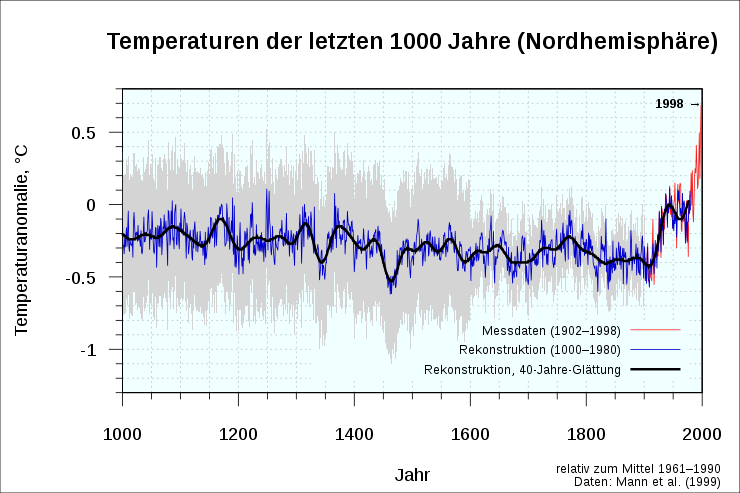
The researcher also interprets his ice cores in such a way that he assumes temperatures prevailed on Greenland during the Medieval Warm Period (around the year 1000) that were up to 1.5 degrees above today’s values. His temperature curve looks therefore clearly different from Michael Mann’s 1999 “hockey stick”, namely more like an accordion.
But around the year 1000, according to Steffensen, the temperature in Greenland was different than how Mann read it. The ice core curve comes from a much higher level. One should keep in mind, however, that Mann meant the entire northern hemisphere, while Steffensen only assumes Greenland, which is only a part of it. It would be unusual, however, if Greenland had developed completely differently from the rest of the Northern Hemisphere. But maybe simply the many poor quality verified tree ring data from Mann is a major problem?
A big difference in the curves is noticeable, though. In Mann’s case, the curve drops only moderately toward the end of the Little Ice Age. At the beginning of 1000 until the middle of the 19th century it remains quite stable with only a slight downward trend, in contrast to the ice core curves.
Factor of 5 difference
In Steffensen’s case, it goes down significantly after the year 1000 with a visible low point in the middle of the 19th century. The size of the anomaly is also very different. When it is just about 0.3 degrees Celsius at Mann, it is about 1.5 degrees at Steffensen, where it became cooler between the year 1000 and the middle of the 19th century. That would be a factor of 5!

Chart: Screenshot Wikipedia. Source: DeWikiMan, North hemispheric temperatures of the last millenium, based on Mann, Bradley, Hughes (1999), CC BY-SA 4.0
The Steffensen curve clearly fits better to the tragic events around the Franklin expedition.
Today, the middle of the 19th century not only marks the end of the Little Ice Age, it is also the beginning of the industrialization of the world and the start of systematic weather recording. These existed far before. Daniel Fahrenheit invented the mercury thermometer as early as 1714, but the recording of weather data became much more relevant in the 19th century and the measurement network became wider.
The reasons, by the way, were also wars, people did not want to be surprised anymore. During a violent storm during the Crimean War in 1854, for example, 38 French merchant ships and one warship sank. This was the birth of the national storm warning service and, if you will, of modern meteorology. We should keep this end of the Little Ice Age in mind whenever statements are made about the temperature development of the last 150 years. These started, as Steffensen says, at a very low point.


[…] Franklin’s Ill-Fated Expedition Contradicts Dr. Michael Mann’s Hockey Stick Temperature … […]
[…] From the NoTricksZone […]
[…] From the NoTricksZone […]
[…] From the NoTricksZone […]
[…] From the NoTricksZone […]
[…] From the NoTricksZone […]
[…] NoTricksZone에서 […]
[…] From the NoTricksZone […]
[…] From the NoTricksZone […]
[…] From NoTricksZone […]
[…] From the NoTricksZone […]
You seem to think that Greenlands temp equatesxexactky to the Temps of the whole Northern Hemisphere when we know that us not correct
Your statement is a red herring since Dr. Mann used Bristlecone tree ring data that is found some of the smallest region of America at very high altitudes not a representative same of a large area at all.
The data was from Dr. Isdo who warned they should NOT be use for temperature proxy but for the CO2 effect on plant growth.