Scientists continue to document a sea surface cooling in the vast waters above Antarctica.
As recently as a few thousand years ago the Sub-Antarctic (South Georgia) region was 5 to 10°C warmer than it is today (Xia et al., 2020).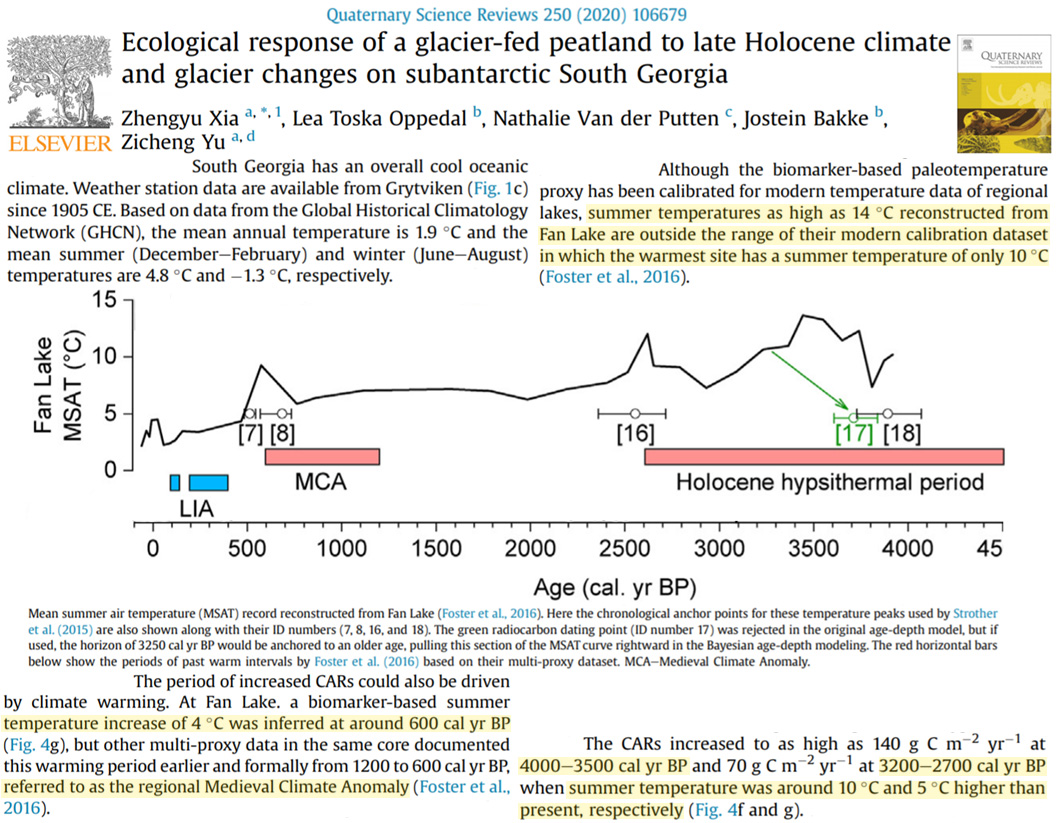
Image Source: Xia et al., 2020
About 1,000 years ago (the Medieval Warm Period) Antarctica was still “substantially warmer than present” and the Southern Ocean waters were sufficiently ice-free that elephant seals could breed in the Ross Sea, or near the coast of south-central Antarctica’s Victoria Land.
Today this region is so much colder and the sea ice so thick that elephant seals must travel 2,400 kilometers north of where they used to breed 1,000 years ago just to find sea ice-free waters (Koch et al., 2019; Hall et al., 2006).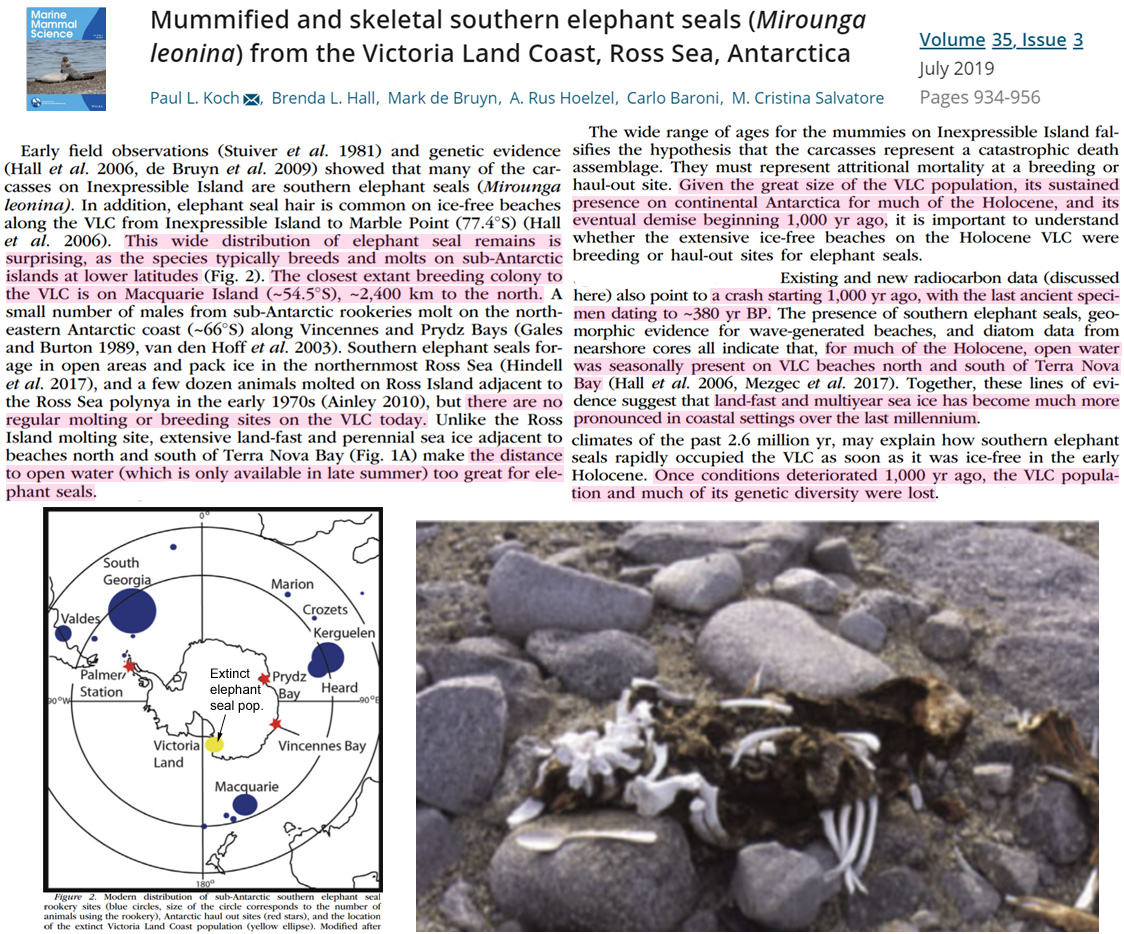
Image Source: Koch et al., 2019
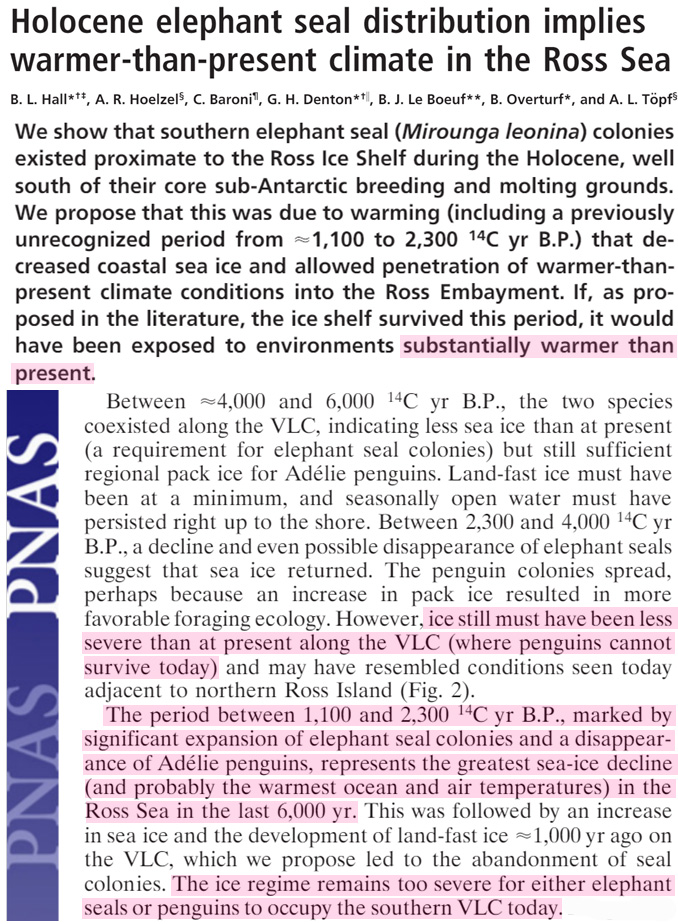
Image Source: Hall et al., 2006
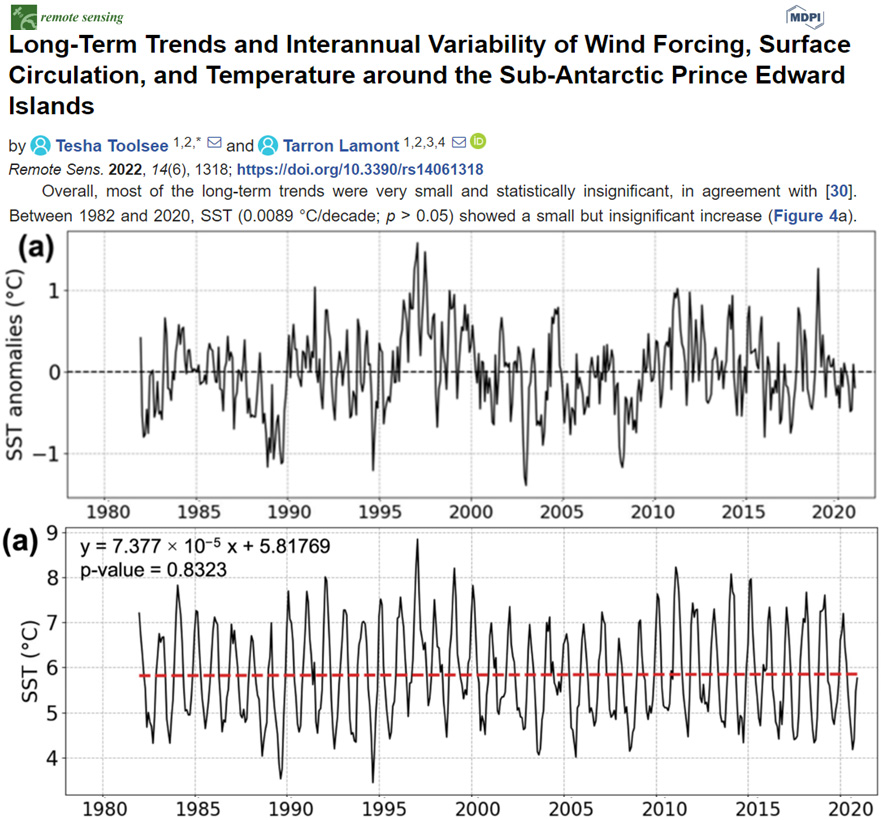
And now some new studies (Atkinson et al., 2022, Toolsee and Lamont, 2022) document a cooling/non-warming trend in the southwest Atlantic and/or Sub-Antarctic region has commenced in the last few decades. The cooling follows a long-term warming trend that lasted from the 1920s to 1990s.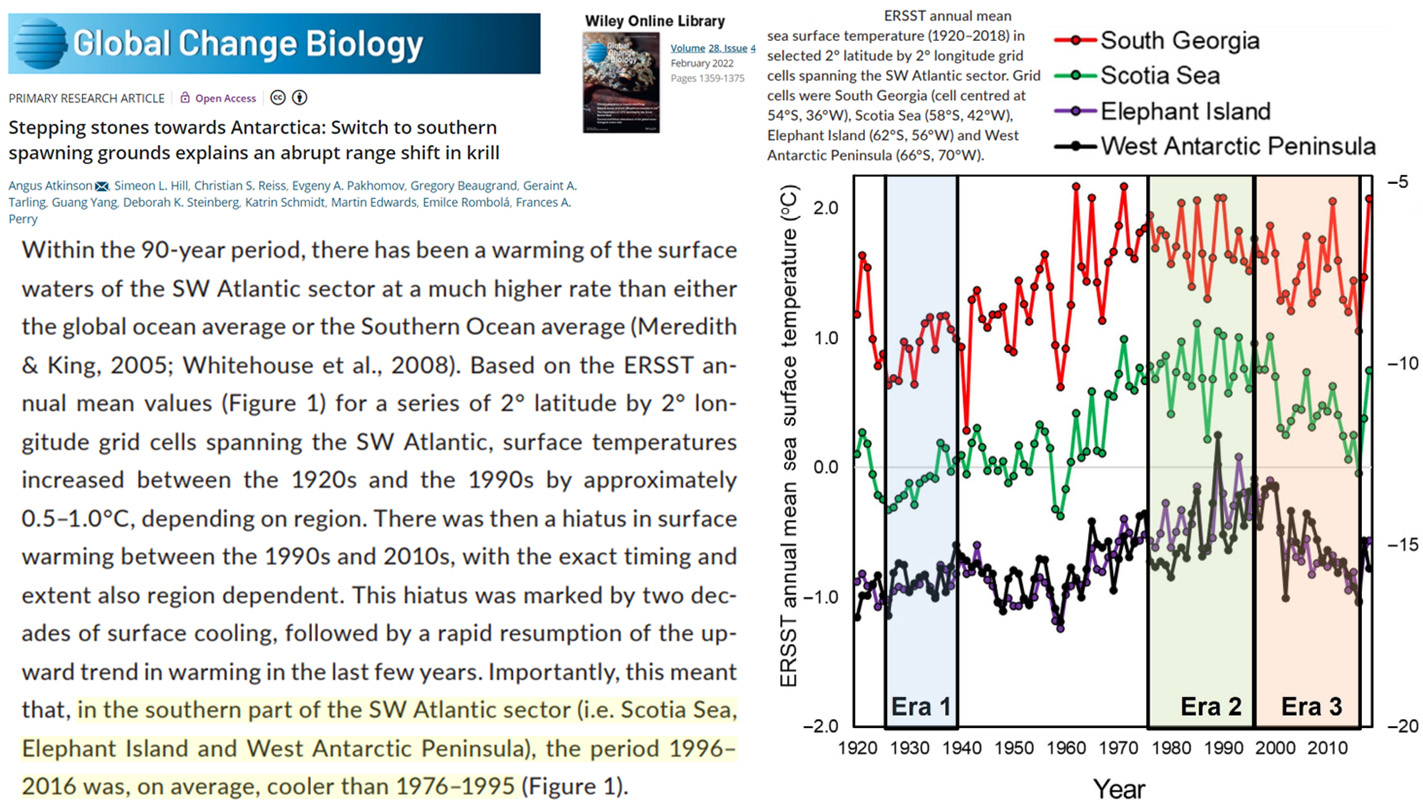


[…] The Southwest Atlantic To West Antarctic Peninsula Region Has Been Cooling Since The 1990s […]
“Today this region is so much colder and the sea ice so thick that elephant seals must travel 2,400 kilometers north of where they used to breed 1,000 years ago just to find sea ice-free waters.”
Talk about “climate refugees.”
So does this mean we are doomed, very doomed, or extremely doomed?
Get your mask on.
The mask cultists are the most brainwashed brainless suckers the planet has ever seen.
Next in line are the warmunists, it is the coldest spring I’ve ever seen in these parts, not one day in the eighties, not one day in the nineties, it is definitely a cool down, the weather says so. You’re a sucker if you believe in global warming due to carbon emissions by those evil humans.
Ain’t happening here. It is 33 degrees and snowing, just miserable weather.
Where’s the sun?
The asparagus will be here soon.
“The asparagus will be here soon.”
mmmmm, fresh asparagus! Yum!
[…] Related: The Southwest Atlantic To West Antarctic Peninsula Region Has Been Cooling Since The 1990s […]
Good article.
The Northern Hemisphere and Southern Hemisphere climate change in the past 50 years has been different. Climate science is obviously not settled.
I (purposely) wrote about this region “cooling since the 1990s” (which would mean it could be 1998). I had other articles I could have written, but I wanted to provide you with another reason to inform me that I am violation of the WMO. And I “ignored” the Northern Hemisphere this time. Another egregious violation.
(1) You didn’t make any climate predictions.
Climate predictions are almost always wrong.
So I couldn’t complain about that.
(2) You didn’t data mine a “pause”.
So I couldn’t complain about that.
It was a good article.
Good science.
Sorry I couldn’t find anything to complain about.
You seem disappointed.
I encourage people to refute the work of the WMO, and the global data of the government climate agencies (NASA-GISS, HadCRUT, Berkeley Earth, etc.) Especially their predictions of climate doom.
But if you reject their 30 years or more is climate rule, or their historical global average temperature data, that should be mentioned to your readers, and reasons explained.
In your last article, you contradicted the NASA-GISS global average radiosonde trend since 1958, which does NOT show any pause since 1998, with no mention of why their data were rejected.
That rule of thumb does not apply to local climate reconstructions, as in this article, which do not represent a global average.
If you want me to complain, just make a long term climate prediction, or data mine a “pause”. Otherwise I’m a nice, always polite, refined gentleman, who spend most days helping old ladies crossing the street, as you have surely noticed from my prior comments.
The radiosonde article didn’t contain any predictions either. You were conjuring them up yourself based on your wrong assumptions.
Not a pause, but a cooling. So you’re saying a cooling trend since the 1990s (i.e., less than 30 years) is OK to report on, but a pause since the 1990s is “data mining” and “biased”? This is entirely inconsistent.
What “work” is insinuated by arbitrarily deciding that 30 years is climate? There is nothing scientific about saying that a 29.5-year temperature trend is not climate but a 30-year trend is climate. It’s just a made-up definition. One cannot falsify an arbitrarily-defined conceptualization. Why not 40 years? How about 60 years considering there are 60-year oscillations? Why is 30 years enough to be “climate”? Support your answer using scientific evidence.
You keep on making this bogus claim and simultaneously failing to back it up. First of all, the article cites a paper that shows radiosonde temperature data from the NH and tropics only. It’s not global. So if you’re going to falsely claim the authors of the paper contradicted NASA, you’ll need to produce the NH radiosonde evidence from NASA and show us how the authors got it wrong, or how they contradicted NASA. Since I’ve invited you to do this multiple times, and each time you have failed to produce the evidence validating your claim that the authors contradicted NASA’s NH radiosonde trend, I’ll assume a) you cannot back up your claim and that b) you’re making false accusations. One more time: Produce a radiosonde chart of the NH and show us where the authors contradict NASA.
“the article cites a paper that shows radiosonde temperature data from the NH and tropics only. It’s not global.”
IN YOUR LAST ARTICLE, the paper was being used BY YOU to to obscure the NASA-GISS data claiming no pause in GLOBAL radiosonde data since 1998, which you didn’t bother to mention.
You used 24 years, when global radiosonde data are available since 1958. Data truncation.
You used NH when global data were available.
You used the tropics which have had the least amount of global warming since 1979 — UAH shows about +0.1 degrees C. per decade in the tropics since 1979, or about +0.4 degrees total.
You used 1998 at a starting year when that year was unusually hot from an unusually large El Nino heat release, unrelated to greenhouse gases — the worst year one could pick to start a temperature trend.
You repeatedly made every data choice to “prove” your conclusion about a “pause”, that you obviously had BEFORE writing that article. You started with a conclusion, possibly influenced by Monckton. Those repeated biased data choices were not coincidences.
I never said the authors of the paper you quoted were wrong. They could be wrong, or right, I don’ know that.
YOU were wrong to promote a data mined “pause since 1998” as something important.
ON THIS ARTICLE:
The last two charts in THIS article don’t show a cooling trend from 1982 to 2020 and the notes on the chart say the long term trends are not statistically significant. Those charts seem to contradict the “cooling” title of your article.
I was trying to be nice with my first comment on this article, but you are still on the warpath, and could not accept my complement. Take your medications, Mr.1998 Pause Truther !
False accusation. I used the charts provided in Madonna et al. to demonstrate visually that the temperature rise in the NH and tropics – which are the only locations they used – are not rising in alignment with the rise in CO2. This is why I wrote “there was more warming from the early 1980s to late 1990s – when CO2 only rose about 25 ppm (341 to 367 ppm) – than there has been this century.”. I wrote nothing about NASA-GISS data, as you falsely claim.
False accusation. The Madonna et al. charts of NH and tropical temps start in 1979. So that’s 40+ years. I pointed out that there was more warming from the 1980s to late 1990s than there had been since the late 1990s – even though there was much more CO2 rise in the more recent decades. Because that’s what the radiosonde charts seem to show. The Madonna et al. paper does not provide global radiosonde data since 1958. They only provide NH radiosonde data since 1979. So that’s what I used.
And, yet again, you have failed to provide evidence that the NH radiosonde data shown in Madonna et al. is “contradicted” by the NH radiosonde data from NASA GISS. I will assume this means you are simply making this claim up. Fabricating. So, in other words, this is another false accusation from Richard Greene.
I used NH and tropics radiosonde data because that is all that is made available in Madonna et al., 2022. I am unable to change what regions the authors chose to use in their graphs.
So why are you using 1979 as your starting point? The radiosonde data for the tropics starts in 1958.
Again, why start in 1979 when radiosonde data from NASA GISS is available for the tropics since 1958? Did you purposely truncate the 60+ years of temperature changes in the tropics so as to emphasize the lack of strong warming since that cherry-picked year?
False. The starting year was 1979. I pointed out there was more warming from the 1980s to late 1990s than there had been in the decades since the late 1990s.
Yet another false accusation from Richard Greene. You’re on a roll. I don’t use words like “prove” when making statements about what data or charts seemingly show. This is what I actually wrote: “Radiosonde measurements appear to depict mostly flat temperature trends since 1998 in both the Northern Hemisphere (25°N to 70°N) and tropics (25°S to 25°N).” That’s hardly claiming proof. I purposely didn’t use the word “pause” either. Saying “mostly flat” semantically includes trends from slight warming to moderate warming, only precluding an apparent steep or strong warming. I was purposely vague. I choose my words carefully when writing articles, as I don’t want to give the impression I am fully convinced that I have unearthed a Truth. You, on the other hand, have said that you are convinced there was global cooling from 1940 to 1975 even though we have no reliable temperature data from this period.
There is nothing about the Madonna et al. NH or tropical radiosonde data depiction that was influenced by Monckton. I started with Madonna et al.’s charts that they provided in their paper. That’s it. There is nothing more sinister going on here.
Unbelievable. Richard, you claimed Madonna et al.’s 1979-present NH radiosonde chart is contradicted by NASA GISS. I have invited you multiple times to provide the evidence to back up this claim, but you have failed to do so. Obviously because you can’t back it up. You’re making it up. The 1979- radiosonde data for the NH is likely no different in NASA GISS than it is as presented by Madonna et al. But I have an open mind. Present the data. Show us this contradiction you allege. Compare apples to apples – NH to NH. Stop making false accusations you can’t back up.
Are you nearing your breaking point, Richard?
I saw “false accusation” in your last comment and immediately skipped to the last line of your comment.
False Accusations is a good blues song by Robert Cray:
https://www.youtube.com/watch?v=Joz4Zxgldbw
You seem to enjoy presenting local temperature data that do not match the official global average temperature data.
Those data do not contradict the global averages, so that’s okay, even if not particularly useful.
I’ll only object if you cherry, pick a large El Nino year, such as 1998. or 2015, or 2016, as the start year to data mine a “pause”.
I didn’t read the rest of your last comment (May 23 5:55am) because I reached my “breaking point” — breaking up laughing at your gross over reaction to criticism of your last “1998” article.
This article is different than your last article because it does not cherry pick 1998.
Since 1979, using both UAH and HadCRUT, there was global cooling around -60S latitude (Southern Ocean), completely different than the large amount of warming at +75N latitude (Siberia). The large temperature trend differences by latitude are obscured by the use of a single global average temperature number.
With no explanation for these observations by latitude, the Climate Howlers simply focus on Arctic warming since 1979, and generally ignore Antarctica, which had a very cold winter in 2021. If there is ever an unusually warm day in Antarctica, the Climate Howlers are likely to exploit that one day. That’s the game they play
Please go back to writing articles. I’m not reading your comments to encourage other forms of writing. Have a Nice Day, Mr. 1998.
PS: Based on your anger, I was going to recommend that you have your head examined. But on second thought, I decided they would find nothing.
Nice. For the record, there has never been a moment when I have felt “angry” in responding to your false accusations, Richard Greene.
I notice you have still failed to produce the requested validation of your claim that the Madonna et al. NH radiosonde data are “contradicted” NASA GISS. So, again, I’ll continue assuming you’ve fabricated this claim.
KR SEZ:
“I notice you have still failed to produce the requested validation of your claim that the Madonna et al. NH radiosonde data are “contradicted” NASA GISS. So, again, I’ll continue assuming you’ve fabricated this claim.”
The NASA-GISS global radiosonde data show no pause after 1998. That’s important The study you referenced shows a subset of the global climate — the tropics in the Northern Hemisphere. That’s not very important.
It may be interesting to some readers, but you were biased by using 1998 as a start point of a temperature trend.
And biased by not including context — that a LOCAL temperature trend is different than the official GLOBAL warming temperature trend.
You deliberately made a local cherry picked “pause” seem to be important, when it was not.
And now I’ve decided the only way to end this “debate” is to come to England and show you who’s boss. I’m 5′ 2″ and 495 lbs. so LOOK OUT KR. Walls can’t stop me!
Have a Nice Day and please move on.
Richard Greene
Bingham Farms, Michigan
I have a theory that it’s impossible
to prove anything, but I can’t prove it.
Show us the NH radiosonde data so we can compare it directly to the NH graph shown in Madonna et al., as you claim the latter “contradict” the chart from NASA.
In the meantime, here (bottom chart) is the global radiosonde data from NASA/NOAA for 1979-2015. Where do you see the post-1998 warming clearly?
Since I have asked you repeatedly to support your claim that Madonna et al.’s depiction of the NH temperature trends since 1979 is “contradicted” by NASA’s NH radiosonde temperature record, I will, again, assume you are just fabricating this. You can’t back it up because your claim is false.
Why do you continue making false claims, Richard?
Tuesday May 24 in the USA
Long ago I provided the link to NASA-GISS global radiosonde official data. Apparently you were mot interested in looking there:
https://climatefeedback.org/claimreview/noaa-shows-clear-global-warming-trends-over-the-past-58-years-based-on-radiosonde-data/
At that link there is no “pause” since 1998, whether using radiosonde, weather balloon or surface thermometer data.
You have recently twice presented a local temperature data that show nearly a pause if you data mine 1998 as a starting year, or a cooling trend.
Those local data do not support the global trend.
Therefore. I wrote that they contradict the global trend.
I’ll wait for you to look up the definition of “contradict”
If you were an unbiased writer, which you are not, this would be the narrative you SHOULD have presented with the studies you recently presented here:
Official global radiosonde, balloon and surface measurement data show a warming trend since 1975.
One study, of the NH tropics, shows an area with a different trend, if you cherry pick 1998 as the start year.
In another study, the Southern Ocean north of Antarctica had a cooling trend.
Some local areas have not matched the official global average temperature trend. They contradict the global trend.
These local measurements show that temperature trends by latitude are being obscured by the use of a single global average temperature. An average temperature that not one person lives in.
And now that I’ve taught you how to write, I will work on teaching you how to calm down, and how to tap dance too.
“climatefeedback(dot)org is the best Richard Green can offer as rebuttal?
https://globalwarmingsolved.com/2021/09/10/open-letter-a-recent-climate-feedback-fact-check-article-makes-multiple-false-and-misleading-claims-about-a-new-study-and-newspaper-coverage-of-it/
See also here..
https://notalotofpeopleknowthat.wordpress.com/2021/02/16/gwpf-calls-for-climate-feedback-to-withdraw-untrue-and-misleading-claims/
His research skills are far from well honed.
[…] The Southwest Atlantic To West Antarctic Peninsula Region Has Been Cooling Since The 1990s […]
[…] https://notrickszone.com/2022/05/19/the-southwest-atlantic-to-west-antarctic-peninsula-region-has-be… […]