According to Al Gore, based on statements and “science” from “leading climate experts”, the Arctic was supposed to be ice-free in the summer already years ago.
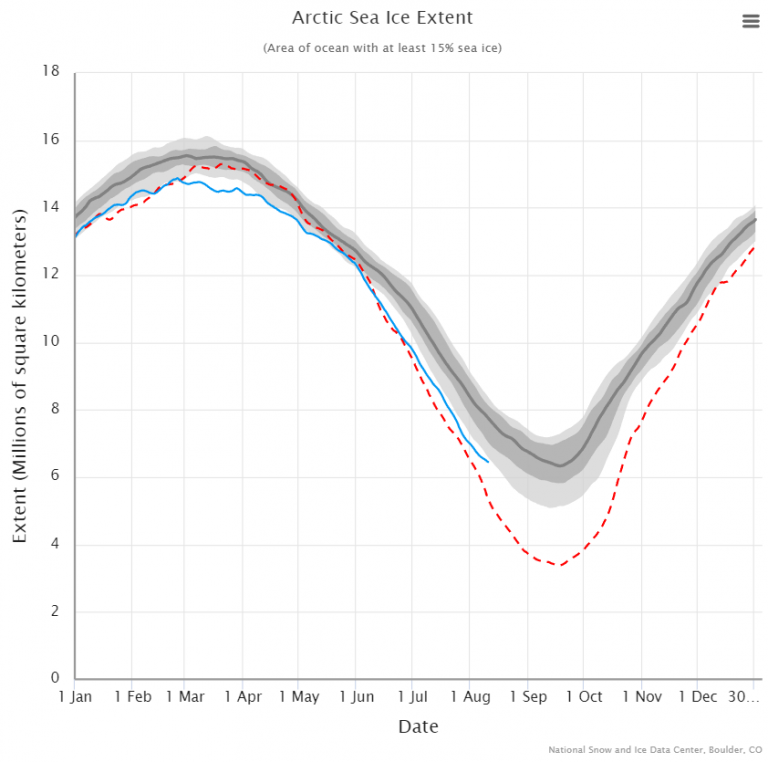
Now that the summer ice melt season in the Arctic will end soon, by the middle of next month, it’s a good time to see how Al Gore’s prediction is faring. To do this we look at the latest from data the National Snow and Ice Data Center (NSIDC):
Source: NSIDC Arctic Sea Ice Chart
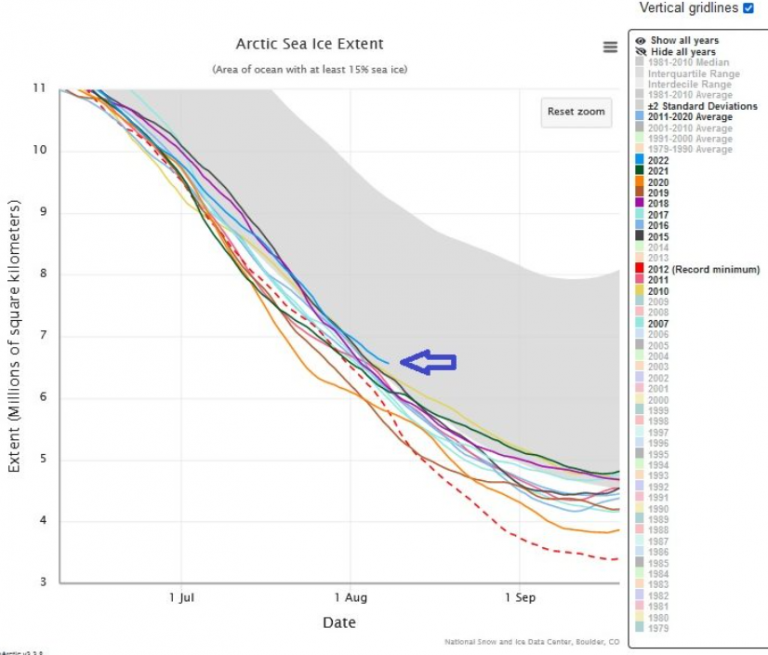
Snowfan here zooms in on the chart for greater detail and reports that for this date, ice extent in the Arctic stands at a 12-year high:
It would be accurate to say that Al Gore’s prediction has turned out to be on par from what you’d expect from a swindling fortune teller reading tea leaves and a crystal ball.


[…] Doomsday Climate Predictions Meltdown: Arctic Sea Ice Extent Reaches 12-Year Mid-August High […]
The antarctic as well
“The antarctic as well” ??
I think you need to check that statement.
According to Jaxa and NSIDC, Antarctic sea ice is quite low
Not that it matters.
We assume Peter Wadhams, for whom the eponymous ‘1 wadham’ is named, was unavailable for comment. His new role is the Chairman of Science Committee for Extreme E. What? Me either.
1 Wadham = 1M km2
For usage see:
https://rclutz.com/2021/10/12/arctic-ice-already-exceeds-six-wadhams/
Indeed, John. The metric originated in Wadham’s assertion that an Arctic ice minimum of 1M km2 or less should be termed “ice-free.”
Actually, 2014 was slightly higher than this year (6.363 v 6.339 according to latest data.)
(Note that Snowfan’s graph has 2014, 2013 unchecked.)
Still does not effect the final outcome, because back to 2007, the only other year that is higher than now is 2009, and it is very close.
Watch over the next few days, that 12 year period may increase to 15 years.
Al Gore is basically a low-end snake-oil salesman.
2022 (6.262 Wadhams) has just overtaken 2014 (6.251 Wadhams) in NSIDC
That Al Gore’s predictions were wrong is meaningless. Al Gore is a failed politician and doofus, not a climate scientist. The real story is that every prediction of environmental doom since the 1960s was wrong, with many made by real scientists.
The Arctic is also a poor example if you want to refute scary predictions of global warming. Antarctica would be a much better example.
This article, by cherry picking a 12-year trend, failing to include the context of Arctic warming since the 1970s, and mocking Al Gore, fails to effectively refute climate scaremongering. A strike out
It’s a 16 year plateau in Arctic ice extent, with this August looking to add another year.
I don’t see a plateau in NASA Earth Sciences data
Please explain why NASA data are wrong
https://earth.gsfc.nasa.gov/cryo/data/current-state-sea-ice-cover
Maybe you should first explain why you believe NASA’s data are right.
A longer term Arctic ice perspective is available from NOAA SII.
https://rclutz.files.wordpress.com/2021/09/sii-annual-to-2021.png
https://rclutz.com/2021/09/23/arctic-ice-in-perspective-2021/
[…] From the NoTricksZone […]
[…] From the NoTricksZone […]
[…] From the NoTricksZone […]
[…] From NoTricksZone […]
[…] From the NoTricksZone […]
Arctic sea ice extent
Use the MASIE-NH Daily Image Viewer to see where Arctic sea ice is now and how that data compares to the last four years. The data shown below is obtained nightly and comes from the most recent full day of data from the US National Ice Center (NIC). As is the rule with operational centers, gaps in production can occur without warning.
https://masie_web.apps.nsidc.org/pub/DATASETS/NOAA/G02186/plots/4km/r00_Northern_Hemisphere_ts_4km.png
https://nsidc.org/data/masie
MASIE, day 224, is above all years back to 2007 except 2008
[…] From the NoTricksZone […]
Antarctica isn’t even worth talking about, because range changes depend on currents in the Pacific, and the polar vortex is strong. The upcoming La Niña peak could be strong.
https://climatereanalyzer.org/wx_frames/gfs/ds/gfs_nh-sat6_t2anom_1-day.png
http://www.bom.gov.au/archive/oceanography/ocean_anals/IDYOC006/IDYOC006.202208.gif
Also, basically no person or species is affected by Antarctic sea ice levels.
Its irrelevant.
If people want to see why 2013 & 2014 were were not included in snowfan’s .jpg, I left a copy with those years and 2022 at https://wattsupwiththat.com/2022/08/13/doomsday-climate-predictions-meltdown-arctic-sea-ice-extent-reaches-12-year-mid-august-high/#comment-3578023
Since July, 2022 is pretty much identical to 2013/2014 and would make the graph harder to follow (and negate the power of the claim about 2022 having significantly greater extent).