Greenland’s Ice Mass Balance 2021/22
By Die kalte Sonne
Autumn has begun. Time for the Greenland mass balance.
We have digitized the Polar Portal’s graph of the accumulated surface mass balance and have come up with a value of 467 Gt. That’s 100 Gt or 27% above the 1981…2010 mean! Together with the melting of icebergs (assuming the value of the previous year, which was already 10% more than that of 2020 ) this results in approximately the representation below, which was included in the publication until the report 2020.
In 2021, one has probably omitted for reasons, perhaps the jump was difficult to explain by the calving of icebergs?
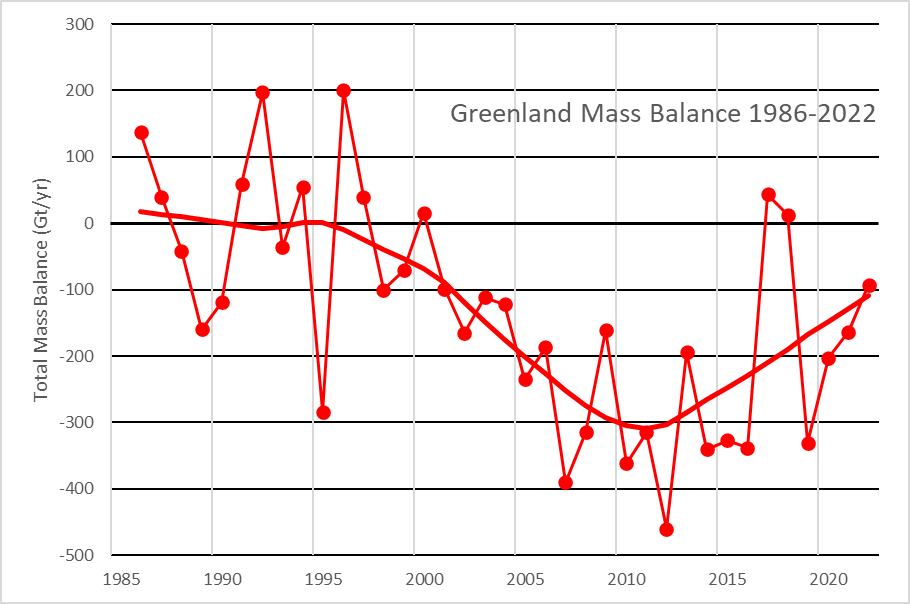
The total mass balance is very likely -100 Gt. An “accelerated” thawing of the Greenland ice sheet is not to be recognized. If one accumulates the mass loss, one sees the “braking” very nicely. Acceleration occurred until 2012.
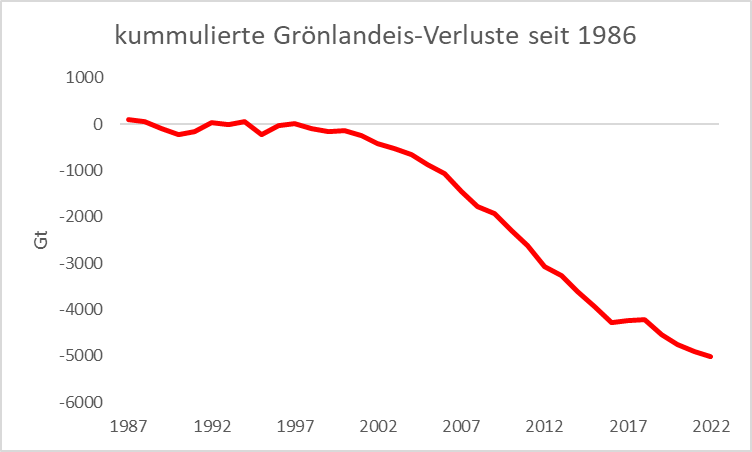
Accumulated Greenland ice loss in gigatonnes since 1986.


I watch the DMI Greenland Mass Balance most days. Any melting is around the southern coastal regions. I can’t credit any loss in Central Greenland. Perhaps the viking farms will be released from permafrost in the next few decades
Is calving of an already floating sections of glaciers actually mass loss? If so when?
There are about 2,500,000 billion tonnes of ice on Greenland
The alleged change in the past decade is too small to be statistically significant.