Charts by Kirye
Pacific typhoons continue downward trend for more than 70 years. Alarmists baffled, embarrassed
The Japan Meteorological Agency (JMA) presents the latest data for Pacific typhoons. Their data go back more than 70 years, to 1951.
First we look at the latest data from the Japan Meteorological Agency (JMA) for the number of typhoons formed in the Pacific in the month of October, now that the October, 2022, data have become available:

Source of data: JMA
Though the world has warmed (mostly naturally) since 1951, the overall long-term trend in typhoons remains downward, thus contradicting the dire claims made by climate bedwetters that a warmer climate leads to more storms.
Note how the 1990s and 2000s saw significantly fewer Pacific typhoons in October than in the 1950s, 60s,70s and 80s when CO2 levels were lower.
Annual trend
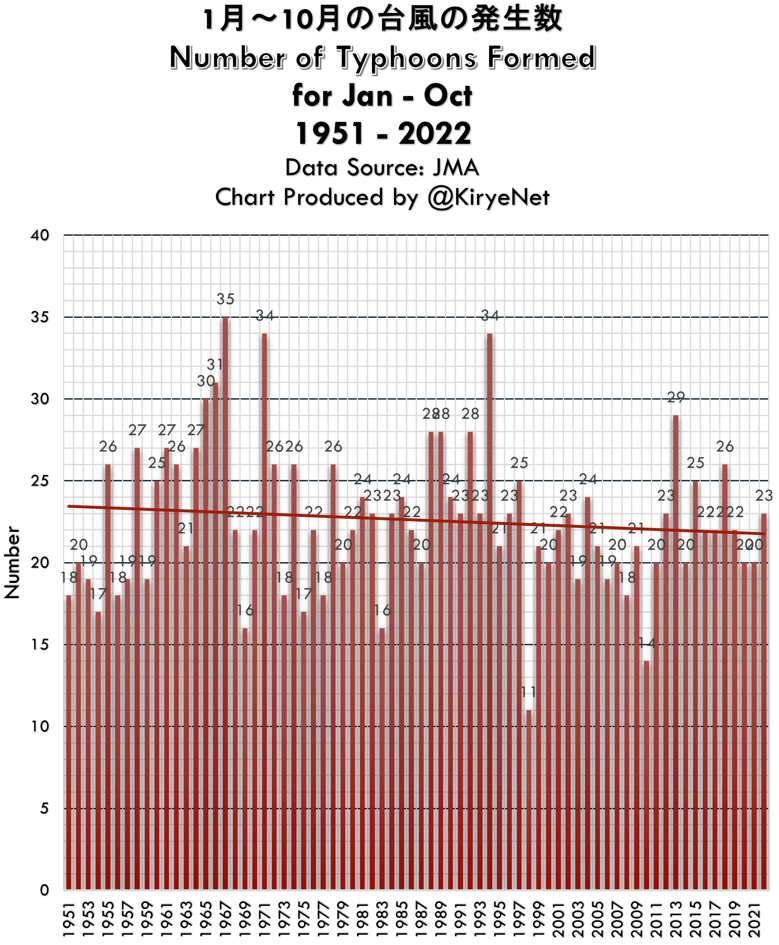
But one single month really doesn’t tell us a whole lot about overall Pacific typhoon trends, so now we look at the number of typhoons formed in the Pacific for the period from January to October, 1951-2022, now that the latest October data have been made available:
Source of data: JMA
Here as well we see a downward trend for the period. The alarmists have been shown to be wrong and the media have been misleading and lazy for not calling them, out. Pacific typhoons are not becoming more frequent. If anything, the warming has led to less typhoons, which is good news which the alarmists unfortunately are unable to swallow.


[…] Pacific Typhoons Continue Downward Trend, Contradicting Alarmist Claims Of More Storms — NoTricksZ… […]
But they are hotter storms. Or more violent. Or something.
Look, just accept that we’re doomed.
Ah, you see there’s a ‘tipping point’ coming, and then the direction of rotation will flip and we’re all dead…or something.
Generally speaking, storm seasons are:
Hurricanes – June to November.
Typhoons – April-December.
So where is an April to December chart?
Why a chart for only the month of October?
Whay a chart for January through October?
In addition, some typhoons formed could have been missed before the use of weather satellites in about 1980. Typhoons that made landfall should be a more accurate statistic when pre-1980 data are shown:
https://www.nippon.com/en/features/h00256/
So you can’t accept that ” If anything, the warming has led to less typhoons, which is good news which the alarmists unfortunately are unable to swallow.”?
To really put a kink in their tail demonstrate there is also a downtrend in intensity. What was the ACE for each of the years such a metric is available?
[…] Japanese Meteorological Agency (h/t Kirye at NoTricksZone) has posted the numbers for 2022, which is near enough to being over (since December typhoons are […]