Reconstructions of paleo CO2 levels openly rely on data derived from plant stomata. But when modern (1800s-present) CO2 measurements from stomata conflict with the narrative that humans drive CO2 levels, they are patently rejected.
Scientists readily acknowledge plant stomata evidence from one location are “widely used as an effective tool for paleoenvironmental reconstructions” of global atmospheric CO2 from 1 to 150 million years ago (Badihagh et al., 2024).
For example, in a new study, 100-150 million-year-old stomata samples from Iran are shown to re-confirm global atmospheric CO2 levels hit 1,100 to 1,700 ppm during the Jurassic period. The authors proudly showcase how consistently their stomata-derived CO2 measurements compare to several other reconstructions reaching the same conclusion about past CO2 concentrations.
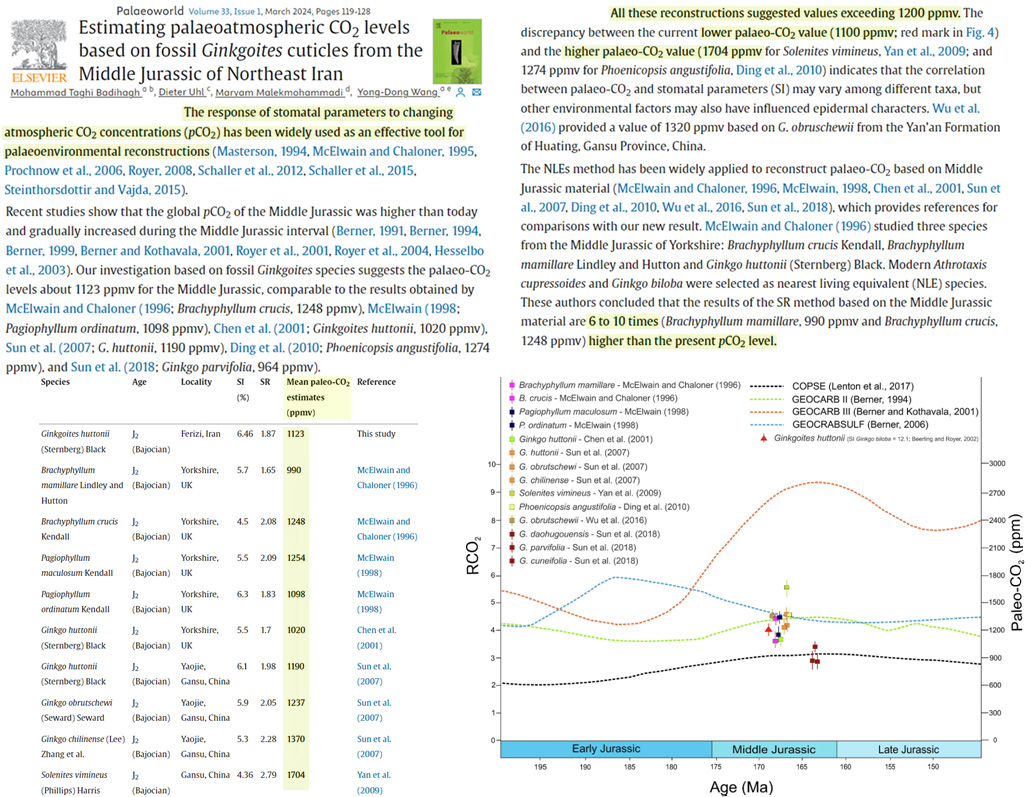
Image Source: Badihagh et al., 2024
But that’s where the stomata-are-an-effective-paleo-CO2-measuring-tool perspective stops.
Whereas millions of years ago CO2 data derived from stomata were thought to be accurate, direct stomata measurements recorded in scientific papers from only a century ago – even the 1940s and 1950s – are regarded as not accurate. They must be rejected.
Dr. Ernst-Georg Beck’s compiled research with plant stomata-derived CO2 measurements was posthumously published in 2022. It’s an exhaustively-referenced paper detailing 97,404 direct near-ground measurement from 901 stations situated across the world, in both hemispheres. (This is very much unlike the ice core CO2 record in which only one continental location, Antarctica, is used; and yet this local record – contradicted by Greenland ice cores – is regarded as “global”.)
The research was recorded in 292 scientific papers (77 authors) covering stomata-derived direct CO2 measurements for the industrial era, 1800-1960.
These database compilations – ~60,000 global-scale measurements between the 1930s and 1950s alone – consistently show CO2 hit 380 ppm in 1943 and 372 ppm in 1950, with very small error margins after about 1870.
The currently accepted CO2 values for 1943 and 1950 are instead recorded as 310 ppm, and the 372 to 380 ppm values are not assumed to have been achieved until the mid-2000s. A data-driven portrayal of a decadal-scale decline in CO2 after the 1940s peak (shown in Fig. 24) contradicts the viewpoint that sharply rising anthropogenic CO2 emissions after 1945 led to tandemly increasing CO2 concentrations. Consequently, these direct CO2 measurements – tens of thousands of them from across the world – are rejected by the gatekeepers of the humans-did-it narrative.
Further, the stomata-derived CO2 values also indicate the temperature is the leading factor determining the CO2 concentration, with the CO2 changes correlationally (r = 0.67) lagging the temperature changes by about a year. This once again conflicts with the conclusion that CO2 levels are determined by anthropogenic emissions.
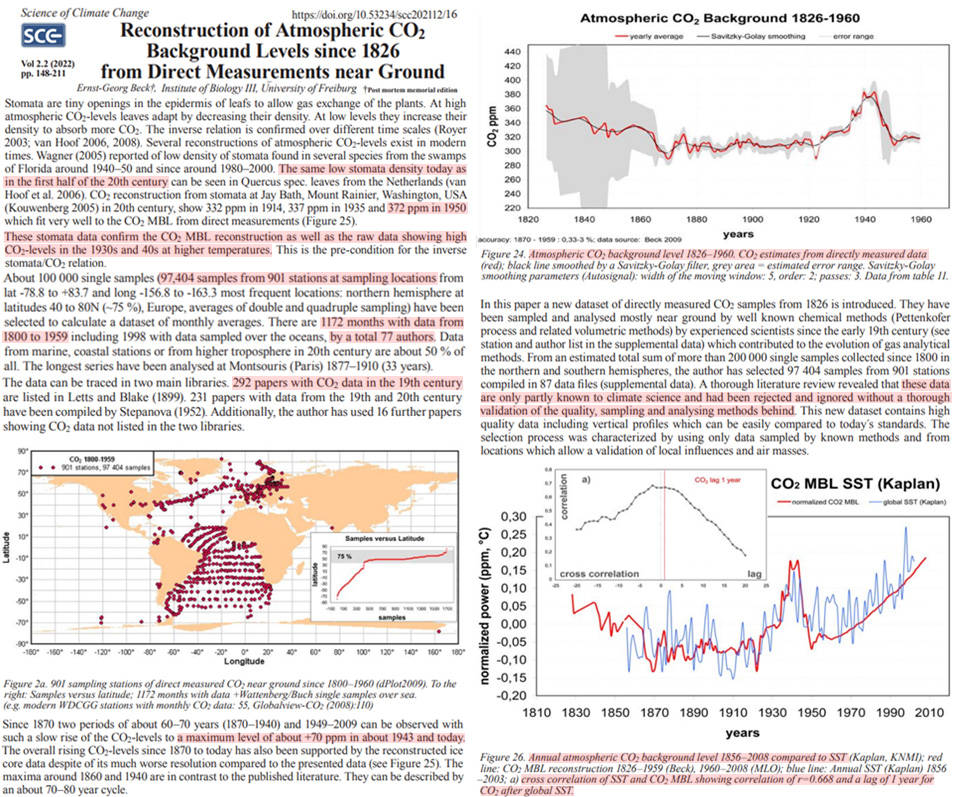
Image Source: Beck, 2022
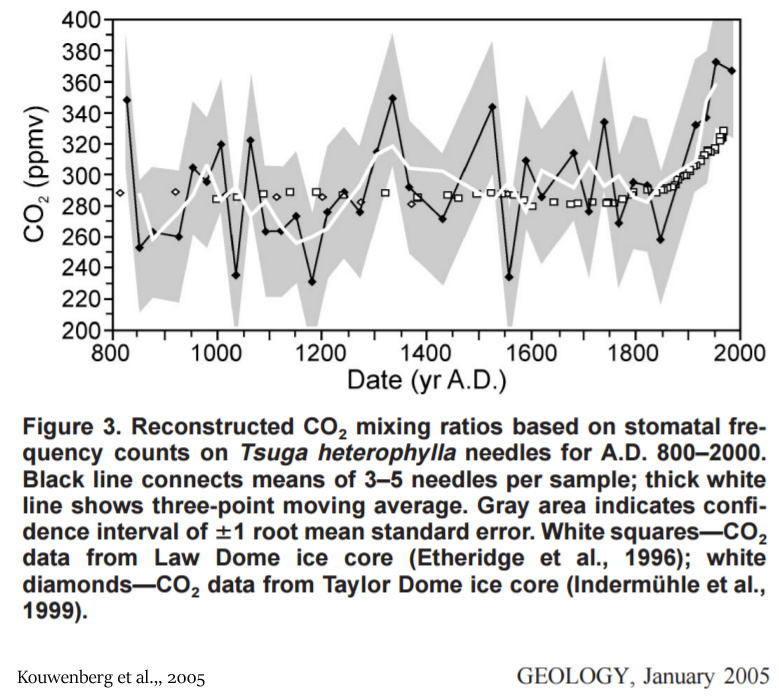
Another stomatal CO2 study published nearly 20 years ago also documents ±100 ppm CO2 changes over the last few centuries, with a peak of about 380 ppm in the 1940s. Like Beck’s work, this too must be rejected, as it doesn’t align with the human-caused angle.


[…] Read more at No Tricks Zone […]
Again reinforces the notion that CAGW is a Political and Religious weapon, nothing to do with Science.
Thankyou Pierre!
[…] From NoTricksZone […]
K Richard
King of Junk Science
Constantly embarrassing this website and fellow conservative with his myths that CO2 Does Nothing and CO2 is 97% Natural. A Double Climate Nutter. Claims almost 100% of climate scientists since 1896 have been wrong. 100,000 studies are all wrong. Lindzen is wrong. Happer is wrong. Roy Spencer is wrong/ It’s a global conspiracy to hide the fact that CO2 is 97% natural (it’s actualy 33% from manmade sources, not 3%.
The declining C14 trend and declining C13 to C12 ratio trend agree. But they are not necessary for the OBVIOUS conclusion
Humans added about +250 ppm CO2 and atmospheric CO2 went up +140 ppm since 1850. A simpleton could figure out where the +140 ppm increase came from. But not K. Richard.
Improve the website significantly by getting rid of the K. Richard “contributions”
Richard Greene, the King of Hubris, all over the internet pushing his flawed CO2 claims.
“Humans added about +250 ppm CO2 and atmospheric CO2 went up +140 ppm since 1850. A simpleton could figure out where the +140 ppm increase came from.”
If he chose to ignore the outgassing from the oceans which occurs with temperature rise and which precedes CO2 rise, and is in constant flux. The annual global exchange of carbon dioxide between the oceans and the atmosphere is estimated at more than 549 billion tonnes.
The current mantra that 280ppm of CO2 was a stable component of the atmosphere prior to the “Industrial Revolution” is based on the conclusions of Callander 1938, because it suits the UN narrative. He selected readings within a very narrow band and rejected higher values that didn’t fit his theory. Whilst chemical analysis has been dismissed by the AGW protagonists, Callander selected from those same chemical analyses. The CO2 values of Beck, highlighted above, had been voiced half a century earlier, in this paper:
OCTOBEB 1955 MONTHLY WEATHER REVIEW 225
HAS THE AMOUNT OF CARBON DIOXIDE IN THE ATMOSPHERE CHANGED SIGNIFICANTLY SINCE THE BEGINNING OF THE TWENTIETH CENTURY? GILES SLOCUM
U. S. Weather Bureau, Washington, D. C.
manuscript received November 4, 1954; revised October 7, 1951
“Duerst and Ereutz found values of 400 and 438.5 parts per million, respectively, from observations made in 1936 and 1939. Duerst based his mean on 500 observations, a reasonably large number, if his techniques are correct.
Kreutz made about 25,000 observations.”
What is Pre-Industrial? Hawkins et al 01 Sep 2017
ESTIMATING CHANGES IN GLOBAL TEMPERATURE SINCE THE PRE-INDUSTRIAL PERIOD
“…some anthropogenic warming is estimated to have already occurred by 1850 (Hegerl et al. 2007; Schurer et al. 2013; Abram et al. 2016) as greenhouse gas concentrations had started increasing around a century earlier. On the other hand, the 1880s and 1890s were cooler than the preceding decades because of the radiative impact of aerosols from several volcanic eruptions, which may have compensated for the earlier anthropogenic influence.
It is therefore plausible that a “true” pre-industrial temperature could be warmer or cooler than 1850–1900, depending on the balance of these two factors. A key question which we will consider is how representative the 1850–1900 period is for preindustrial global average temperature.”
The current representation of “Pre-industrial” was decided by a UN panel, how scientific.
1981, NASA’s James Hansen put out a paper showing a lack of correlation between CO2 and temperature, although I doubt it was his intention:
SCIENCE 28 August 1981, Volume 213, Number 4511
“Climate Impact of Increasing Atmospheric Carbon Dioxide”
“The most sophisticated models suggest a mean warming of 2° to 3.5°C for doubling of the C02 concentration from 300 to 600 ppm . The major difficulty in accepting the theory has been the absence of observed warming coincident with the historic C02 increase. In fact, the temperature in the Northern Hemisphere decreased by about 0.5°C between 1940 and 1970, a time of rapid C02 build up. In addition, recent claims that climate models over-estimate the impact of radiative perturbations by an order of magnitude, have raised the issue of whether the greenhouse effect is well understood.”
Your ad hominem on Kenneth Richard is unwarranted.
Dennis
I read over a dozen climate and energy articles every day of the year to publish a daily recommended reading list
https://honestclimatescience.blogspot.com/
I know that almost every skeptic scientist ON OUR SIDE believes there is a greenhouse effect and the large increase of manmade CO2 increased it
There is much disagreement on the climate in 100 years but almost no disagreement where the extra CO2 came from
I clearly explained in my prior comment that humans added far more CO2 than the +140 ppm CO2 increase since 1850
That means nature was a net CO2 absorber
There ar only two players in the CO2 game
Humans and Nature
This could not be more simple
But the CO2 is Natural Nutters never change their minds
Based on ice core data, a +1 degree C. ocean warming will outgas +15 to +20 ppm of CO2 to the atmosphere with NO manmade CO2 emissions
If there are manmade CO2 emissions the +1 degree C. warming of the oceans since 1850 ONLY means the oceans would have absorbed 15 to 20 ppm less CO2 than they would have absorbed with no ocean warming
i have been trying to refute CAGW predictions for 26 years
Conservatives perpetually stuck on stupid climate myths make that goal impossible
Rather than refuting the prediction that CO2 emissions are dangerous and must be limited, the Nutters claim CO2 is 97% manmade, or there is no AGW, or there is no greenhouse effect.
These are stupid conservatives, contradicting the anti-CAGW scientists ON OUR SIDE, such as Lindzen and Happer, and a gift to leftist fact checkers.
This is a climate propaganda battle
Conservatives are losing.
People like Richard are on the wrong side by promoting myths that make the leftist fact checker’s job easy.
And you too.
“That means nature was a net CO2 absorber” (Richard Greene)
Indeed, Photosynthesis is working very effective.
Our atmosphere contains 19% of Oxygen and only 0,32-0,42 % CO2.
A question could be how this is above the “Tree Line”, where due to airtraffic and spacetraffic lots of polutions are emitted. Food for study ………………??
By the way 1: There are many other gasses than CO2 that are much more dangerous (e.g. Methane e.a.).
By the way 2: It is much more likely that the temperature raise on Earth is originating from a long-term cycle of approx.100-1200 years from our star “The SUN”. It seems everybody in the IPCC is forgetting to consider the long term cycles of our SUN:
I. Roman Climate Optimum Between 200 BC and 150.
II. Late Antique smaller Ice Time 450-700;
III. Medieval Climate Optimum 830-1170 (Vikings on Greenland);
IV. Maunder Minimum 1645-1715 (17th century Ice Landscapes on paintings).
The next optimum in temperature will probably be approx. 2150-2400.
Like the well-known smaller cycles of the sun of 12-14 years, there seems to be a longer cycle, which is known to those who study the past. It is difficult for human beings to understand things that go far beyond their own lifetime!
Long-term Cycle time of our SUN is apparently approx. 1000-1200 years. By the way the shorter cycle-time was already known in biblical times in old Egypt (7 fat years and 7 meager years).