Global sea ice stable for 38 years
By Kenneth Richard
Everyone knows that climate change is normal occurs naturally, at times rapidly, and that there is really nothing we can do about it. Amazingly, with some climate aspects, there has not been any change in about 40 years.
According to NSIDC sea ice trend data, from 1979 to 2006, the sea ice losses for the Arctic (purple trend line in graph below) were effectively counterbalanced by the sea ice gains in the Antarctic (green trend line), producing a conspicuously flat trend line in global sea ice.
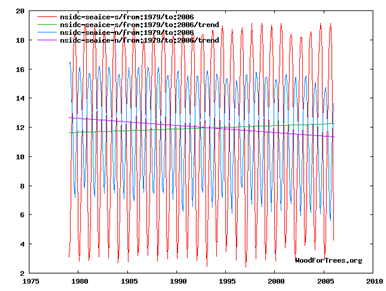
Global sea ice has remained unchanged over the past 38 years, as measured by satellite. Source: woodfortrees.com here.
From 2006 to 2016, global sea ice trends have also been remarkably stable despite a massive increase in anthropogenic CO2 emissions during this period. In fact, the sea ice gains in Antarctica have perhaps modestly superseded the losses in the Arctic, resulting in a very slight increasing overall trend in global-scale sea ice during the last 10 years:
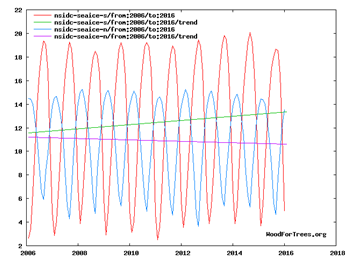
Overall trend surprisingly shows slight increase. Source. woodfortrees.com here.
In 1979, global atmospheric CO2 was measured at 337 ppm. In 2016, global atmospheric CO2 has exceeded 400 ppm.
For both hemispheres combined, then, the addition of about 65 ppm of atmospheric CO2 concentration since 1979 has apparently had no overall effect on global-scale sea ice trends.


Sir, we got a signal! Shall we add some noise?
Folks, in science, we struggle to get a signal. So we look at the best way and place to find one.
So we are looking for a signal of warming and amplification in the polar regions. The place to look at, is the arctic. It has multi year sea ice, which can vanish over time, amplifying the signal. We should also look at summer sea ice, possibly sea ice minimum. These are indicators that will show a signal first and the strongest.
We should also study the antarctiy, finding a signal there would massively improve the basis of our theory.
What we should not do? add the two places together. That is just a moronic idea, you can basically directly see that the resulting graph is basically only noise.
Oh, and you do know that Arctic sea ice is actually anomalously high compared to the Holocene average.
During the first 3/4 or more, zero summer sea ice was pretty much the norm. Then the world started to cool.
The reason Arctic sea ice is still so high is that it is still struggling to recover from the coldest period of the last 10,000 years.
RE – sod’s wanting us to not “add the two places together,” since that would show him wrong.
Heidi Cullin does the same thing here in testimony to Congress, when confronted with data that show she’s full of, uh, hot air.
https://youtu.be/hoCUe-BvX5I?t=192
That whole thing is worth watching to see how the Congressman sets her up to reveal her hypocrisy. Gotta say this for the warming cultists, no lie is too big to tell to defend their hollow ideology.
“Heidi Cullin does the same thing here in testimony to Congress, when confronted with data that show she’s full of, uh, hot air.”
Nope, she is not. I really urge everyone to watch the video:
https://www.youtube.com/watch?v=hoCUe-BvX5I&feature=youtu.be&t=192
Climate change will have different effects in different regions. by adding things together, you obscure the signal. Simple truth.
Many scientists have issued forecasts earlier claiming to know what future climates for particular regions would be like. Unfortunately for them they have had a horrendously miserable record when it comes to accuracy. Instead of more hurricanes, we have seen less. Instead of an expanding Sahara, we have seen it shrinking. Instead of drought-stricken summers in Europe, 12 of the last 14 have been normal or wetter. Instead of Antarctica melting, it has expanded. Instead of the Arctic disappearing in 2013, it has stabilized. Instead of the temperature rising 0.4 degrees over the past 2 decades, it has hardly done anything at all… etc. etc. etc.
And you’ll note Heidi is a radical activist in this field, and not an objective observer.
“What we should not do? add the two places together.” – sod
“Heidi Cullin does the same thing…”- Me
“Nope, she is not. – sod
“We should not look at the nation as this average…” – Heidi Cullen
“Climate change will have different effects in different regions.” – sod
No, not the same thing at all. //s//
This is why it is impossible to attempt to communicate with you. You are oblivious to anything but the warmist narrative, and impervious to facts. No matter how “simple” the truth, you deny it and attempt to rewrite it. So, as they say in the now free UK, “sod off!”
Bonus material on Heidi Cullen
https://stevengoddard.wordpress.com/2015/09/26/the-complete-takedown-of-heidi-cullens-indiana-temperature-fraud/
Like sod, everything she knows is wrong.
Sod, the theory is CAGW. The G refers to global, thus the MEAN global T must rise, the mean sea ice extent must decrease, global sea level trend must increase, global tornadoes must rise, global floods must increase, the rate of global sea riseust rise, and all the global change MUST be catastrophic, and clearly outside of recent past global flux.
Your defense is sad for Sod. It makes as little sense as the EU saying water does not hydrate. Sorry Sod, sadly silly statements seriously suck.
“What we should not do? add the two places together. That is just a moronic idea, you can basically directly see that the resulting graph is basically only noise.”
Sas the warmunist who continues to proclaim that GLOBAL AVERAGE TEMPERATURE is a meaningful metric.
Sod is a mathematical nincompoop so this is not directed towards him but to everyone else: You get an AVERAGE by adding x signals together and then divide by x.
You see, sod is talking out of both ends of his mouth – he is a propagandist who wings it as he goes along, and does not care for logic – his objective is to SOUND smart.
“Sas the warmunist who continues to proclaim that GLOBAL AVERAGE TEMPERATURE is a meaningful metric.”
I will explain it to you again.
we are looking for a signal. so we start, by looking at places that show the strongest signal.
If we are looking at UHI effect, we would look at towns that grow a lot.
You should not look at a single town, as this would possibly be a special effect only in this town. So we chose a couple of towns and form an average. that is what science does.
if you add rural thermometers, you weaken the signal.
If your theory says (as it does, sort of)) that UHI effect is strongest at night, you should not add temperatures from towns at the other side of the globe, obscuring the signal.
This is science, but it is not rocket science. It is pretty easy to understand folks!
SOD, please desist. I hate to see people make complete and utter fools of themselves in the way that you do.
“– his objective is to SOUND smart.”
Not working !!!
“Not working !!!” – AndyG55
Nope. In fact the response he provokes is the opposite of what he seeks to elicit. …sort of like trying to put out a fire by throwing gas on it.
“It is pretty easy to understand folks!” – sob
Yes, it is, which is why it’s all the more sad that sob doesn’t “get it.”
“What we should not do? add the two places together. That is just a moronic idea,…” – sod the pontificator
Right. Because “global” only means “global” when it’s convenient to the narrative. Sheesh!
LOL Never an idea so bad that a warmist won’t embrace it.
Isn’t it amazing that in the whole of the satellite records, despite polar amplification and large rises in CO2…
There has been ZERO warming in the Antarctic, and actually a slight cooling trend.
There are many places that there is no warming… warming isn’t global.
In fact the ONLY warming in the whole of the satellite record has come from natural ocean cycles and solar driven El Nino events.
Solar Cycles 25 and 26 don’t look like providing that solar boost.
The mythical AGW era is pretty much over !!
“The mythical AGW era is pretty much over!!” – AndyG55
Thankfully so.
But don’t worry. When cooling begins I’m sure they’ll come up with a scam about that.
To clarify.
I’m not happy that REAL warming is probably over, because cold kills more people. What I’m “thankful” about, or will be when the warmists run back into their holes, is that warmism will finally be exposed for the fraud that it is.
Agreed completely
Extra warming, and above all, extra atmospheric CO2, would be highly beneficial to the planet in general.
Unfortunately, that extra warming is not going to happen 🙁
The ONLY good thing about a cooling trend will be to highlight the AGWSCAM to all those who care to look.
Poor sob.
Basically zero change in GLOBAL sea ice in 38 years.
Or are you saying we should cherry-pick just that region that is declining from natural ocean oscillations.
It is called “global warming” isn’t it, bozo.
It will be hilarious to watch you and your anti-science AGW mates squirming and worming over the next few years as the Arctic sea ice starts to increase now the AMO is heading downwards again.
Please promise you will stay to be ridiculed. 🙂
AndyG55:
It is far to late to ask; he has long been ridiculous.
two words for sob
MARKET PENETRATION
Awe, gee whiz. No “sea change” in the auto market, either. 😉
Skeptics must somehow be to blame?
This is for Sod.
In the second edition of Climate, History and the Modern World, Hubert Lamb specifically warned of the danger of attributing human causes to natural climate fluctuations. His advice was to continue researching climate and to keep watch on the impacts of change, but not to attribute too much to the idea of the importance of human activity.
Lamb wrote, “In fact, from about the beginning of this century up to 1940 a substantial climatic change was in progress, but it was in a direction which tended to make life easier and to reduce stresses for most activities and most people in most parts of the world. Average temperatures were rising, though without too many hot extremes, and they were rising most of all in the Arctic where the sea ice was receding. Europe enjoyed several decades of near-immunity from severe winters, and the variability of temperature from year to year was reduced. More rainfall was reaching the dry places in the interiors of the great continents (except in the Americas where the lee effect, or ‘rain-shadow’, of the Rocky Mountains and the Andes became more marked as the prevalence of westerly winds in middle latitudes increased).
…
And the monsoons became more regular in India and west Africa. Planning on the climatic statistics of the preceding decades was in fact allowing wider safety margins for many activities than was apparent up to some time about 1950.”
End of quote.
The following paper confirmed Lamb’s remark by assessing how climate zones changed during the 20th century based on the Koppen classification System modified by Trewartha (KTC)..The relevance of the KTC system is that the temperature and precipitation criteria are based on plant ecology. This subsumes animal ecology because animals depend on plants.
Belda, M., Holtanová, E., Halenka, T. and Kalvová, J., 2014. Climate classification revisited: from Köppen to Trewartha. Climate research, 59(1), pp.1-13.
Paper:
The URL may require patience, but it does work. The Belda web site has supplementary information and maps.
This study is probably the best to date in reconstructing the Koppen-Trewartha climate classification map using global gridded data. The maps constructed by the authors show the climate regions of the world (except Antarctica) for two periods, 1901-1931 and 1975-2005, based on CRU(UK) global temperature data interpolated to a 30 minute grid, average area about 2500 km2. Precipitation data was from a separate source.
(About 50,000 grid cells cover 135 million km2, the land area of the Earth except Antarctica.)
Between the two periods separated by 75 years, 8% of the cells changed climate type. When you plot a scatter diagram of distributions for the two periods, you will find there is little divergence from the straight line passing through the origin and with slope unity. R-squared is 99.5.
The paper does not discuss error bars. However, the climate date has since been revised to remove wet bias. This correction would increase R2 by reducing the number of cells that have changed climate type. Since a large percentage of changed cells shifted because of increased wetness, the correction for wet bias may significantly reduce the estimated changes in climate zones during the period 1901-2005.
In any other field of Earth science, using data with similar precision, we would conclude that we cannot reject the null hypothesis that the two data Koppen-Trewartha climate maps, separated by 75 years, are not significantly different.
We can accept that the Earth has warmed a little and some places now get little more precipitation, and most people worldwide are much better off than their parents and grandparents. In relative terms, the people benefiting the most from the changes are those on the margins of steppe to desert and those on the margins between ice and tundra. But they are few in number.
Thanks, very good link, very interesting article.
I would advice everyone to take a look: (especially to page 11 of the pdf)
http://www.int-res.com/articles/cr_oa/c059p001.pdf
But it does not say at all, what you think it does. That a desert in 1920 is still a desert in 1995 is no surprise. These are very different types of climate zones. we will need a serious increase of temperature over a serious amount of time to change a jungle to a desert!
https://books.google.com/books?id=96eFAgAAQBAJ&pg=PA12&lpg=PA12&dq=%E2%80%9CIn+fact,+from+about+the+beginning+of+this+century+up+to+1940+a+substantial+climatic+change+was+in+progress,&source=bl&ots=Rr8psjKW2s&sig=apNVU-oSJZvGtrejuwiGyBUlBUM&hl=en&sa=X&ved=0ahUKEwjQiZvB7e_NAhUM5mMKHSQnCncQ6AEIIjAB#v=onepage&q=%E2%80%9CIn%20fact%2C%20from%20about%20the%20beginning%20of%20this%20century%20up%20to%201940%20a%20substantial%20climatic%20change%20was%20in%20progress%2C&f=false
sod never tires of being 100% wrong.
http://www.co2science.org/subject/d/summaries/desertification.php
(more elaboration on some of what your post covered)