By Matti Vooro
Recently I happened to look through some scientific papers and articles on global warming and the various forcing factors that affect our climate.
One that caught my eye was a paper by N.A. Krivova and S.K. Solanki [2003] called: Solar variability and global warming: a statistical comparison since 1850.
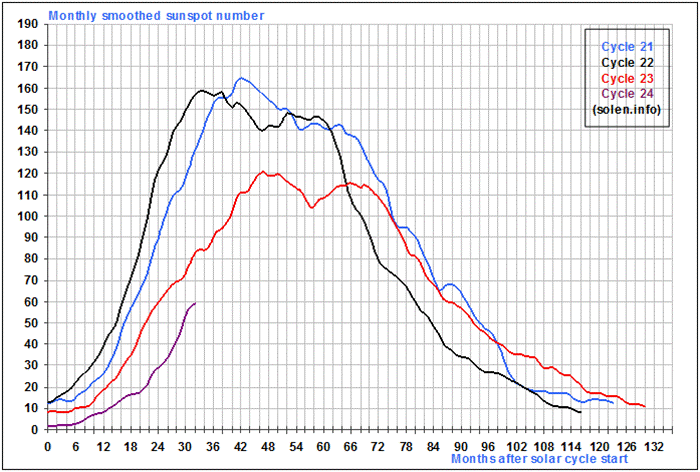
http://www.solen.info/solar/cyclcomp.html, web page prepared by Jan Alvestad
In the conclusions of the paper they state:
We have shown that even in extreme cases that solar variability caused all the global climate change prior to 1970, it cannot have been responsible for more than 30% (50% for the intercalibration Willson, 1997) of the strong global temperature rise since 1970.”
WUWT also reported the authors saying (emphasis added):
However, it is also clear that since about 1980, while the total solar radiation, its ultraviolet component, and the cosmic ray intensity all exhibit the 11-year solar periodicity, there has otherwise been no significant increase in their values. In contrast, the Earth has warmed up considerably within this time period. This means that the Sun is not the cause of the present global warming.”
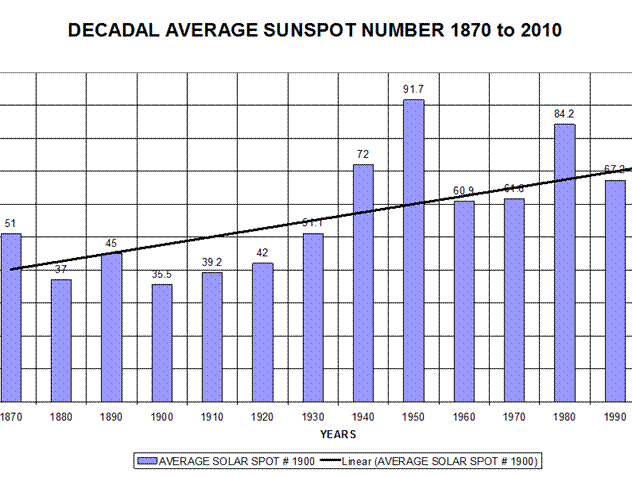
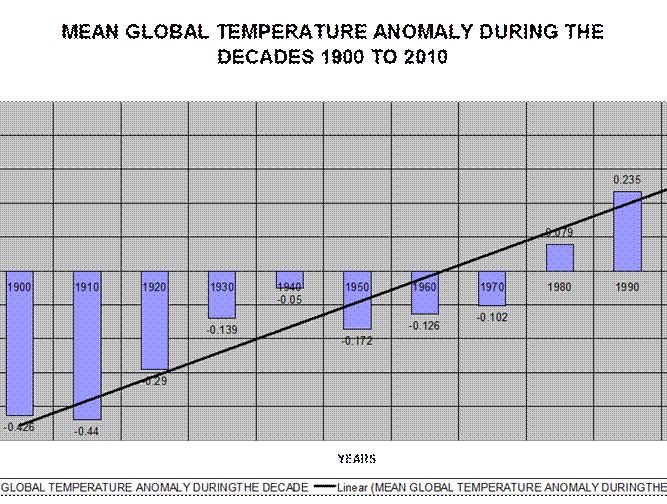
While I agree that the sun was most likely behind all the warming since 1850 and earlier, I cannot agree that the sun was not behind the warming since 1970. The link may not be immediate or short term but a lagged connection nevertheless. The average decadal sunspot number during the 1980s, 1990s and 2000s were 84.2, 67.2 and 49.6 respectively. The average mean global temperature anomalies during the same decades (HADCRUT3GL) were +0.079°C, +0.235°C, and +0.411°C respectively.
I went back and crunched the numbers for UAH satellite global temperature data and got mean temperature anomalies of -0.135°C, -0.0295°C and 0.0178°C. So on a decadal basis the sun and the global temperatures seem not to be correlated when measured by satellite or ground stations during the last 3 decades. Was Solanki correct then after all?
No. And there may be a logical explanation. Let’s take a decade at a time. The two graphs at the end of this article illustrate the average decadal sunspot numbers and average global temperature anomalies (hadcrut3gl) for the period 1900- 2010. But first the last 3 decades:
2000-2009 average decadal sunspot number was 49.6, down from 67.2 the decade before. The average decadal mean global temperature anomaly was 0.411°C up from 0.235°C the decade before.
* The actual solar activity was naturally down since solar Cycle No. 23 was declining to its minimum.
* The decade’s temperatures were influenced by the lagged solar Cycle No. 22 and 23 which together had 4 active solar years averaging 113.
* PDO and AMO were mostly positive correlating with a warm mode in the Pacific and Atlantic. PDO stated to go negative in late 2007.
* North Pacific Ocean SST anomalies were rising and then declining after 2005 causing global atmosphere temperatures to stay high [but flat with no rise].
* There were 4 El Nino’s.
1990-1999 average decadal sunspot number was 67.2 down from 84.2 the decade before. The average decadal mean temperature anomaly was 0.235°C up from 0.079°C the decade before.
* The actual solar activity was higher than the following decade but lower than the previous with parts Cycle No. 22 and 23.
* The decade’s temperature was influenced by the lagged Cycle No. 21 and 22 which also had 5 active solar years 131.4.
* PDO was positive the entire decade, AMO was positive about half the decade.
* Significant El Nino in 1997/1998, 1994/1995, 1991/1992.
* North Pacific Ocean SST anomalies were mostly rising except after the 1997/1998 El Nino.
* There were 3 El Nino’s.
1980 1989 average decadal sunspot number was 84.2, up from 61.2, the decade before.
The average decadal mean temperature anomaly was + 0.079C, up from -0.103 C
* The actual solar activity was up with influence from solar cycles 21 and 22
* The decade’s temperatures were influenced by lagged solar cycle 20 and 21 which had 3 active solar years averaging 134
* PDO was positive or warm mode, AMO was negative
* Significant EL Nino 1986/1987 North Pacific Ocean SST anomalies were fluctuating
* There were 2 El Nino’s.
Effect of El Ninos
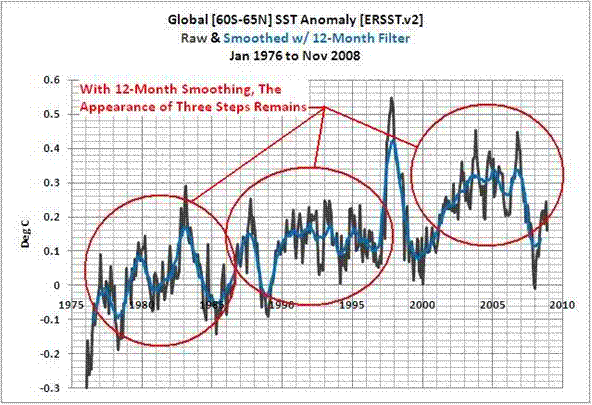
Bob Tisdale in his blog and his article called Can El NINO events explain all of the global warming since 1976 parts 1 and 2 explains how a series of El Niños events could account for the major changes in global temperatures since 1976 through certain key El Ninos . The more significant El Nino in effect were 1997/1998, 1991/1992 and 1994/1995 and 1987/1988. See the graph below from Bob’s blog.
From my own analysis, during positive or warm phase of PDO and AMO, there are significantly greater number (2.5 times) of strong El Ninos than strong LA Ninas and more El Nino months compared to La Nina months .There were less La Nina’s in total as well .
Strong ElNinos seem to follow about 9-11 years after the previous strong solar maximum. 2009/2010 El Nino followed about nine years after the solar maximum period (4 months) of Cycle No. 23. The El Nino of 1997/1998 followed the very active solar maximum period (5 months) of Cycle No. 22. The same happened with the biggest El Nino ever recorded in 1878 which followed the solar max of 1869-1872.
PDO index tracks a spatial pattern of SST anomalies that, when it is cold in the western and central part of the North Pacific and warm in the eastern part of the North Pacific, the index has positive values. A more positive PDO index is typically a result of both more positive and warmer SST anomalies in the NE Pacific in combination with more negative or cooler SST anomalies in the NW and Central Pacific.
The AMO has been basically warm or positive mode during the period 1995-2012. So we have both the PDO and AMO as positive correlating with more warmer water along the coast of North East Pacific ocean and the North Atlantic ocean.
http://i41.tinypic.com/71mbd3.jpg
Summary
There appears to have been a correlation between solar activity and global temperatures going back for thousands of years as given by many peer reviewed papers, some of which have been posted on this blog very recently. In my graphs, the correlation appears to be there for the decades 1900 to 1940′s as the decadal average sunspot number and
the decadal average mean global temperature anomalies seem to rise together. In the 1950′s solar activity and global temperature anomalies went in opposite directions when we had major solar activity (91.7 average decadal solar sunspot number) but the decadal global temperature anomalies were flat or slightly down as the PDO was negative correlating with more cooler water in Pacific North East than in the Northwest and Central Pacific. Also global SST were cooler in the 1950s. Scientists have been looking at
various lag factors and other concepts to get a better handle on the sun/ocean/atmosphere link.
In my judgment the reason why sometime global temperatures and solar activity do not correlate is that the ocean cycles are out of sync with solar effects during certain decades. This was apparent during the cool period of 1950’s to 1970’s where colder ocean cycles in the Pacific and Atlantic as correlated by negative PDO and negative AMO reduced the “lagged” warming effect of some strong solar cycles especially the strong solar maximum around 1956 -1960. Ocean cycles seem to overide or nullify decadal solar effects in certain decades.
Yet during the period 1980-2010, the solar activity was slowly declining but both the Pacific and Atlantic oceans were both positive correlating with a warm mode (AMO and PDO both positiv)], resulting in the global surface temperatures going up while the sunactivity was declining. It is no coincidence that during this last decade when the lagged
effects of the decline of last solar cycle# 23 and the decline of the ocean cycles as reflected by AMO and PDO indices, both of which are now in sync, that global temperatures should also decline. This makes sense to me and it disproves claims that solar effects were not responsible for the 1980 to 2010 global warming.
What follows is the mean global temperature anomaly for each decade. Note overall it correlates with sunpsot activity:
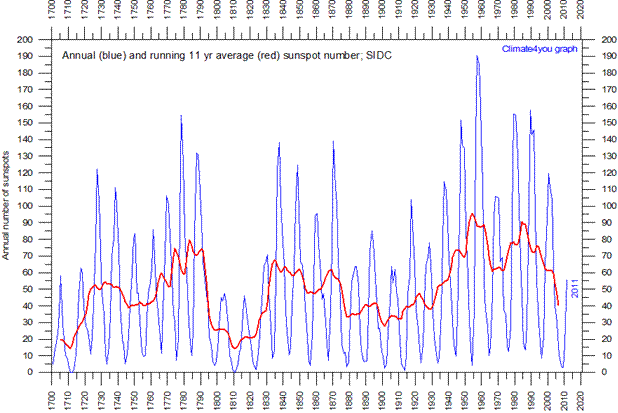
The following chart is from from Climate 4 You sun section web page and illustrates the trend of the sunspot number since 1700. Notice the dips that correspond to cooler periods for the global temperatures including the 1960s, 1970s:
Annual sunspot activity since 1700 according to the Solar Influences Data Analysis Center (SIDC). The blue line shows annual values, red line shows the running 11-year average. Last update: 5 February 2012.


Pierre
In the paragraph
I went back and crunched the numbers for UAH satellite global temperature data and got mean temperature anomalies of -0.135°C, -0.0295°C and 0.0178°C. So on a decadal basis the sun and the global temperatures seem to be correlated . There should be the word “not” after the word “seem”
The actual solar signal and temperature signal seem not to be correalting on first glance for the decade periods of 1980-2000 but when analyzed via a lagged solar effects and the effect of ocean signals , there is a logical explanation as shown later in the article.
Now fixed.
N.A. Krivova and S.K. Solanki [2003]
“However, it is also clear that since about 1980, while the total solar radiation, its ultraviolet component, and the cosmic ray intensity all exhibit the 11-year solar periodicity, there has otherwise been no significant increase in their values. In contrast, the Earth has warmed up considerably within this time period. This means that the Sun is not the cause of the present global warming.”
This is a logical fallacy. It assumes implicitly that there is no storage of heat on the planet; but there is; the oceans. Such a storage introduces an integrating behaviour, and the statement of Krivova and Solanki turns out to be meaningless. This is a quite stunning mistake; as the term “warming up” used by the authors implies that they know that heat is stored somewhere; also, the warmists in general constantly talk about “radiative imbalance”, implying that heat must be stored somewhere. Heck, the very term “Global Warming” implies it. Yet Krivova and Solanki don’t understant the frequency response of such an inert system? What is wrong with these people.
One of the interesting data correlations between the solar signal and ocean temperatures is the so called DIP AND REBOUND period as Bob Tisdale called it, or the period 1870-1940.. The global SST ANOMALIES dipped in temperatures from 1870 to 1910 and then recovered from 1910 to 1940, a kind of V shape. If you now look at the decadal average sunspot number graph in this article or the decadal mean global temperature anomaly, you will see an identical trend . The global temperatures and sun signals do move together
http://i42.tinypic.com/2ibc87o.jpg
Not exactly – rather, during the falling part of the “V” in temperatures, you have three consecutive low intensity solar cycles; it looks like the first of these weak cycles at 1880 starts the falling part of the “V”. So that’s again the response you’d expect from an inert storage; a time-lagged response that turns a sudden drop in input energy into a linear decline in temperature. Rectangular signal in, triangular signal out. (Sorta)
From your linked image we can estimate the typical cooling slope as 0.5 deg C per decade – look at the interval from 1900 to 1910, or from 1940 to 1950 – about the same slope. This is a systemic property – that’s how fast it’ll cool.
Another interesting data correlation that I found was between strong El Nino’s [> 1.4 on the ONI INDEX} and the lagged solar maximum period [a period of higher sunspot number (over 90) around the solar maximum and lasting about 4-5 years]. Of the about 13 strong El Nino’s since 1900, all happened about 9-12 years after the solar maximum period of the previous solar cycle . This may just be just a statistical coincidence or bit of significant information. If it is true that solar maximum periods cause strong El Niño’s about 9-12 months later, and strong El Nino’s seem to cause stepped rises in global surface temperature anomalies, then we may have another part of the puzzle solved. If this true and since 2010 El Nino already may have caused the 2009/2010 El Nino and there are no other solar maximums in the conveyor belt since 2000/2001, there may unlikely be another strong El Nino for many years. Also during past global cooler period’s like1944-1976, there are fewer El Nino’s. And they are naturally further apart [some were as many as 8- 9 years apart, like 1942-1951] Is the next El Nino several years away yet?
This may also be a factor
http://spaceweather.com/archive.php?view=1&day=20&month=12&year=2010
“ALL-CLEAR IN THE STRATOSPHERE: Earth’s stratosphere is as clear as it’s been in more than 50 years.”
This is timely and important because the state of the stratosphere affects climate; a clear stratosphere “lets the sunshine in” to warm the Earth below. At a 2008 SORCE conference Keen reported that “The lunar eclipse record indicates a clear stratosphere over the past decade, and that this has contributed about 0.2 degrees to recent warming.”
Perhaps this article by Tim Ball may be relevant for the explanation.
http://drtimball.com/2012/jet-stream-wave-patterns-further-distort-the-official-global-temperatures/
DIRK H
Yes , I agree.
The v shaped temperature dip was the cooling cycle of late 1800’s and early 1900’s that ran from about1880 all the way to the mid 1920’s . Here again AMO went negative and pdo was fluctuating between negative and positive until 1923 and the oceans were cooling together with the three low soalr cycles that you mention. Solar cyles and ocean cycles seemed to be in sync during this period B y the way the super EL nino of 1978 was the peak of the previous warming period , just like like the peak El Nino’s of the 1940’s and again 1998 were the peaks of the last two warming periods. In all cases the global temperatures declined for 30 years thereafter the warming peaks which is where we seem to be heading now.
M.White and Mindert Eiting
Both very good points . Dr Tim Ball has a wealth of climate science experience and when he speaks I listen . He may be referring to short term jet stream changes that have contributed to heat waves and cold waves via blocked jet streams during the last two years .
Pierre, what is with the ACRIM composite time series which shows an increase of TSI within the period, could it not explain part of the warming?
http://www.acrim.com/TSI%20Monitoring.htm
“While I agree that the sun was most likely behind all the warming since 1850 and earlier, I cannot agree that the sun was not behind the warming since 1970. ”
s. http://www.volker-doormann.org/Sea_level_vs_solar_tides1.htm
V.
VERY nice find at Steve Goddard’s:
http://www.real-science.com/arctic-fraud-worse
Turns out that a few years before the satellite era, in 1974, Arctic Sea Ice extent was pretty low… and the best part: the IPCC had that document in 1990!
They should have told Al Gore before he made AIT!
Is anyone still doubting that it’s all a fraud?
Anyone who continues believing this AGW farce now is beyond all hope. There’s nothing that will change their minds.
Some solar scientists are predicting that the next two or three solar cycles will be significantly down from those high solar cycles with peak sun spot numbers of 157-190 that we experienced between 1940 and 2000. Habibullo I. Abdussamatov is predicting the next three solar cycles to be 65, 45 and 30 in terms of peak sunspot numbers. This is some what similar but also lower from the last three other small past sun cycles between 1878 and 1913, namely #12, #13 and #14 with peak sunspot numbers of 74.6, 87.9 and 64.2. This was also reflected in the significant ocean SST dip of nearly 0.5C degrees as the oceans were in sync with the solar cycles .The monthly global temperatures(hadcrut3) dip was over 1.2C degrees [1978-1910] Regionally the global temperature dips were probably much higher, posssibly as high as 4-5 degrees C. The only difference is that the global ocean SSTs today are not as low as they were back in the 1870/1880 era , the start of that cool cycle. To day they are about 0.3 C warmer , so things may not get quite as cold currently. But I think this illustrates that if the sun does go lower in activity for the next 3 solar cycles as predicted, and it is a big if , then we have clear past evidence which is quite recent of what can happen. It all depends on the validity of the solar forecast.
http://climaterealists.com/index.php?id=1487&linkbox=true&position=6
“The Hot Water Bottle Effect” June 25th 21008
“A change in the heat coming from the sun may not have an immediate effect unless it is in phase with the overall average state of the various oceanic oscillations.”
‘Heat from the sun’ being not raw TSI but rather the amount of energy getting into the oceans changes as a result of top down solar effects altering global albedo as described here:
http://climaterealists.com/index.php?id=6645
“How The Sun Could Control Earth’s Temperature”
….”since 1980, while total solar radiation, it’s UV component and the cosmic ray intensity all exhibit the 11 yr periodicity”….[we will ignore this inconvenient data and state no corrolation]….
A blantant example of cognative dissonance. The reason 1980 was chosen is that the Earth’s atmosphere filters so much solar input that surface measurements are meaningless, so only the post 80 satellite data is important. One trend line is due strictly to ‘human adjustment’. Beginning in the early 1950’s Max Waldmeier of the Swiss Federal Observatory took it upon himself to adjust the world official sunspot number, creating an artificial trend line. Climate is a chaotic energy balance system with binary inputs. One is solar fusion energy and the other Earth’s variable fission rate, which is based on solar and cosmic particle bombardments. In addition to producing fission heat there are ‘elemental atoms’ which then form elemental molecules released in undersea vents. These elemental molecules include the massive Earth CO2 and the SOx necessary for the Svensmark cloud formation hypothesis. More on all of this explained at Faux Science Slayer (dot) com. It is changes in the two base rates of Earth’s fission that set the glacial and interglacial temperature limits.
In my original WUWT post I gave the wrong link for the Solanki-Krivova statement that recent warming could not be due to the sun because solar activity had not continued to rise. I linked to their paper itself when the statement was actually from the Max Planck Institute’s press release about the paper (likely written by Solanki himself):
http://www.mpg.de/496690/pressRelease20040802
A month earlier (July 2004) Solanki said the same thing to the BBC:
“Post-normal science”: in order to heat a pot of water, you have to KEEP turning the heat up. It isn’t enought to set the flame to maximum and leave it there.
Maybe Solanki is not a physicist.
http://en.wikipedia.org/wiki/Sami_Solanki
Oops. Ok. Maybe he bought his diploma. Or he was quoted out of context. Yeah, that sounds good. Out of context.