“CO2 Has Never Been This High In 600,000 Years!”… FALSE!
By Ed Caryl
One item on the list of catastrophes that the CAGW climatists claim is that at nearly 400 ppm, the CO2 concentration has never been as high in hundreds of thousands of years. The number quoted is flexible, sometimes 600,000, sometimes 800,000.
It is true that in the ice core figures, CO2 measures from 180 to 200 ppm during the coldest periods and peaks at around 300 ppm during the interglacial periods. But it is well known that the ice core measurement resolution is a few hundred years for recent times and spreads to a few thousand years for the most ancient measurements. Thus the ice core measurements can’t show short periods of high atmospheric CO2.
This was demonstrated in my last article on the brief spike of CO2 in the Younger Dryas period 12,800 years ago from the paper by Steinthorsdottir et al.
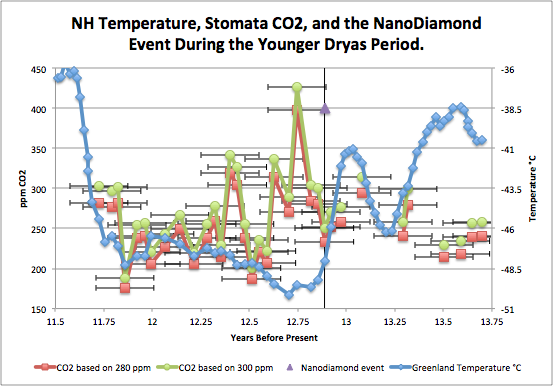
Figure 1
Figure 1 above is a plot of CO2 and Greenland temperature during the Younger Dryas. The purple diamond marks the time of the nano-diamond (ND) event as seen in the Greenland ice cores. The horizontal time error bars on the peak CO2 data bring the ND-event within the time period of the CO2 peak. The stomata index is carbon 14 dated, which has a time error of ±150 years.
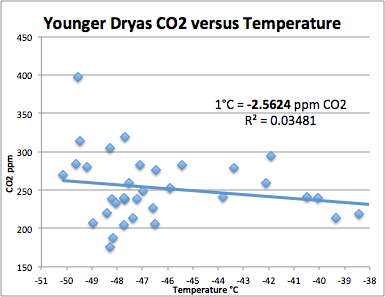
Figure 2 is a plot of temperature versus CO2 concentration from the Figure 1 data. The trend line shows that the relationship is negative; a temperature rise of 1°C occurs when CO2 falls by 2.5 ppm during the 2000 year period covered by the stomata proxy data. The R2 value is very low, indicating that this trend is very likely zero. It is apparent that the brief high CO2 concentration did not cause any warming, as it occurred when the temperature was approaching the lowest recorded by the ice core data.
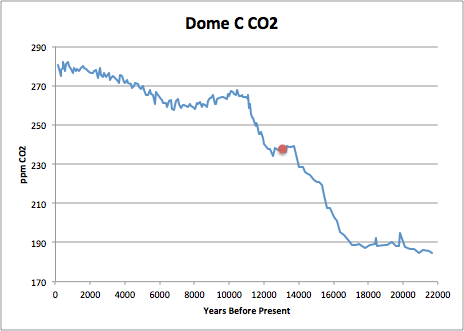
Figure 3 is a plot of the Dome Concordia CO2 measurement over the last 22,000 years. The ND event time is marked by the red dot.
The ice core data can be seen to get smoother as it gets older. Only the stomata data shows the 400+ ppm peak at the ND event. The ice core data cannot show a brief spike in CO2, because at Dome C, the snow (firn) to ice transition takes 100 years or more to close the tiny bubbles that sample the atmosphere.
The ND event was probably caused by a kilometer-size comet that came into the atmosphere over what is now Canada. It likely came in at a shallow angle, like the Chelyabinsk object in February 2013. It is thought to have exploded over the Laurentide ice sheet, with some pieces impacting in what is now Quebec, New Brunswick and Nova Scotia, and others continuing on to impact as far away as the Pacific Ocean. The intense thermal flash ignited all the forests of North America, leaving a soot layer laced with impact-generated particles and raising the CO2 level to more than 400 ppm as seen in southern Sweden in the leaves of the following year.
There is another stomata study, covering eastern Canada. The trees in eastern Canada were burned away, so the stomata data from one location, Pine Ridge Pond, shows a lower peak, and another, Splann Pond, no peak at all. The trees furnishing the leaf stomata needed to re-grow, which took 20 to 40 years or longer, depending on the number of viable seeds in the ground and local conditions. During that time, CO2 was falling back to normal levels.
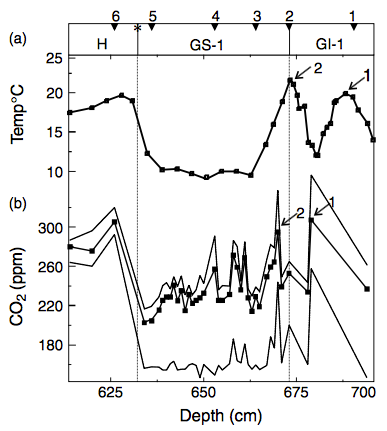
Figure 4 is from Mcelwain, J. C., Mayle, F. E. and Beerling, D. J. 2002. Stomatal evidence for a decline in atmospheric CO2 concentration during the Younger Dryas stadial: a comparison with Antarctic ice core records. J. Quaternary Sci., Vol. 17 pp. 21–29. ISSN 0267-8179.
This data is from Pine Ridge Pond in New Brunswick. The top line is a summer temperature proxy from sub-fossil chironomid remains (Midges). The numbers 1 and 2 marks the peaks of the Bölling and Allerød warm oscillations. The lower traces are the stomata proxies with upper and lower 95% bounds. The number 2 here marks the ND event CO2 peak. The CO2 data point at 1 does not appear in the Figure 1 data from Sweden. The total time for the CO2 level to fall back from 400 ppm to 200 ppm appears to be 100 years or less.
Both Figures 1 and 4 show temperature slowly rising during the Younger Dryas as CO2 concentration is slowly falling.
Figure 1 has a ±150-year error in the carbon 14 age data. The spike in CO2 does not line up with the ND event. In Figure 5, a 150-year correction is applied to line up these dates.
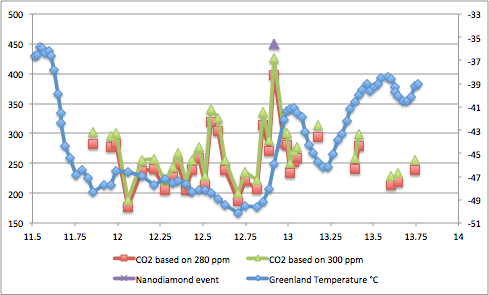
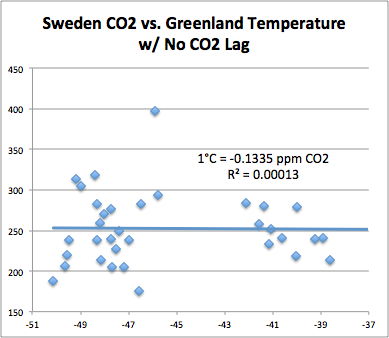
Figure 5 is a plot of the southern Sweden stomata data shifted 150 years to the right to align with the ND event.
Figure 6 below is the corresponding XY plot of Figure 5. In the Swedish data there is no stomata data on the temperature rise out of the YD period between 11,500 and 11,750 years ago. There appears to be no relationship between CO2 and temperature. The trend is very close to zero with extremely low R and R2 values.
There should be a CO2 increase as temperature rises and the oceans begin to out-gas dissolved CO2. We see this increase in the longer Canadian stomata data in Figure 4.
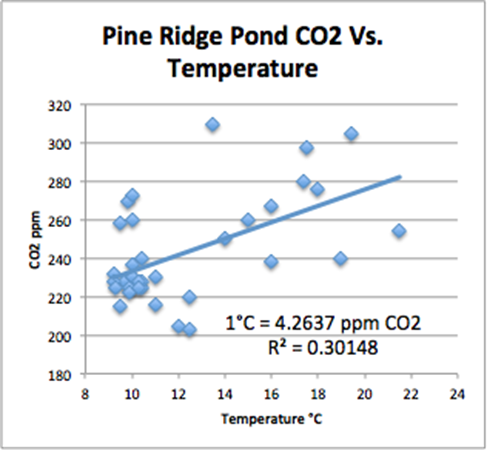
Figure 7 is an XY plot from the Figure 4 data. Here we see that CO2 rises at about 4 to 8 ppm for each degree of summer temperature rise at the Canadian latitudes. There appears to be a small delay of up to 150 years between temperature rise and CO2 rise as CO2 peaks always appear after temperature peaks by about this amount in both stomata data sets.
From these two papers we learn the following:
– A large sudden rise in CO2 decays away in 100 years or less.
– A large sudden rise in CO2 does not cause a rise in temperature.
– A large rise in temperature causes CO2 to rise, not the other way around. All the rises in CO2, including in modern times, came after temperature increases.
– The delay between temperature rise and CO2 rise is somewhere between zero and 150 years.
We can see that delay in modern times. The rise in temperature after the little ice age began in the late 19th century, accelerating after 1910. The rise in CO2 began about the time Keeling started measuring it in 1959, accelerating after that, a delay of about 50 years.
Is the rise in CO2 all due to temperature rise? No. It is a combination of temperature change and increased fossil carbon emissions. Will those emissions cause temperature to rise further? No. The large rise at the ND event caused NO temperature rise in either of the data sets above.
For further information on the Nano-Diamond event see:
– www.jstor.org/stable/10.1086/677046 Nanodiamond-Rich Layer across Three Continents Consistent with Major Cosmic Impact at 12,800 Cal BP. Charles R. Kinzie, et al. 2014
– http://www.news.ucsb.edu/2014/014368/nanodiamonds-are-forever#sthash.Jz8DHJU3.dpuf


Surely if CO2 levels are at their highest for 600,000 – 800,000 years and the average surface temperature is well below its high point then this shows a decoupling of the CO2/temperature link which is the lynch pin of the whole AGW argument.
Even when data is being manipulated, this act inadvertantly throws doubt on the whole AGW hypothesis.
Paul,
even Al Gore could be said to have disproved it. In his movie he showed the ice core figures as a chart of temperature and CO2. In the last 3 (at least) interglacials the temperature rose well above today’s figure even though the CO2 never (supposedly) got above 300 ppm. Clear indication that the concentration of CO2 doesn’t determine the temperature.
Of course he didn’t mention that, nor that he deliberately used an obsolete graph with lower resolution to disguise the rise in temp. leading the CO2 level (and even more that the temperature dropped on average for 1900 years while the CO2 stayed high.
AGW used to mean Anthropogenic Global Warming. I think these days with so many predictions missing the mark and no sign of catastrophic warming AGW now means Any Global Warming. Please just any sort of warming will suffice, just give us warming.
Nah, it’s too late for that already.
AGW today means:
ANY GLOBAL WEATHER
Any way, that claim made me change from a believer to an sceptic.
My reasoning was: “if it is the highest in 600 000y, it means 600 001 years ago it was highest, or at least the same. Why?
And I knew that the Earth was at least 4500 my old. 600 000y is just 0.0015 of all that time. Why do not they talk about the 0.9985 rest of it?
So, I begun to investigate…
Both global temperature and CO2 level have been higher than today for 80 percent of the last 600 million years. See post on temperature and CO2 over geological time by Scotese University of Texas(using proxies such as ice cores)
We know that.