Yesterday I wrote a post about how a 44-year veteran German meteorologist poured cold water on the hypothesis of a man-made global warming and pointed out that a change in temperature instrumentation is probably behind much of the reported warming that Germany has supposedly seen since the 1980s.
Klaus Hager also has a website. At this website he posted a meteorological bulletin, which he authored and was published as an annex to the Berliner Wetterkarte (Berlin Weather Chart).
That bulletin was about the results of his eight and a half year study where he compared in a side-by-side test the former glass mercury thermometers with the newer electronic thermometers, which were installed during the 1980s and 1990s by Germany’s DWD German Weather Service.
Earlier mercury thermometer method
Earlier temperature measurement was done using a mercury/alcohol glass thermometer, where readings were taken ten minutes before each hour. The daily mean temperature was computed using the “Mannheimer” hourly values 07h, 14h, and 2 times 21h, all divided by 4. The DWD used this formula until March 31, 2001. The extreme temperatures were read at the glass thermometer at 7 a.m. as the low, and 9 p.m. for the maximum. Temperature was measured inside an “English” weather hut.
New electronic system
The new electronic system, however, employs a completely different sensor technology, known as the Pt 100, where temperature is measured with two measurement sensors that check each other. Each second a value is generated and measured for an entire minute, i.e. minute mean. The daily mean temperature is calculated from 24 values, each at 10 minutes before the hour (e.g. at 8:50 for 9 a.m.) The extreme is calculated from the minute mean values between 00 h and 24h. Today they are recorded inside a plastic hut with slats (at first made of aluminum).
The advantages and disadvantages are listed in the annex below.
Hager writes that although electronic sensors and the comprehensive IT networking implemented by the German DWD Weather Service do offer many advantages, there are also a number of disadvantages which he says are of importance with respect to assessing climate change, especially when comparing old datasets from the mercury thermometers to the new datasets recorded by the electronic sensor technology. He writes that it’s close to comparing “an apple and an orange”.
Results of 8.5 year side-by-side test
Hager compared the two different measurement systems side by side at the GeiInfoAdvisory Office of Fliegerhorst Lechfeld from January 1, 1999 to Jul 31, 2007. The following is a plot of the differences between the two measurement methods:
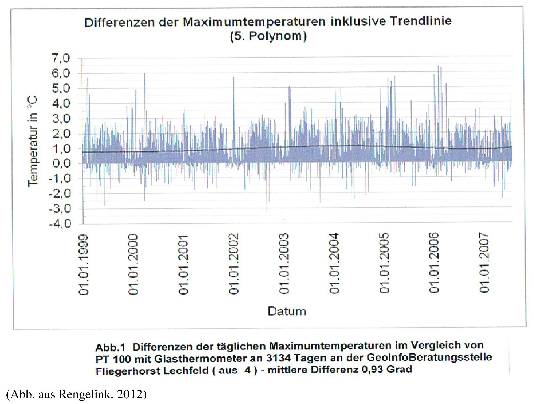
Figure 1: Differences in the daily maximum temperatures from the Pt 100 compared to glass thermometers for 3124 days (ca. 8.5 years) conducted at the GeiInfoAdvisory Office of Fliegerhorst Lechfeld (from 4) – mean difference 0.93°C. Figure from Rengelink, 2012)
Clearly the electronic thermometers produced warmer readings than the mercury thermometers.
Worse, Hager says, the German DWD Weather Service did not adequately investigate the two different measuring systems and compare them, writing that:
Although the DWD set up so-called climate reference stations at (way to few) locations and published the studies from the comparison measurements, the results unfortunately were not satisfactory. Here not the “old data was compared to the new data”, instead only the electronic thermometer was investigated in various locations, but were not compared with the glass thermometers, which are readily at hand.”
Hager provides an example illustrating why one must be very wary when comparing data from the new electronic instrumentation to data taken from the old mercury thermometers. The following chart depicts an example comparison for the temperature measured using the two different methods on a single day, 12 November 2005:
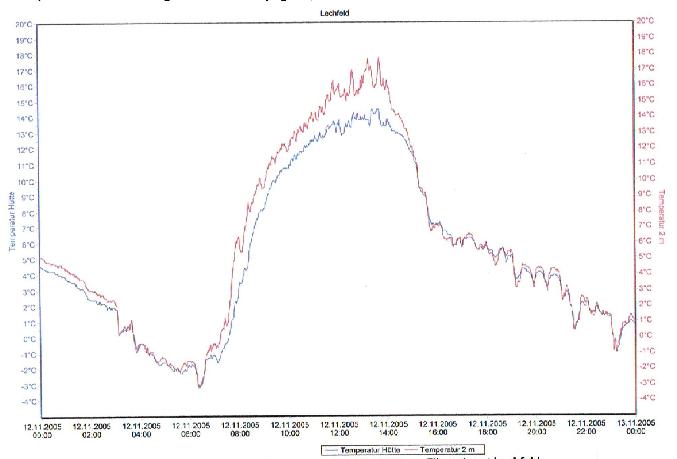
Figure 2: Pt 100 measurements taken on 12 November 2005 at Fliegerhorst Lechfeld (WMO 10856) station. Red curve (upper) is the measurement sensor of the aluminum enclosure, showing daily mean temperature of 5.9°C. Blue curve (lower) is the Stevenson screen, showing daily mean temperature of only 5.2°C.
Hager writes:
Differing daily measured values from the old and new sensors for temperature measurement spurred the author [Hager] to conduct a comparison spanning from January 1, 1999 to July 31, 2006 at Fliegerhorst Lechfeld (WMO 10856) 8-1/2 years long, daily without interruption, among other comparison tests of mercury maximum glass thermometers in a Stevenson screen and a Pt 100 resistance thermometer inside an aluminum enclosure, both unventilated. The 3144 days yielded a mean difference of +0.93°C; the Pt 100 was higher than the mercury thermometer. The maximum daily difference even reached 6.4°C!
You can see the maximum difference in Figure 1, occurring in early 2006.
Hager also writes that the difference was between 0 – 1°C on 41% of the days, 1 – 3°C on 26% of the days, and over 2°C on 15% of the days [Here we assume that Hager made a typographical error and meant “1 – 2°C”]. Only on 15% of the days did mercury thermometers show higher mean temperatures.
Hager attributes the wide range of differences on factors such as cloudiness, sunshine duration, wind speed and air mass changes. The results, Hager writes, show that:
Earlier measured values cannot be compared to the values measured today for longer term temperature datasets without having interruptions in the overall dataset.”
Not only is the temperature sensing method very different than it was before, Hager writes that also the method for determining the daily mean temperature is different and thus another source of discrepancy. Earlier the “Manheimer” hours (7h +14h + 2 times 21h divided by 4 was used. Today the daily mean is comprised of 24 hourly values from 00 h to 23 h divided by 24. “This too falsifies the quality of the recorded values,” writes Hager.
Hager concludes:
This all should give the current science something to think about, because actual practice tells us that there is a necessary rethinking when it comes to the theoretical and numerical approaches used for assessing the swings in climate.”
Annex:
Advantages/disadvantages of electronic measurement
Advantages:
– Considerable personnel costs savings due to elimination of visual readings.
– Possible densification of the measurement network through new sensor locations.
– Up-to-date and immediate availability of measured values.
– Extending the spectrum of measurements, e.g. radiation measurement.
– At times high measurement accuracy due to minimal sensor inertia.
Disadvantages
– Lack of comparability between the old measurements and those of the new sensors.
– Thermometer: formerly glass thermometer, today Pt 100 sensor.
– Precipitation measurement unit: formerly Hellmann pan, today with the teetering unit or the new weight measurement of precipitation.
– Humidity: formerly using the hair hygrometer, today it is the dew-point sensor or capacitive sensor.
– Wind speed: formerly using the cup anemometer, today with an ultrasound unit.
– Snow depth measurement: formerly measured by hand, today with laser or ultrasound device.
– Precipitation type and weather appearance of snow, rain, hail, and cloud observation are done by visual observation.
– Increased maintenance requirements for the sensors done by a maintenance center.
– Sensor downtime of various types with disruptions in the climate dataset.
– Onset of measurement techniques through other evaluations of daily means, see: Temperature Measurement at the DWD “Formerly and Today”.


I hope I got the meteorological instrumentation nomenclature pretty much correct. If someone detects sub-optimal naming of components, let me know.
i like this stuff..!!
climate science : just ignore problems… i said numerous times that a thermometer measures it s own tempereture.. the rest is assumptions…
why should i beleive the guy who says “this is the temperature of the air around?”
When I first saw his claim in the article, I was hoping that he could back it up. Now that I see his post I realize that I was naive;
Of course he can back it up! I’ve been here 35 years. This is exactly the kind of work that I expect from Germans, especially of his generation! He has dotted every i, crossed every t and triple checked every figure – I’ll bet my last Mark on it!
P, although I also can’t vouch for the nomenclature, the translation is very solid, Great Job!
It throws into doubt all the half baked assumptions of the alarmists, and their lunatic suppositions.
In any analysis. Evidently, what ever instrumentation is used and particularly for comparable measurements taken in the distant past [and indeed – up to the present day]. How do we know, can we tell – just how much can these readings be trusted and I don’t wish to denigrate those scientists taking the readings – just the calibre, grading and graduation, accuracy of their temperature measuring instruments.
Further, formulating any sort of tenable hypothesis using statistical analysis using historical data is to say the least a dubious methodology but using these spurious extrapolations to warn of extreme climate fluctuations in any direction [warming or cooling] is akin to moonbeam assessment and gathering – a pastime only for space cadets and EU politicians.
Back to the drawing board, or just take: satellite readings as standard……..
Siting of the automatic weather stations looks more than slightly problematic, like the one at the St Augustin monastry pictured on Hager’s web pages. The automatic weather station is mounted atop the wall, exposed to direct sunlight.
Excellent for estimating the thermal mass of the wall and daily insolation.
Hello Bernd,
The station at St. Stephan, in the center of Augsburg, is just his hobby of late. His real work was done here.
And it’s supposed to be an official WMO station.
“English” weather hut is a Stevenson screen.
Thanks. Pierre you have put into better words the comments I put in the post below and have added actual factual data to illustrate the problem with temperature measurement.
You mentioned in the post also rainfall measurement.
Could I give my experience with rain gauges. I had a small cylindrical gauge which overflowed (100mm) one day and on another day I had to go out in the rain to catch it before it overflow and get a second reading. I decided to buy an electronic one –brand Oregon from USA. I get the existing gauge along side. Very shortly, I found there was a discrepancy with the electronic one reading low. I decided to investigate and calibrate the new instrument. The electronic one was of a tipping bucket type with a count signal sent every 90 secs. I first calibrated the cylindrical gauge by weigh water with a beam balance accurate to 0.005 gr. I found it was accurate to 0.1mm of water poured in. I then checked the electronic gauge and immediately foun an error in the bucket size which gave a low reading in the range 30-35%. Next I found an error in the counts depending on the rate water entered the gauge. I determined some correction factors and recorded twin results for about three months. There were still unresolved variations. It seemed that the electronic gauge could not cope well with high rainfalls for 100mm in a day or with very low rainfalls (the minimum bucket tip was 0.4mm) such as 0.2mm dew in the morning which occurs frequently. The signal was prone to interference (during storms) and was affected by battery life which was short. I decided to discard the electronic gauge and bought a larger cylindrical gauge which I read every morning. The new gauge has the standard funnel size of 203mm diameter . The internal cylinder is accurate to 0.1mm over 25mm. There is an external cylinder which takes overflow upto 500mm of rainfall. I have been recording rainfall now since 2008 but have obtained rainfall data from several official weather stations within 15km (the main less than 5km away but closed 10years ago) and have a record going back to 1893.
It would be useful for Dr Hager to also examine rainfall data. One AGW fear spread in Australia was that there would be less rainfall. For this reason governments in five states were persuaded to build unnecessary desalination plants for $billions which now stand idle. My records show rainfall is cyclical and that there is no significant change to the rainfall pattern. I have also noted that the rainfall for each month of the year appears to have a Poisson distribution where the variance is nearly equal to the mean and that the maximums for any month over the 120years is 4 t0 8 times the mean (eg the mean for February is 261mm and the maximum (recorded in 1893) is 1819mm). The record for December occurred in 2010 which lead to floods in Brisbane in January 2011(killing people and much damage) partly due to poor operation of the main dam.
Australia has a large (around 0.5C) increase in its official temperatures around 1998 in many of its Eastern stations, at about the same time as the major El Nino, but also around the time that Automatic Weather Stations replaced the traditional manual methods.
There are now enough years after this change to decide if it was a genuine climate shift, or an instrumentation artifact.
I suspect that much of it is based on Shifting Heat Island Trends.
This story was featured on today’s daily episode on the suspiciousObservers youtube channel. Well done.
You have probably seen this one on the western US.
http://wattsupwiththat.com/2015/01/12/another-bias-in-temperature-measurements-discovered/
This throws a big kink into the BEST measurements.
OT: It is 10°F here in W. Bloomfield MI, the sky is a clear blue, and it has been snowing lightly for the last hour. These aren’t little crystals. They are large flakes. I have not seen that before.
Apologies for the ‘off topic’ but what is with the ‘new’ EEX splash screen? The Y axis of the power generation in GW/h?
Seen in a more general view: Errors are common in measuring, but normally these errors should phase out each other.
Isn’t it remarkable that any mistake discovered in climate “Science” screws temperatures upward? Has ther ever been a discovered bias towards lower temperatures except making historical temperatures colder?
Just asking…
Chris Frey
There is a similar increase in the U. S. temperature across a similar time period. See: http://climateaudit.files.wordpress.com/2010/12/hansen2010_fig20.jpg
This coincides with the “great dying” of weather stations in the 1980’s. About half the stations did not switch over to MMTS units. They were simply phased out.