The last couple of days I posted on an 8.5 year side-by-side test conducted by German veteran meteorologist Klaus Hager, see here and here. The test compared traditional glass mercury thermometer measurement stations to the new electronic measurement system, whose implementation began at Germany’s approximately 2000 surface stations in 1985 and concluded around 2000.
Hager’s test results showed that on average the new electronic measurement system produced warmer temperature readings: a whopping mean of 0.93°C warmer. The question is: Is this detectable in Germany’s temperature dataset? Do we see a temperature jump during the time the new “warmer” system was put into operation (1985 – 2000)? The answer is: absolutely!
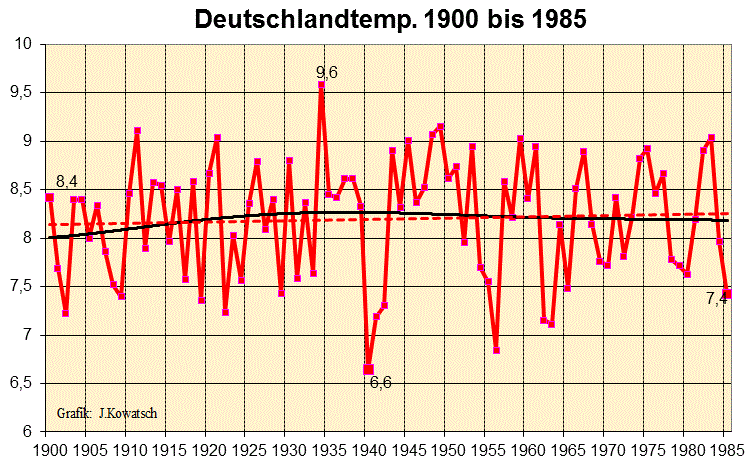
1900 to 1985: almost no warming
Josef Kowatsch, an independent scientist and regular contributor at EIKE, has looked at the German temperature dataset and discovers that Germany’s mean temperature indeed coincidentally jumped by a similar 0.9°C during the same period. First he sent me a chart depicting Germany’s annual mean temperature from 1900 to 1985, measured using the old glass mercury thermometers:
For 85 years the trend was pretty much consistent, hovering at about 8.2 or 8.3°C. As indicated by the bold black line, there was an increase from 1900 to 1935, followed by a slight decrease from 1935 to 1985, i.e. in a time when CO2 emissions were rising strongly worldwide.
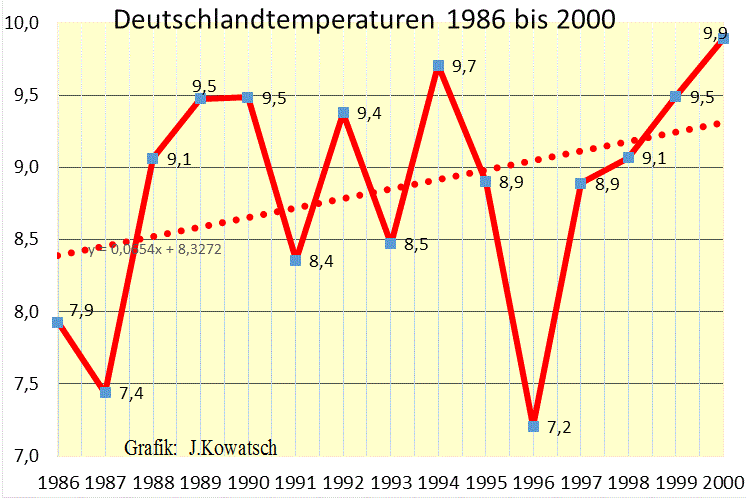
1986 – 2000: massive warming
Next Josef sent me a second chart depicting Germany’s mean temperature trend while the country was transitioning over to the new electronic measuring system, described here, from 1986 to 2000:
Here we see the trend for the period rising strongly, from about 8.4°C to 9.3°C, i.e. precisely during the instrumentation transition period! This too happens to be a rise of 0.9°C, which coincides precisely with the results of the side-by-side temperature measurement test Hager conducted over 8.5 years comparing mercury thermometers to electronic ones. That could be a sheer coincidence, but on the other hand it is screaming to be investigated.
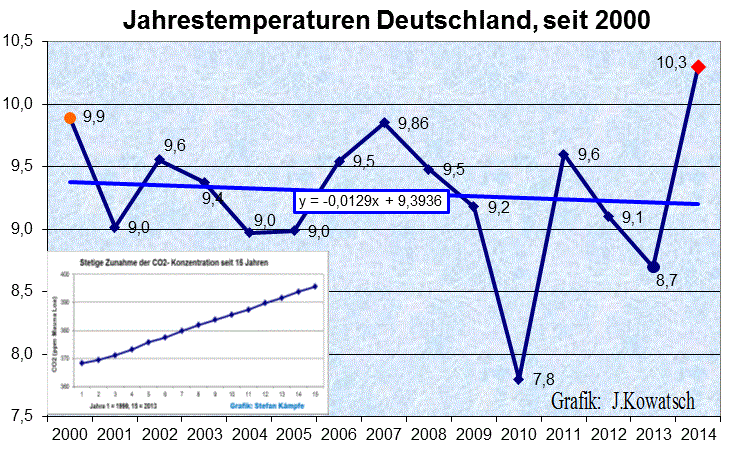
2000 to present: no warming
Next Kowatsch provided a chart showing Germany’s mean annual temperature for period 0f 2000 to present, i.e. the period that has been using the new electronic measurement system:
Here we see there is no longer any rising trend, but that the mean temperature is at a new, higher plateau. As a result, almost the entire mean annual temperature rise Germany has seen since 1900 occurred during the single short 1986-2000 period. Josef Kowatsch commented (by e-mail):
In these 15 years, did CO2’s greenhouse gas effect suddenly go into action? Who switched on the CO2 greenhouse gas effect for these 15 years?”
Moreover, didn’t Germany’s national DWD Weather Service check and calibrate the new electronic system to be sure it would produce results similar to the earlier used mercury thermometers and thus ensure the recording of reliable data? Hager says they never did, and it seems they were quite content to adopt the warmer readings.
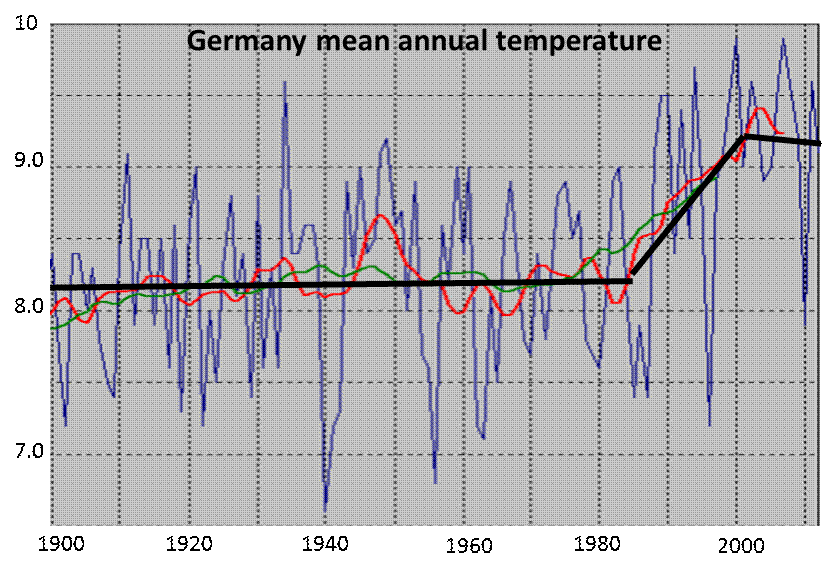
The following chart is a plot of Germany’s mean annual temperature over the entire 1900 to present period:
Chart adapted from here.
To me this all appears to have all the elements of an epic instrumentation debacle that is as bad and sloppy as any could get. Again, I repeat: Hager writes that the DWD never conducted any systematic comparison tests in order to be sure the new electronic ones were producing reliable daily data.
If this is really the case, then we can be happy that the DWD is not in the business of calibrating altimetry systems for commercial jets.
Of course the 1986 – 2000 rise likely is not solely an artifact of poor instrumentation calibration, as part of the warming is surely due to the natural ocean cycles which pushed global temperatures up during the end of the 20th century. However, the results of Hager’s comparison test are difficult to ignore and raise lots of questions.


I would think it would be easy to test the differences now. Using a precisely temperature controlled room, put the two types of thermometers into the room, change temps through an annual cycle, and compare both sets of readings against each other, and against the controlled temp of the room. Many of the problems faced should have been certified/rectified long ago.
Is it unfair to require scientists to explain the extreme year 1940? (see graphic ‘Germany’s annual mean temperature from 1900 to 1985’) “Honi soit qui mal y pense”. “Shamed be he who thinks ill of it”. Actually the winters in Northern Europe in the early 1940th had been suddenly the coldest for more than 100 years. Winter 1939/40:
__GISS-map here: http://www.seaclimate.com/c/c1/images/buch/big/C1_6.png;
__for Denmark here: http://www.2030climate.com/a2005/_Links-rand/11c_942_JF_T_Denmark.htm
Two years ago von Prof. Stefan Rahmstorf published on 05. February 2009, at: http://www.scilogs.de/wblogs/blog/klimalounge/klimadaten/2009-02-05/im-januar-nichts-neues the January temperature for Potsdam/Berlin for about 1880 – 2010, showing extraordinary values for January 1940, reproduced here: http://www.2030climate.com/a2005/02_11-Dateien/b/5.jpg : No question asked, no explanation given! Was that not the fifth months in World War II? Has it had an impact on the winter weather?
“Honi soit qui mal y pense”!
Mutant Claudia Pechstein sues international Sports court for 4.4 Million EUR in damages for damaging her career – she has anomalous blood inherited from her father making her a natural born ice skating champion; got punished for doping as consensus is that her blood values can only arise from doping.
http://www.abendzeitung-muenchen.de/inhalt.sporthistorischer-prozess-pechstein-fordert-4-4-millionen-euro-und-mehr.85cd9d01-01d4-48b3-9688-91562392f0bb.html
Scientific sports court fights microevolution, loses! (or rather, will lose. Big big time.)
We are all different, so I vote for Mutant Claudia.
I, however, have a low RBC count and a high Sed-rate.
I wonder if this came from parents or whether it was acquired?
http://library.med.utah.edu/WebPath/HEMEHTML/HEME007.html
It would be useful to see how much stations changed the very first year the new equipment was installed. Did they then change as much in subsequent years?
I endorse the first comment but would advising starting parallel tests Do it while the personal knowledge still exists because the former workers are still alive.
Those who actually read the the thermometers can show exactly how they worked each day. So can the workers who made glass thermometers and calibrated them. And those who made the Stevenson screens and installed them. The knowledge all still exists.
The costs would be trivial compared to the stakes. In fact, not spending too much would ensure the testing was done better.
What could be more important to bureaus?
It seems obvious that the measurements with electronic thermometers are reading transient peaks in temperature. With the decline in rural sites and the dominance of urban or airport sites used for measuring trends would have made such transients more likely.
Adopting better measurement procedures is a good thing but this leaves the station data behind us as a devilish landscape full of phantom effects. The instrumentation effect on the final summary remains to be seen. How many stations in Germany made the transition when, where, and with what effect. I see before me a cloud of points, dependent upon each other in as far as they come from the same station. The shifts upwards may happen everywhere. With some mild assumptions we may get the effect on the slope of linear regression. If we would have for a certain period German stations with and without the change, we could make a direct comparison for an area of limited size. However, I am afraid that the station data are that compromised that we should better concentrate on satellite data and leave the historical station data, including the BEST project, as a hobby for climate enthusiasts.
Steve Mosher’s opinion on this could in fact be interesting.
And since this is the data that is used to feed the Climate Models, the simulations are actually projecting the next advancement in Thermometer Technology!
The models correlate with Moore’s Law!!!
Eureka!
Is the transition to PT100s unique to Germany? Chances are that other countries did the same, since they all follow the same “best practice”, in which case it’s likely that the whole world has been measured too “hot”
The conclusion of this article may be correct but the argument is rather weak. You cannot resolve the issue just by looking at a single set of data, you must compare data sets from adjacent stations with different instrumentation changes. A step change as large as 0.9C should be easily seen even with simple graphical techniques, looking at DIFFERENCES between seasonal averages from different stations.
I can’t imagine that they didn’t carry out parallel measurements to see if adjustments were necessary.
There’d be reems of documentation if they did.
Most didn’t. Only a small number, it seems, could even bothered to check. Even after WMO acknowledged that there’d be differences.
Here’s a paper that I’ve not yet digested completely which seems to be quite relevant.
“Extreme weather” is programmed.
Further to that, I’ve found some recent “comparisons” including
Laidees and Gennalman! Start your homogenisers!
WMO has guidelines for stations and measuring thermometers.
http://www.wmo.int/pages/prog/www/IMOP/CIMO-Guide.html
Guide for thermometers both glass and electric.
http://www.wmo.int/pages/prog/www/IMOP/publications/CIMO-Guide/Ed2008Up2010/Part-I/WMO8_Ed2008_PartI_Ch2_Up2010_en.pdf
Guide for stations
http://www.wmo.int/pages/prog/www/IMOP/publications/CIMO-Guide/Ed2008Up2010/Part-II/WMO8_Ed2008_PartII_Ch1_Up2010_en.pdf
General guide.
http://www.wmo.int/pages/prog/www/IMOP/publications/CIMO-Guide/Ed2008Up2010/Part-I/WMO8_Ed2008_PartI_Ch1_Up2010_en.pdf
Can´t see how fast glass thermometers reacts when a step-change in temperature comes vs. electric system.
It is very human to not question data that confirms what the collectors want, temperature rise in this case. I have seen this time and again, don’t question data that is within the desired range, data outside the desired range has to be rechecked and confirmed, even though errors in both types of data are equally likely.
“How can it be that the Church, symbol of truth and morality, would accept a science that is built on outright lies, flakey theories, deception and fortunetelling? ”
Seems like a quite ordinary church to me.