UPDATE/CORRECTION:
At Twitter Dr. Ryan Maue writes that the data used at www.wunderground.com is “very wrong”. Dr. Maue even adds that ACE is in fact currently “nearing a peak b/c of El Nino models.weatherbell.com/tropical.php“
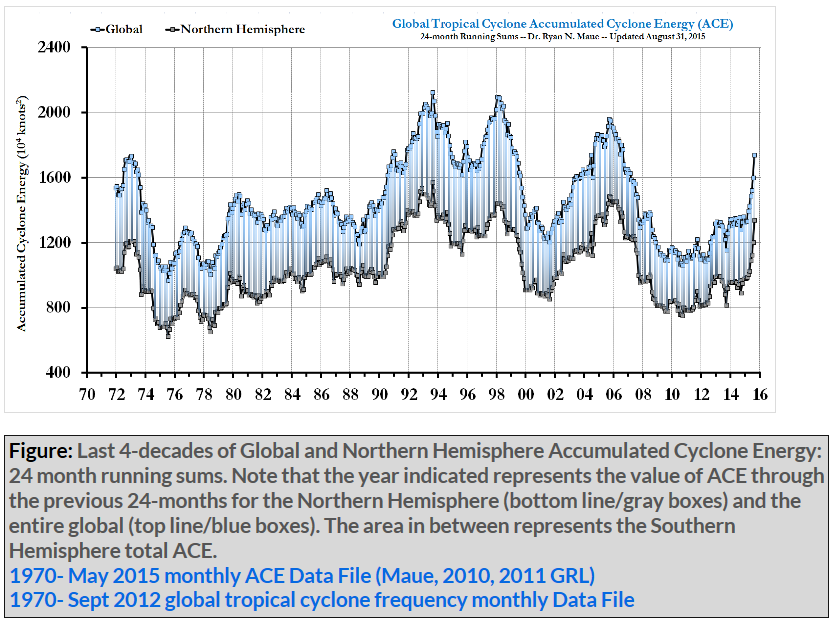
Who’s right? Looks like Dr. Maue has the right figures and the ACE is peaking:
Note: The global 4-year ACE still remains near a 45-year low.
=============================
Even though it is not true, alarmist sites everywhere continue citing “increased storm activity” as evidence of man-made climate change. Yet, when we look at the numbers, we see that nothing could be further from the truth.
At Twitter earlier today Philip Klotzbach tweeted, “Seasonal ACE only 50% of normal thru 9/9.”
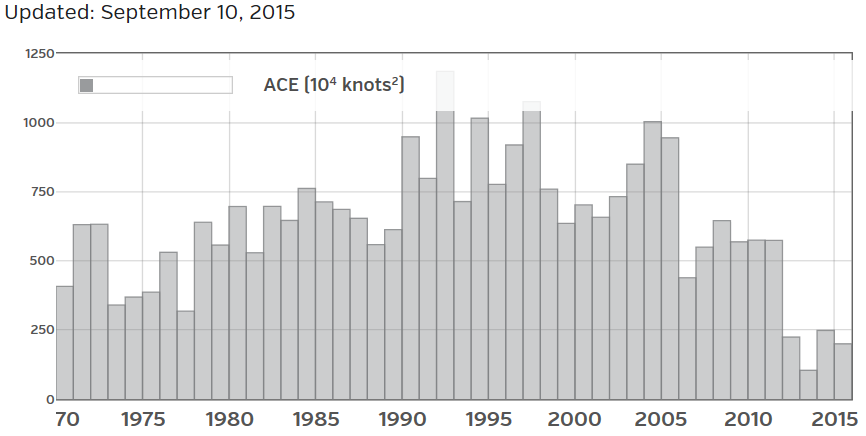
Indeed looking at weather site www.wunderground.com we see that global cyclone activity measured by the “Accumulated Cyclone Energy” (ACE) index over the past four years is even at a 45-year low!
Global Accumulated Cyclone Energy (ACE) since 1970. Chart shows that storm activity worldwide over the past 4 years is at a 45-year low and that the trend has been in steep decline since 1990. Source: www.wunderground.com.
Some years ago alarmist climate scientists, who insist a consensus backs their science, claimed with high certainty that global warming would increase the frequency and intensity of cyclones globally. We were told to expect “super-charged storms”, all fueled by global warming heat.
Well, something must be awfully wrong with their science. The exact opposite is true. The same has happened with temperature, global sea ice, and snow cover.
Perhaps the global warming experts will tell us that the huge cyclones are hidden somewhere deep in the oceans along with the “missing heat”, getting ready to pounce later in the future.


Today is the peak of the Atlantic Hurricane season per the longterm averages. We’ve made it through the worst part, all that’s left is endure rearranging the ravages of the first half. Or something like that.
https://wattsupwiththat.files.wordpress.com/2014/09/peak_of_hurricane_season.gif
Fascinating data! Love to see a trend line set to it. Depending on how you view it, ACE increases from the 70s to the early 90s, appears to peak roughly mid-90s to early 2000s, and has been steadily dropping since, with 2004–2005 being the “last hurrah.”
So, two questions: 1) What’s the underlying mechanism(s), and 2) What’s next?
Loved your last sentence. Got a chuckle out of it but it is not as ridiculous as we think since many statements such as yours have been put out by the Global Warming Alarmists.
[…] https://notrickszone.com/2015/08/15/nasa-sahara-dust-and-below-average-sea-surface-temperatures-putting-the-brakes- on-hurricanes/#sthash.mSGACYzF.dpbs https://notrickszone.com/2015/09/10/something-awfully-wrong-with-global-warming-science-and-predictio… […]
If you would like to see some of the many almarists’ predictions — confident predictions — of more & larger tropical storms, see
http://fabiusmaximus.com/2015/08/26/hurrican-predictions-since-katrina-88813/
For more about the science, see this by Judith Curry:
http://judithcurry.com/2015/08/30/hurricanes-and-global-warming-10-years-post-katrina/
Rather than struggle with the erroneous connection of storm strength and man made global warming,it seems to me we can entertain that connection for a bit so that all of the “believers” must now conclude that the lack of storm energy must mean no man made global warming.
BobW in NC misses the point. The scurrilous predictions of “climatologists” based on conclusions unprocessed through the scientific method and made in to “news” are a black a mark on the community of science as has been created since the dark ages.
But you see. All these changes in climate is climate change, and climate change is all caused by CO2.
Did we ever say it shoud be caused by higher temperature, no the science has advansed a lot since then, and i hardly remember.
Do I see half a sinusoidal cycle? Everything in this universe goes around something else, from the electron around the proton/neutron to the solar systems going around a black hole in a galactic formation, and everything else in between. It’s a cycle. Next phase: Global cooling which the Al Gores of this world will surely find a culprit for and that would be you and I and the cars we drive.
looks like the wunderground is not updating all oceans (just click them all, some show 2010 as last number on x-axis).
It also looks like we see an el nino scheme behind the numbers. So a majority of sceptic talking points (satellite data, pause, cold waves) are just side effects of a la nina phase.
Blah blah. The whole notion of increasing cyclones or hurricanes contraticted the warmunists’ own theory from the start so it was quite baffling to watch as they pushed it, ever keen on catastrophist headlines. What better way to scare sheeples than by pictures of kinetic destruction so they NEEDED the storms.
Warmunit theory says that poles warm faster than tropics REDUCING the temperature differentials. But it never bothered the warmunists. Who are to this day utterly unable AND disinterested in actually simulating a hurricane.
“Warmunit theory says that poles warm faster than tropics REDUCING the temperature differentials. ”
What relevance do you think the poles have on tropical cyclones?
I am not sure you understand the concept.
https://en.wikipedia.org/wiki/Tropical_cyclone
Tropical cyclones form over warm water. And with them being rare events, it is difficult to see the trend in a few data points.
Storms also may have a bigger effect, because of increased vulnerability, combination of warming effects, places being hit that never saw a storm before or storms getting fewer but just a little bit stronger.
I will watch how you provide scientific data that shows that all those concerns are unnecessary.
“Storms also may have a bigger effect, because of increased vulnerability, combination of warming effects, places being hit that never saw a storm before or storms getting fewer but just a little bit stronger.”
Is your day job writing the descriptions of side effects of psychopharmaca? Then DON’T EAT SO MANY OF THEM! They’re not SWEETS!
And you sod, has it occurred to you that you might just be an annoying side effect of a warming phase still defined in tenths and hundredths of a degree despite the best attentions of criminally insane climate botherers?
“f criminally insane climate botherers?”
For a start, the data that you folks here believed without a single “sceptic” word, turns out to be false.
Why can we not look at the real data and now start a discussion on what it really shows.
Is the long term trend up and the short term trend pointing up? What does that mean to your theories?
Judith Curry has a post from August on Hurricanes:
http://judithcurry.com/2015/08/30/hurricanes-and-global-warming-10-years-post-katrina/
Looks like 2015 might be sort of a record year in the northern hemisphere.
I think you need to learn what the definition of a hurricane is before making such comments.
I am ready to learn. please educate me.
i was referring to this graphs down the Curry post:
https://curryja.files.wordpress.com/2015/08/slide5.png
https://curryja.files.wordpress.com/2015/08/slide4.png?w=500&h=375
What is wrong with them and the line i wrote above?
Okay – chart, however, shows no trend. But please feel free to see lots of doom and gloom if that is what makes you feel better.
i was not speaking about a trend. The charts seem to show a record high.
And i am posting these charts in a topic, that declares a 4 year low.
We are seeing a lot of records these days: hottest days in Germany, arctic sea ice falling into the 3 lowest years and 3 simultanious hurricanes in the pacific.
http://www.livescience.com/52062-record-breaking-hurricane-trio-photo.html
if the el nino stays for a while, we might also lose the “pause” meme altogether.
I think we really need hard facts, to turn all of that into irrelevant noise around the imminent cooling…
So, Global Warming manifests itself in a peak in ACE from JAN 1 to AUG 28 now? Springs got windier? Well run for the hills!
Well I guess you will find peaks SOMEWHERE.
Why not try all intervals, like maybe we find a hockeystick if we only look at the first week of March from 1950 to now?
That should be worth a grant and a Nobel!
hurricanes & solar activity update…
graph of multidecadal Atlantic ACE (Accumulated Cyclone Energy) & sunspot streak deceleration:
https://i0.wp.com/s7.postimg.org/ujm61i0jf/Atlantic_ACE_Sunspot_Streak_Deceleration.png
That’s using annual sunspot numbers, classifying (binary yes or no) whether sunspot number is over 40, and then measuring streak-cycle deceleration. (The length of streaks above & below 40 varies primary as a function of solar cycle length.)