Note: Title above is that of NoTricksZone, and not of Kenneth Richard.
—————————————-
Glacier, Ice Sheet Melt Rates Slowing!
By Kenneth Richard
In recent years glacier and ice sheet melt rates have been rapidly decelerating in several regions of the globe.
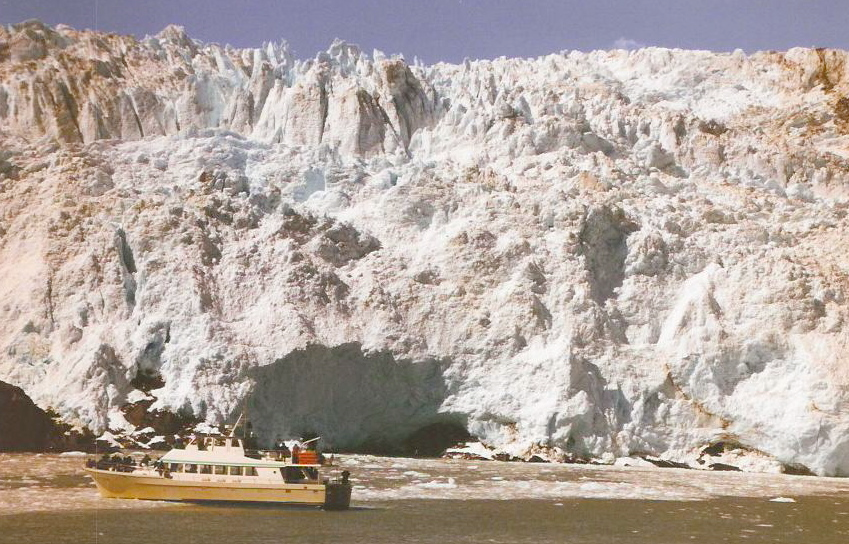
For illustration only. By Beeblebrox – Own work, CC BY-SA 3.0, https://commons.wikimedia.org/w/index.php?curid=11810995
According to published scientific study by Jacob et al. (2012, Recent Contributions of Glaciers and Ice Caps [GIC] to Sea Level Rise), glaciers and ice caps across the world (excluding Greenland and Antarctica) in total only contributed 0.41 mm/yr (~1.6 inches per century) to sea level rise between 2003 and 2010.
This was an overall 30% deceleration from previous year’s estimates, with glaciers in the high mountains of Asia effectively in balance. The abstract states the results are based on a global, simultaneous inversion of monthly GRACE-derived satellite gravity fields, from which the scientists calculate the mass change over all ice-covered regions greater in area than 100 sq km.
The scientists say that the GIC rate for 2003-2010 is about 30 per cent smaller than the previous mass balance estimate that most closely matches their study period. Particularly the high mountains of Asia show a mass loss of only 4 ± 20 gigatons per year for 2003-2010, compared with 47-55 Gt yr(-1) in previously published estimates.
Examining Jacob et al. (2012) further, the scientists indicate that the 0.41 mm/yr for 2003-2010 is well less than half the melt rate contribution for the first 5 or 6 years of the 21st century (~0.8 to ~1.1 mm/yr), and even slightly less than the rate for the entire 1961-2004 period (0.4 to 0.5 mm/yr).
The scientists conclude:
Excluding Greenland and Antarctic peripheral GICs [glaciers and ice caps] (PGICs), GICs have variously been reported to have 0.43–0.51 mm yr to sea level rise (SLR) during 1961–2004, 0.77 mm yr during 2001–2004, 1.12 mm yr during 2001–2005 and 0.95 mm yr during 2002–2006.”
Some glaciers have reversed course, and now advancing
Furthermore a recently published (2016) paper indicates that the high mountain glaciers of Asia have actually begun advancing since 2009 (through 2014). A new paper published earlier this year by Zhang, Zhen et al shows similar developments. The scientists state that the glacier mass changes in the Muztag Ata and Kongur Tagh (MAKT) region in the eastern Pamir, northwestern China, is helpful in improving our knowledge of the dynamics of glaciers under a changing climate in High Mountain Asia. They summarize their findings in the paper’s abstract:
Here, glacier area and mass changes derived from remote sensing data are investigated for the period 1971/76–2013/14 for glaciers in MAKT. We have used ASTER images (2013/14), Cartosat-1 (2014) and Landsat, SRTM (Shuttle Radar Terrain Mission) digital elevation model (DEM) (2000), topographic maps (1971/76) and the first and second Chinese glacier inventories (CGIs). Our results indicated that the glacier area of MAKT decreased from 1018.3 ± 12.99 km2 in 1971/ 76 to 999.2 ± 31.22 km2 in 2014 (–1.9 ± 0.2%). Weak area shrinkage of glaciers by 2.5 ± 0.5 km2 (0.2 ± 0.1%) happened after 2000 and the period 2009–2014 even saw a slight expansion by 0.5 ± 0.1 km2 (0.1 ± 0.0%).”
Yet another 2016 paper in the Internal Journal of Quaternary Research authored by a team led by Ireneuzw Sobota indicates that the Aavatsmarkbreen glacier (Svalbard) advanced by over 1 km between 2013 and 2015. The study’s main objective, according to the authors, was to analyse and classify subglacial and supraglacial landforms in the context of glacial deformation and basal sliding over a thin layer of thawed, water-saturated deposits. The study also focused on the geomorphological evidence of surge-related sub- and supraglacial crevassing and glacier front fracturing. The results:
From 2006 to 2013, the average recession of Aavatsmarkbreen was 363 m (52 m a−1). A subsequent surge during 2013–2015 resulted in a substantial advance of the glacier front of over 1 km and an increase in its surface area of more than 2 sq. km.”
This rapid regional (Arctic) glacier expansion since 2013 coincides with Greenland’s recent ice sheet melt deceleration. According to the Arctic Report Card (2015), after losing an average of ~260 Gt per year from 2002 to 2013, ice sheet losses decelerated to -29 gigatons and -186 gigatons in 2013-14 and 2014-15 respectively.
The ice mass loss of 186 Gt over the entire ice sheet between April 2014 and April 2015 was 22% below the average mass loss of 238 Gt for the 2002- 2015 period, but was 6.4 times higher than the 29 Gt loss of the preceding 2013-2014 season. They add:
The net area loss from marine-terminating glaciers during 2014-2015 was 16.5 sq km.. This was the lowest annual net area loss of the period of observations (1999-2015) and 7.7 times lower than the annual average area change trend of -127 sq km.”
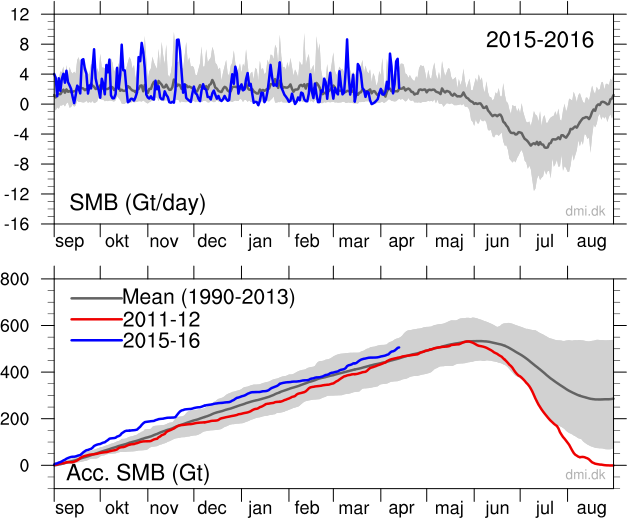
And, already for 2016, the surface mass balance (see graph below, blue trend line) is well above the 1990-2013 mean, marking the third straight year of Greenland ice sheet melt deceleration.


It’s NOT our fault!
http://www.c3headlines.com/2011/09/new-research-satellite-measurements-confirm-global-warming-not-the-cause-of-modern-greenland-ice-los.html
http://www.c3headlines.com/2012/02/scientists-determine-modern-greenland-glacier-retreat-not-unique-part-of-natural-melt-cycle.html
Both on Greenland found here…
http://www.c3headlines.com/arcticgreenlandantarcticglacierssea-ice/
…among many others showing that paranoid fear of glacial melting is not rooted in reality.
Sorry Chump, but looking at one-year changes is the provience of fools.
You might look into serious work:
acceleration unc
-27 9 Gt/yr2 Enderlin pg 870
-25 9 Gt/yr2 Enderlin pg 870
-21.9 1 Gt/yr2 http://onlinelibrary.wiley.com/doi/10.1029/2011GL046583/abstract
-28 9 Gt/yrs Harig and Simons, http://onlinelibrary.wiley.com/doi/10.1002/2016GL067759/full
There should be +/- signs between those numbers, i.e. -27 +/- 9 Gt/yr2, etc. Sorry.
David Appell 15. April 2016 at 6:04 AM | Permalink | Reply
“Sorry Chump, but looking at one-year changes is the provience of fools.
You might look into serious work:”
Well the longer the time span the more it is climate.
https://i1.wp.com/climate.geologist-1011.net/HoloceneTemperatures.png
Looks like cooling to me. If we ignore the glaciation. If we include the last glaciation, it’s warming. Maybe that’s a good reason to go into a full blown panic: The world is ending! Look at the continental ice sheet of Europe! It’s MELTING! OMG!
See:
Enderlin et al, GRL (2014) http://onlinelibrary.wiley.com/doi/10.1002/2013GL059010/abstract
Velicogna et al, GRL (2014) http://onlinelibrary.wiley.com/doi/10.1002/2014GL061052/abstract
“According to published scientific study by Jacob et al. (2012, Recent Contributions of Glaciers and Ice Caps [GIC] to Sea Level Rise), glaciers and ice caps across the world (excluding Greenland and Antarctica) in total only contributed 0.41 mm/yr (~1.6 inches per century) to sea level rise between 2003 and 2010.”
Hmm,you aren’t citing the latest data. I wonder why.
Here I list studies published in 2014, except for one in 2013. They show continued melting — and even accelerated melting in Greenland:
http://davidappell.blogspot.com/2014/05/how-fast-is-planet-losing-ice.html
Sources: McMillan et al (2014), Holland et al (2014), PIOMAS (2014), Enderlin et al (2014), Gardner et al (2013).
That there are other papers out there with another view only shows us that the science is disputed and that there is no consensus.
“Sorry Chump, but looking at one-year changes is the provience of fools.”
If you would actually read the article, you would see that they are looking at 7 year changes.
And if you’re going to call someone “Chump”, you could learn to spell provenance. And then learn what it means
7 years! And you think that is somehow indicative of climate?
Justify that.
For the alarmists one single day-long weather event is already proof of climate change. Surely you’ll forgive us for saying that growing sea ice over the last 7 years shows that sea ice has not really been melting recently. But on the other hand we are aware and understand your end-of world scenario obsessions – some people have these. And I do hope you’ll appreciate us letting you express them here. Most other sites would probably call the doctor.
“For the alarmists one single day-long weather event is already proof of climate change.”
Not for anyone who goes by the science. They know it is about trends and not single events.
“Surely you’ll forgive us for saying that growing sea ice over the last 7 years….”
Pierre: Whoever told you that 7 years denotes a change in climate? [-snip- You’re changing the subject. Of course 7 years is no trend (unless it’s an El Nino). I’m merely pointing out that it is wrong to claim that the Arctic is still melting rapidly today when IN FACT it has grown over the past 7 years. And if you look at the Arctic over the past 10,000 years, you have to say it is growing. So please, when it comes trends, do get off stupid. We are all aware of the cherry-picking trick of choosing the trend start-point. And I know what is now coming next: a tantrum e-mail accusing me of censoring blah blah blah, then you will disappear and pout for 3 weeks, and then you’ll be back with another two dozen string of snide comments, and so goes the Appell comment cycle. Little wonder other blogs have long cast you out. – PG]
Got him! LOL
“7 years! And you think that is somehow indicative of climate?”
Then why are so many moronic AGW clowns using the very short term El Nino to say the pause has been broken.?
As usual, you are totally full of it.
Hypocrisy and deceit, that is.
“from previous year’s estimates”
I downloaded the paper and suggest you should amend this to
“from previous estimates”
Or
“from previous years’ estimates”
North Atlantic 0-800m subsea temps since 2004 courtesy of Climate4you:-
http://www.climate4you.com/images/ArgoTimeSeriesTemp59N.GIF
http://www.climate4you.com/images/OceanTemp0-800mDepthAt59Nand30-0W.gif
Quite a marked change, will it continue, what effect, if any, is it likely to have on NW Europe?
As always only time will tell…..
Short term trends (2nd order derivative) do not convince me.
OMG….the “global cooling” is happening. Joe Bastadi was right! And here is yet MORE PROOF:
https://www.yahoo.com/news/el-nino-weakens-comes-la-nina-meteorologists-182011313.html
We’re heading into an ice age. THIS was the tipping point that Joe Bastardi and Tony Watts were waiting for!
OK….they kind of “blew it” over the last 15 years when their calls for global cooling and an expanding Arctic ice sheet NEVER MATERIALIZED. But NOW….THIS TIME….it will come true!
Or not. Most likely NOT. In fact….definitely NOT. But that’s OK. It won’t save the coal companies…..but maybe the oil and gas companies can tack on a few more years on to the end of their life span….:)
Good day mates…:)
Why does your post look like you are having a conniption fit, Buddy?
“Or not. Most likely NOT. In fact….definitely NOT. But that’s OK. It won’t save the coal companies…..but maybe the oil and gas companies can tack on a few more years on to the end of their life span….:)”
After which we will reap the benefits of a self-sustaining solar+wind power civilisation. With huge storage hall sized NaS battery boxes, 250 centigrade hot, cluttered all over the landscape. Because THAT’LL work. And has been demonstrated to work.
sod and Buddy will fill you in about the details of said demonstration.
In the arctic, it’s all ocean currents. Now that the North Atlantic is cooling, glaciers in Svalbard are advancing. The next thing will be expanding sea ice west of Novaya Zemlya in the coming years. The Northeast Passage is closing again.
Oh, Ed, you’re such a wet blanket. Shame on you for harshing their climate mellow with reality. =)
David Appell:
This is more than just about a 3-year “trend” in slowing glacier melt rates. It’s about an oscillation that extends back 100+ years, as global-scale glaciers and ice sheets actually melted just as (or more) rapidly during the 1920s to 1940s period than in the 1990s to present period. Global-scale glacier/ice sheet melt trends are tied to long-term oceanic-atmospheric factors like the NAO/PDO/ENSO. The surface mass balance of the Greenland ice sheet, for example, was similar or perhaps lower than today during the 1920s to 1940s. Then, during the 1950s to early 1990s, the Arctic cooled (relative to the 1920s to 1940s). Beginning in the early- to mid-1990s, the Arctic began warming again. Within the last decade or so, glacier melt has begun decelerating to even advancing in some regions – consistent with natural oceanic cycling. In the Himalayas, for example, glaciers have effectively been in balance (just -0.2% net loss out of over 2,000 glaciers in the region according to Bahuguna et al., 2014) since the 21st century began, with some areas advancing.
Perhaps you might consider the long-term oscillation pattern rather than presuming short-term data are sufficient, or that the last few decades are unusual for glaciers and ice sheets. Furthermore, the last 100+ years of oscillations don’t include the strong paleoclimate indications that glacier and ice sheet melt was far more rapid and pronounced than now just a few thousand years ago, when CO2 concentrations were in the 260 to 275 ppm range. Glaciers that exist now didn’t even exist a few thousand years ago, for example. In sum, what’s happening now is well within the range of natural variability.
By the way, what do you think caused the high glacier and ice sheet melt rates during the 1920s to 1940s period – since anthropogenic CO2 emissions remained flat and low (~1 GtC/yr) throughout this entire high-melt period?
—–
http://www.the-cryosphere.net/8/659/2014/tc-8-659-2014.pdf
The data set contains the glacier length records for 471 [global] glaciers and it covers the period 1535–2011. There are glacier length records from all continents and at almost all latitudes. For the observed glaciers, the 20th century retreat was strongest in the first half of the 20th century.…. [T]he retreat is strongest in the period 1921–1960 rather than in the last period 1961–2000, with a median retreat rate of 12.5 m yr in 1921–1960 and 7.4 m yr in the period 1961–2000.
[Glaciers melted 69% more rapidly from 1921-1960 than from 1961-2000 – the opposite of what models claim should happen considering CO2 concentration changes were negligible for the early 20th century, and then exploded afterwards.]
—–
http://www.the-cryosphere.net/2/117/2008/tc-2-117-2008.pdf
These estimates show that the high surface mass loss rates of recent years are not unprecedented in the GrIS [Greenland Ice Sheet] history of the last hundred years. The minimum SMB rate seems to have occurred earlier in the 1930s and corresponds to a zero SMB rate….The results show that the GrIS surface mass loss in the 1930s is likely to have been more significant than currently due to a combination of very warm and dry years.
—–
http://www.researchgate.net/profile/Shakil_Romshoo/publication/261436319_Are_the_Himalayan_glaciers_retreating/links/0a85e5343ff8061fd6000000.pdf
Two thousand and eighteen glaciers representing climatically diverse terrains in the Himalaya were mapped and monitored. It includes glaciers of Karakoram, Himachal, Zanskar, Uttarakhand, Nepal and Sikkim regions. Among these, 1752 glaciers (86.8%) were observed having stable fronts (no change in the snout position and area of ablation zone), 248 (12.3%) exhibited retreat and 18 (0.9%) of them exhibited advancement of snout. The net loss in 10,250.68 sq. km area of the 2018 glaciers put together was found to be 20.94 sq. km or 0.2%.
—–
http://www.the-cryosphere-discuss.net/9/1555/2015/tcd-9-1555-2015.pdf
Abstract: Six hundred and seven glaciers of the Shigar, Shashghan, Nubra and part of Shyok sub-basins of the Karakoram region were monitored using satellite data of years 1977, 1990, 2000, 2001, 2002, 2004, 2006, 2008, 2009, 2010, 2011 and 2013. …. Despite significant geographic and temporal variability betraying the 10 dynamic nature of many of the glaciers, in aggregate the population is roughly stable with less propensity toward retreat than most other glaciers in the nearby Himalaya and in the world. 341 glaciers exhibited no measured change throughout the 36 years of the study. Among other glaciers, no significant and sustained pattern of retreat or advance was observed.
Conclusion: The glaciers in our study area of the Karakoram include many advancing glaciers and many retreating ones, but most of the glaciers have remained nearly stable over several decades. A couple percent of the glaciers are surge types. There have been temporal changes in aggregate glacier behavior. Before 1990 the glaciers on average were either stable or retreating. In the last two decades Karakoram glaciers, on average, have experienced noticeable advances of their snouts and areas. The aggregate changes, 25 however, are small for every period considered.
—–
http://www.the-cryosphere-discuss.net/9/1811/2015/tcd-9-1811-2015.pdf
Abstract: Recent mass balance measurements indicate a slight mass gain at Muztag Ata in the Eastern Pamir [China]. We extend these measurements both in space and time by using remote sensing data and present four decades of glacier variations in the en- 5 tire mountain massif. … On average, the glaciers showed a small, insignificant shrinkage from 274.3 ± 10.6 km2 in 1973 to 272.7 ± 1.0 km2 in 2013 (−0.02 ± 0.1 % a−1 20 ). Average mass changes in the range of −0.03 ± 0.33 m w.e. a−1 (1973–2009) to −0.01 ± 0.30 m w.e. a−1 (1973–2013) reveal nearly balanced budgets for the last forty years. Indications of slightly positive trends after 1999 (+0.04 ± 0.27 m w.e. a−1 ) are confirmed by in-situ measurements.
—–
http://www.the-cryosphere.net/8/977/2014/tc-8-977-2014.html
The present study utilizes different remote sensing-based methods to generate an updated glacier inventory for the entire Karakoram region. It provides a new comprehensive dataset on the state of advancing, stable, and retreating glaciers, including the temporal and spatial variations of frontal positions between 1976 and 2012.Out of 1219 glaciers in the inventory, the vast majority [79%] showed stable terminus positions (969). These findings support the assumption of the anomalous behavior of glaciers in the Karakoram in comparison to adjacent mountain ranges, which indicate glacier recession and thinning (Bolch et al., 2012; Hewitt, 2005; Gardelle et al., 2013; Kääb et al., 2012; Scherler et al., 2011). Glacier recession is found for only 8% of the glaciers in the inventory, indicating decreasing numbers since the beginning of the 21st century, whereas the number of advancing glaciers [13%] has increased since then.
—–
http://www.nature.com/ngeo/journal/v5/n5/full/ngeo1450.html
http://etienne.berthier.free.fr/download/Gardelle_et_al_NatGeo_2012.pdf
Slight mass gain of Karakoram glaciers in the early twenty-first century
Here, we calculate the regional mass balance of glaciers in the central Karakoram [Himalayas] between 1999 and 2008, based on the difference between two digital elevation models. The regional mass balance is just positive at +0.11±0.22 m yr water equivalent and in agreement with the observed reduction of river runoff that originates in this area. Our measurements confirm an anomalous mass balance in the Karakoram region and indicate that the contribution of Karakoram glaciers to sea-level rise was −0.01 mm yr for the period from 1999 to 2008, 0.05 mm yr−1 lower than suggested before
—–
http://onlinelibrary.wiley.com/doi/10.1111/j.0435-3676.2005.00249.x/abstract
Norway and New Zealand both experienced recent glacial advances, commencing in the early 1980s and ceasing around 2000, which were more extensive than any other since the end of the Little Ice Age. Common to both countries, the positive glacier balances are associated with an increase in the strength of westerly atmospheric circulation which brought increased precipitation. In Norway, the changes are also associated with lower ablation season temperatures. In New Zealand, where the positive balances were distributed uniformly throughout the Southern Alps, the period of increased mass balance was coincident with a change in the Interdecadal Pacific Oscillation and an associated increase in El Niño/Southern Oscillation events
97% Settled Science Glacier Spin Out!
Melting glaciers are causing the rotation of the Earth to slow thereby lengthening our days, new research has found.
https://www.theguardian.com/science/2015/dec/11/climate-change-longer-days-glaciers-north-south-pole
Earth May Spin Faster as Glaciers Melt
http://www.livescience.com/53071-melting-glaciers-change-earth-spin.html
http://news.bbc.co.uk/2/hi/science/nature/1816860.stm
2002: “[I]ncreasing levels of carbon dioxide (CO2) in the atmosphere will slow the Earth’s rotation.”
http://www.newscientist.com/article/dn11555
2007: “Global warming will make Earth spin faster”
http://www.theguardian.com/science/2015/dec/11/climate-change-longer-days-glaciers-north-south-pole
2015: “[W]ater from shrinking glaciers slows Earth’s rotation”
http://www.livescience.com/53071-melting-glaciers-change-earth-spin.html
2015: “Earth May Spin Faster as Glaciers Melt”
The tribe is splitting into warring factions.
David Appell:
This is more than just about a 7-year “trend” in slowing glacier melt rates. It’s about an oscillation that extends back 100+ years, as global-scale glaciers and ice sheets actually melted just as (or more) rapidly during the 1920s to 1940s period than in the 1990s to present period. Global-scale glacier/ice sheet melt trends are tied to long-term oceanic-atmospheric factors like the NAO/PDO/ENSO. The surface mass balance of the Greenland ice sheet, for example, was similar or perhaps lower than today during the 1920s to 1940s. Then, during the 1950s to early 1990s, the Arctic cooled (relative to the 1920s to 1940s). Beginning in the early- to mid-1990s, the Arctic began warming again. Within the last decade or so, glacier melt has begun decelerating to even advancing in some regions – consistent with natural oceanic cycling. In the Himalayas, for example, glaciers have effectively been in balance (just -0.2% net loss out of over 2,000 glaciers in the region according to Bahuguna et al., 2014) since the 21st century began, with some areas advancing. Perhaps you might consider the long-term oscillation pattern rather than presuming short-term data are sufficient, or that the last few decades are unusual for glaciers and ice sheets.
Additionally, the last 100+ years of oscillations doesn’t include the fact that glacier and ice sheet melt was far more rapid and pronounced than now just a few thousand years ago, when CO2 concentrations were in the 260 to 275 ppm range. Glaciers that exist now didn’t even exist a few thousand years ago, for example. What’s happening now is well within the range of natural variability.
By the way, what do you think caused the high glacier and ice sheet melt rates during the 1920s to 1940s period – since anthropogenic CO2 emissions remained flat and low (~1 GtC/yr) throughout this entire high-melt period?
—–
http://www.the-cryosphere.net/8/659/2014/tc-8-659-2014.pdf
The data set contains the glacier length records for 471 [global] glaciers and it covers the period 1535–2011. There are glacier length records from all continents and at almost all latitudes. For the observed glaciers, the 20th century retreat was strongest in the first half of the 20th century.…. [T]he retreat is strongest in the period 1921–1960 rather than in the last period 1961–2000, with a median retreat rate of 12.5 m yr in 1921–1960 and 7.4 m yr in the period 1961–2000.
[Glaciers melted 69% more rapidly from 1921-1960 than from 1961-2000 – the opposite of what models claim should happen considering CO2 concentration changes were negligible for the early 20th century, and then exploded afterwards.]
—–
http://www.the-cryosphere.net/2/117/2008/tc-2-117-2008.pdf
These estimates show that the high surface mass loss rates of recent years are not unprecedented in the GrIS [Greenland Ice Sheet] history of the last hundred years. The minimum SMB rate seems to have occurred earlier in the 1930s and corresponds to a zero SMB rate…. The results show that the GrIS surface mass loss in the 1930s is likely to have been more significant than currently due to a combination of very warm and dry years.
—–http://www.researchgate.net/profile/Shakil_Romshoo/publication/261436319_Are_the_Himalayan_glaciers_retreating/links/0a85e5343ff8061fd6000000.pdf
Two thousand and eighteen glaciers representing climatically diverse terrains in the Himalaya were mapped and monitored. It includes glaciers of Karakoram, Himachal, Zanskar, Uttarakhand, Nepal and Sikkim regions. Among these, 1752 glaciers (86.8%) were observed having stable fronts (no change in the snout position and area of ablation zone), 248 (12.3%) exhibited retreat and 18 (0.9%) of them exhibited advancement of snout. The net loss in 10,250.68 sq. km area of the 2018 glaciers put together was found to be 20.94 sq. km or 0.2%.
—–
http://www.the-cryosphere-discuss.net/9/1555/2015/tcd-9-1555-2015.pdf
Abstract: Six hundred and seven glaciers of the Shigar, Shashghan, Nubra and part of Shyok sub-basins of the Karakoram region were monitored using satellite data of years 1977, 1990, 2000, 2001, 2002, 2004, 2006, 2008, 2009, 2010, 2011 and 2013. …. Despite significant geographic and temporal variability betraying the 10 dynamic nature of many of the glaciers, in aggregate the population is roughly stable with less propensity toward retreat than most other glaciers in the nearby Himalaya and in the world. 341 glaciers exhibited no measured change throughout the 36 years of the study. Among other glaciers, no significant and sustained pattern of retreat or advance was observed.
Conclusion: The glaciers in our study area of the Karakoram include many advancing glaciers and many retreating ones, but most of the glaciers have remained nearly stable over several decades. A couple percent of the glaciers are surge types. There have been temporal changes in aggregate glacier behavior. Before 1990 the glaciers on average were either stable or retreating. In the last two decades Karakoram glaciers, on average, have experienced noticeable advances of their snouts and areas. The aggregate changes, 25 however, are small for every period considered.
—–
http://www.the-cryosphere-discuss.net/9/1811/2015/tcd-9-1811-2015.pdf
Abstract: Recent mass balance measurements indicate a slight mass gain at Muztag Ata in the Eastern Pamir [China]. We extend these measurements both in space and time by using remote sensing data and present four decades of glacier variations in the en- 5 tire mountain massif. … On average, the glaciers showed a small, insignificant shrinkage from 274.3 ± 10.6 km2 in 1973 to 272.7 ± 1.0 km2 in 2013 (−0.02 ± 0.1 % a−1 20 ). Average mass changes in the range of −0.03 ± 0.33 m w.e. a−1 (1973–2009) to −0.01 ± 0.30 m w.e. a−1 (1973–2013) reveal nearly balanced budgets for the last forty years. Indications of slightly positive trends after 1999 (+0.04 ± 0.27 m w.e. a−1 ) are confirmed by in-situ measurements.
—–
http://www.the-cryosphere.net/8/977/2014/tc-8-977-2014.html
The present study utilizes different remote sensing-based methods to generate an updated glacier inventory for the entire Karakoram region. It provides a new comprehensive dataset on the state of advancing, stable, and retreating glaciers, including the temporal and spatial variations of frontal positions between 1976 and 2012. Out of 1219 glaciers in the inventory, the vast majority [79%] showed stable terminus positions (969). These findings support the assumption of the anomalous behavior of glaciers in the Karakoram in comparison to adjacent mountain ranges, which indicate glacier recession and thinning (Bolch et al., 2012; Hewitt, 2005; Gardelle et al., 2013; Kääb et al., 2012; Scherler et al., 2011). Glacier recession is found for only 8% of the glaciers in the inventory, indicating decreasing numbers since the beginning of the 21st century, whereas the number of advancing glaciers [13%] has increased since then.
—–
http://www.nature.com/ngeo/journal/v5/n5/full/ngeo1450.html
http://etienne.berthier.free.fr/download/Gardelle_et_al_NatGeo_2012.pdf
Slight mass gain of Karakoram glaciers in the early twenty-first century
Here, we calculate the regional mass balance of glaciers in the central Karakoram between 1999 and 2008, based on the difference between two digital elevation models. The regional mass balance is just positive at +0.11±0.22 m yr water equivalent and in agreement with the observed reduction of river runoff that originates in this area. Our measurements confirm an anomalous mass balance in the Karakoram region and indicate that the contribution of Karakoram glaciers to sea-level rise was −0.01 mm yr for the period from 1999 to 2008, 0.05 mm yr−1 lower than suggested before
—–
http://onlinelibrary.wiley.com/doi/10.1111/j.0435-3676.2005.00249.x/abstract
Norway and New Zealand both experienced recent glacial advances, commencing in the early 1980s and ceasing around 2000, which were more extensive than any other since the end of the Little Ice Age. Common to both countries, the positive glacier balances are associated with an increase in the strength of westerly atmospheric circulation which brought increased precipitation. In Norway, the changes are also associated with lower ablation season temperatures. In New Zealand, where the positive balances were distributed uniformly throughout the Southern Alps, the period of increased mass balance was coincident with a change in the Interdecadal Pacific Oscillation and an associated increase in El Niño/Southern Oscillation events
HOW ABOUT WE LOOK AT THE LAST 129 YEARS?
“Canada’s glaciers have been consistently retreating since 1887.”
http://www.canadiangeographic.ca/blog/posting.asp?ID=1799
Sorry, warmists, the melting did NOT begin in 1979.
And remember, this is all happening on the heels of the “warmest year on record”. Apparently, ice just doesn’t melt like it used to. (Is that a CO2 effect?)