Puzzling drought history of Spain during the past 300 years
By Dr. Sebastian Lüning, Prof. Fritz Vahrenholt
(German passages translated by P. Gosselin)
[NOTE: Comment moderation will be slow over the next couple of days due to limited WIFI access. -PG]
Gradually word is getting out that the current climate trend has to be put in an historical pre-industrial context before one can draw far-reaching conclusions on anthropogenic causes. The Spanish Research platform sinc published on 27 June 2016 a press release on the drought history of Spain during the past three hundred years:
Radiography of drought periods in Spain from the last 318 years
The Mediterranean Basin has been witness to increased droughts for at least five decades, but has this always been the case? A team from the University of Zaragoza has been successful in reconstructing, for the first time, the droughts from 1694 to 2012 based on the precipitation index and the study of tree growth rings. According to the study, the twelve months leading up to July 2012 were the driest.
In the Mediterranean Basin, droughts are a recurring phenomenon that negatively impacts society, economic activities and natural systems. No one seems to doubt the fact that temperatures all over the world have risen in recent decades. However, this trend does not appear to be perceived as clearly when it comes to precipitation (for which data from 1950 onwards is available). Thus, up until now, the study on the recurrence and severity of droughts in Spain has been based on information from weather stations, with sufficient data only as of the mid-twentieth century.
To test the evolution of the droughts, scientists from the Department of Geography at the University of Zaragoza utilised indirect information, such as the study of tree growth rings, to reconstruct the climate of the Iberian Range as far back as 1694 and to analyse dry periods using the Standardised Precipitation Index (SPI). The researchers collected 336 samples and 45,648 growth rings from five different species (P. sylvestris, P. uncinata, P. nigra, P. halepensis, and Pinus pinaster) from 21 locations in the province of Teruel, in the east of the Iberian Peninsula, at an average altitude of 1,600 metres. The results, published in the ‘International Journal of Biometeorology’, made it possible to evaluate droughts from the last three centuries; they reveal that the twelve months leading up to July 2012 were the driest over the entire period studied. “We have been able to successfully identify seven especially dry periods and five wet periods since the end of the 17th century”, says Ernesto Tejedor to Sinc, the main author of the study.
The driest periods
According to the researchers, in addition to these periods there have been 36 extremely dry years and 28 very wet years since the end of the 17th century. “Some of these dry years, such as 1725, 1741, 1803 and 1879, are also identified in other drought reconstructions in Romania and Turkey, thus demonstrating the larger-scale coherence of the extreme deviations and their relationship with increasingly global atmospheric processes”, adds Tejedor.
Many of these extreme events are associated with catastrophic historical and cultural changes from the last three centuries. In fact, 1725 is known as ‘The year without a harvest’ in Monegros. These events are reflected in historical documents as the ‘pro-pluvia’ rogations, “since the intense droughts led to bad harvests with serious consequences for society”, comments Tejedor.
The reconstruction of droughts using dendrochronology does not make it possible to directly predict extreme future events, although these reconstructions are indeed used to validate future climate change models. “What we are seeing from the 20th century, and what we have seen so far in the 21st is an increase in the recurrence of extreme phenomena, including both wet and dry years”, stresses the researcher to Sinc. For the expert, predictions for precipitation variability and trends are not yet reliable like those for temperature, as other factors which are still being studied also play a role.
Citation: Tejedor, Ernesto; de Luis, Martin; María Cuadrat, José; Esper, Jan; Angel Saz, Miguel. “Tree-ring-based drought reconstruction in the Iberian Range (east of Spain) since 1694” International Journal of Biometeorology 60(3): 361-372 DOI: 10.1007/s00484-015-1033-7 marzo de 2016″
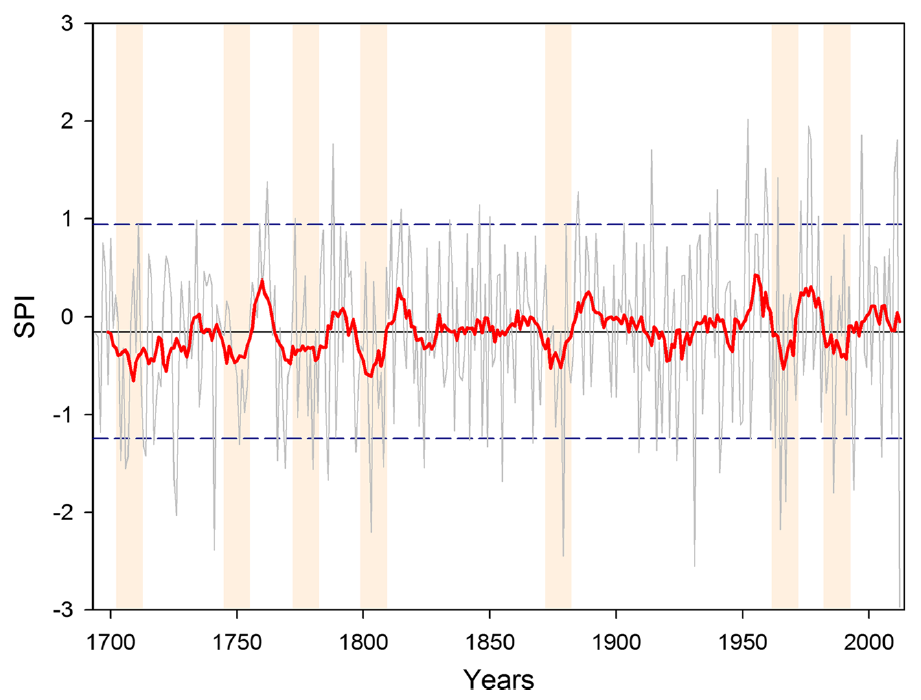
Using tree rings the authors documented 36 extremely dry years in Spain over the past 318 years. Somewhat sensationally they declared 2011/2012 the driest year ever, which as a single incident is hardly evidence of any climate trend. More interesting would be the distribution of the drought-intense periods over time. Here the press release is silent on this, and so we present the original chart from the paper to have a look.

Figure 2: Precipiation curve for the Iberian Range in Spain for the last 3 centuries. Source: Tejedor et al. 2016b. The yellow areas mark the 11-year drought periods.
When it comes to the trend, the press release is somewhat misleading.
Yes, there is an obvious increase in drought in 20th century. In the second half of the 20th century two longer periods of drought were registered while in the first half it was wetter. Yet there was also a higher frequency of drought phases in the 18th century and early 19th century – i.e. during the Little Ice Age. That could have been mentioned.
Instead the press release concluded that it was still too early to make trend projections. Yet as it stands it looks as if there isn’t any real long term trend over the centuries. Thus it would be false to infer any trend based on the droughts of the last decades alone.
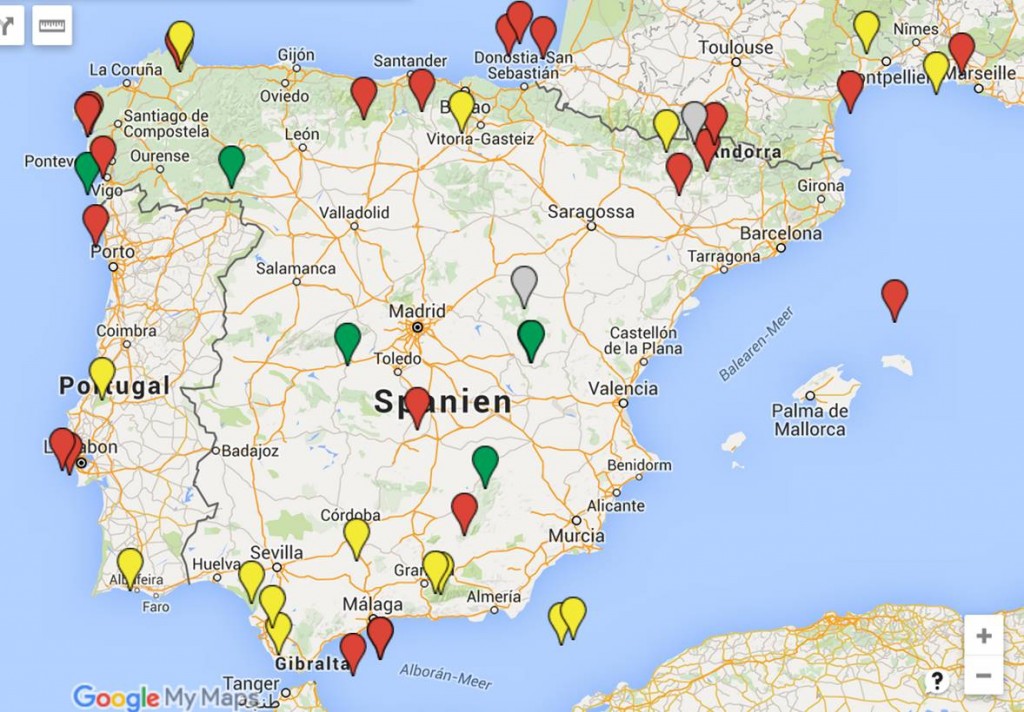
A look back at the last major warm phase – the Medieval Warm Period (MWP) of 1000 years ago – shows how complex the Iberian peninsula is when it comes to precipitation. Within the scope of the MWP-charting project we identified a corridor on the Iberian peninsula where it got wetter during the MWP (green points on chart). To the contrary in the outer areas of the Iberian peninsula it became drier during the MWP (yellow points).


I believe more in tree rings to show draught than temperature, but how is the temperature signal removed that must be present too.
It must be complicated to find calibration periods with very different variations in temperature and precipitation to make a division between these two. And then we have all the other factors that could influence tree rings.
“And then we have all the other factors that could influence tree rings.” – Svend Ferdinandsen
…like….
Elevated CO2 makes trees grow more, even if temperature doesn’t go up.
http://www.ncpa.org/images/1484.gif
http://arizonaenergy.org/AirEnergy/fig23b.gif
Now, back to the topic at hand (sort of)
https://www.youtube.com/watch?v=u5Pk8FEx38M
So, as you can see, this is old news (though it does help that it’s now backed up by the data). 😉
“For the expert, predictions for precipitation variability and trends are not yet reliable like those for temperature, …”
Say what? predictions … reliable … temperature
Color me scornful!
~~~~~~~~~Pierre wrote …
[NOTE: Comment moderation will be slow over the next couple of days due to limited WIFI access. -PG]
Our home network went AWOL this morning. A couple of tries at reconnecting did not work, so I turned the thing off and unplugged the power. Counted to 15 or more. Plugged it all back together. For a reason unknown it came back with a changed network name — from the DSL provider to the router name with enough odd digits to meet the 8 characters requirement and then some. It took about an hour to figure this out. Then there was the printer. A long password with numbers, symbols, upper and lower case (and the new network name; forgot to change that the first time through) on a 9 button touch pad can raise one’s blood pressure.
Did I mention I had to find an Ethernet cable and hook up an old computer to the router to quiz it. But, it is only time and we all have lots of that.
Now fixed. Rant over.
It is not just Spain. World wide records of rainfall contradict models claiming wet places get wetter and dry places drier.
https://rclutz.wordpress.com/2016/05/07/data-vs-models-2-droughts-and-floods/
So, if Spain experienced the most severe drought in the 2011/2012 years, did this produce the “consensus” predicted civil war, wanton violence and mass migration out of Spain to France, UK and Germany?
Regarding the red curve in Figure 2, is that a 5-year mean (or other)?
sod seems to have dried up as well.
Pierre have you booted him out, or is he sulking because the factual content of the last few posts make it very difficult to claim black is green with red spots?
” their relationship with increasingly global atmospheric processes ”
I found this phrase to be so typically unscientific.
What evidence they have that the atmospheric processes are more or less global?
Yep. More proof that droughts have never been worse.
http://thefederalist.com/wp-content/uploads/2016/07/megadry90.jpg
…except when they have.