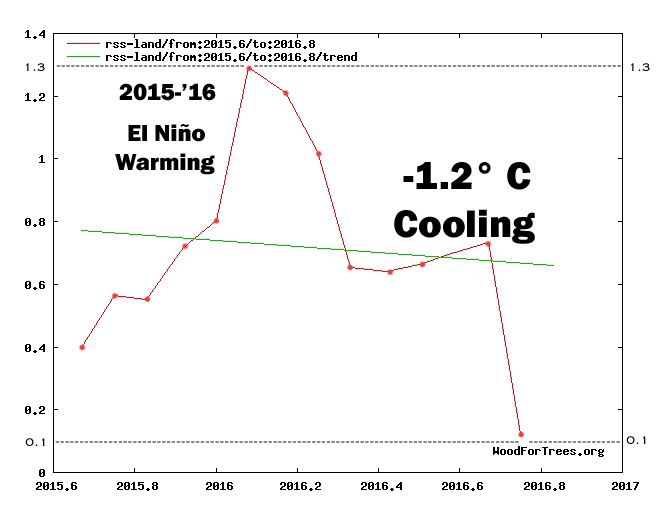
The most recent Super El Niño natural warming event exerted its maximum effect on surface temperature anomalies during the last few months of 2015 and the first few months of 2016. Since then, surface temperatures over land have dramatically declined by about 1.2° C according to the RSS satellite dataset.
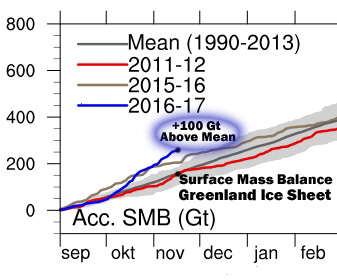
Since September, the Greenland Ice Sheet surface mass balance has risen +100 Gt above the 1990-2013 average:
According to an increasing body of scientific evidence, short-term cooling and ice sheet growth trends like the ones shown above may soon become long-term trends in the coming decades. As shown recently, there have already been 18 scientific papers published in 2016 indicating that periods with high solar activity (i.e., the 20th/21st century Modern Maximum, the 11th century Medieval Maximum) are associated with centennial-scale warming trends, and periods with low solar activity (the 13th to 19th century Little Ice Age) are associated with centennial-scale cooling trends.
Within the last year and a half, there have also been many other papers published in scientific journals indicating that the Earth’s Modern Grand Maximum of high solar activity (which lasted from the early- to mid-20th century to the early 21st century) has recently come to an end, and will soon be replaced by several decades of low solar activity and the concomitant decline in temperatures reaching levels not seen since the Little Ice Age.
Listed below are 10 recently-published scientific papers projecting solar activity minimums and “deep cooling” in the coming decades, especially beginning by about 2030. These papers would appear to run counter to the viewpoint that the coming decades will be characterized by unprecedented global warming that is dangerous and irreversible unless humans reduce or eliminate their consumption of fossil-fuel energies.
“The quasi-centennial epoch of the new Little Ice Age has started at the end 2015 after the maximum phase of solar cycle 24. The start of a solar grand minimum is anticipated in solar cycle 27 ± 1 in 2043 ± 11 and the beginning of phase of deep cooling in the new Little Ice Age in 2060 ± 11. The gradual weakening of the Gulf Stream leads to stronger cooling in the zone of its action in western Europe and the eastern parts of the United States and Canada. Quasi-bicentennial cyclic variations of TSI together with successive very important influences of the causal feedback effects are the main fundamental causes of corresponding alternations in climate variation from warming to the Little Ice Age.”
“In 1890´s G. Spörer and E. W. Maunder (1890) reported that the solar activity stopped in a period of 70 years from 1645 to 1715. Later a reconstruction of the solar activity confirms the grand minima Maunder (1640-1720), Spörer (1390-1550), Wolf (1270-1340), and the minima Oort (1010-1070) and Dalton (1785-1810) since the year 1000 A.D. (Usoskin et al. 2007). These minimum periods have been associated with less irradiation from the Sun and cold climate periods on Earth. An identification of a three grand Maunder type periods and two Dalton type periods in a period thousand years, indicates that sooner or later there will be a colder climate on Earth from a new Maunder- or Dalton- type period. …. The result shows that the TSI variability and the sunspots variability have deterministic oscillations, controlled by the large planets Jupiter, Uranus and Neptune, as the first cause. A deterministic model of TSI [total solar irradiance] variability and sunspot variability confirms the known minimum and grand minimum periods since 1000. From this deterministic model we may expect a new Maunder type sunspot minimum period from about 2018 to 2055. The deterministic model of a TSI ACRIM data series from 1700 computes a new Maunder type grand minimum period from 2015 to 2071. A model of the longer TSI ACRIM data series from 1000 computes a new Dalton to Maunder type minimum irradiation period from 2047 to 2068.”
“Conclusions Based on our results, we propose the use of the Wolf’s Number Oscillation Index (WNOI) – as a more uniform alternative to the ONI – in the range over 30 and below -30. The analysis of the material presented and the arguments discussed allows us to define a possible relationship between phenomena related to Solar Cycle, the ENSO, climatic conditions, as well as some criteria for the establishment of public policies for preservation and remediation of the environment in the long run. We can conclude that solar activity oscillations impact the earth climatic conditions to such a extent that they become measurable only in the long run. The magnitude of the Solar Cycle – from 7 to 17 and a mean of 11.2 years – seems to support this statement. Based on the similarities of the Solar Cycles 5 and 24 we can expect a longer period of cold weather for the years 2022 y/o 2034, corresponding to the Solar Cycles 24 and 25.”
“Solar variability represents a source of uncertainty in the future forcings used in climate model simulations. Current knowledge indicates that a descent of solar activity into an extended minimum state is a possible scenario. With aid of experiments from a state-of-the-art Earth system model, we investigate the impact of a future solar minimum on Northern Hemisphere climate change projections. This scenario is constructed from recent 11 year solar-cycle minima of the solar spectral irradiance, and is therefore more conservative than the ‘grand’ minima employed in some previous modeling studies. Despite the small reduction in total solar irradiance (0.36 W m−2), relatively large responses emerge in the winter Northern Hemisphere, with a reduction in regional-scale projected warming by up to 40%. To identify the origin of the enhanced regional signals, we assess the role of the different mechanisms by performing additional experiments forced only by irradiance changes at different wavelengths of the solar spectrum. We find that a reduction in visible irradiance drives changes in the stationary wave pattern of the North Pacific and sea–ice cover. A decrease in UV irradiance leads to smaller surface signals, although its regional effects are not negligible. These results point to a distinct but additive role of UV and visible irradiance in the Earth’s climate, and stress the need to account for solar forcing as a source of uncertainty in regional scale projections.”
“This empirical modeling of solar recurrent patterns has also provided a consequent multi-millennial-scale experimental forecast, suggesting a solar decreasing trend toward grand (super) minimum conditions for the upcoming period, AD 2050–2250 (AD 3750–4450). … Solar activity (SA) has non-linear characteristics that influence multiple scales in solar processes (Vlahos and Georgoulis, 2004). For instance, millennia-scale solar oscillations have been recently detected, like those of about 6000 and 2400 years, by Xapsos and Burke (2009) and Charvátová (2000), respectively, with important and interesting influences in the near, past and future climate. These millennialscale patterns of reconstructed SA variability could justify epochs of low activity, such as the Maunder minimum, as well as epochs of enhanced activity, such as the current Modern Maximum, and the Medieval maximum in the 12th century. … We can conclude that the evidence provided is sufficient to justify a complete updating and reviewing of present climate models to better consider these detected natural recurrences and lags in solar processes.“
“By about 2030-2040, the Sun will experience a new grand solar minimum. This is evident from multiple studies of quite different characteristics: the phasing of sunspot cycles, the cyclic observations of North Atlantic behaviour over the past millennium, the cyclic pattern of cosmogenic radionuclides in natural terrestrial archives, the motions of the Sun with respect to the centre of mass, the planetary spin-orbit coupling, the planetary conjunction history and the general planetary-solar-terrestrial interaction. During the previous grand solar minima—i.e. the Sporer Minimum (ca 1440-1460), the Maunder Minimum (ca 1687-1703) and the Dalton Minimum (ca 1809-1821)—the climatic conditions deteriorated into Little Ice Age periods.”
“Solar activity (SA) has non-linear characteristics that influence multiple scales in solar processes (Vlahos and Georgoulis, 2004). For instance, millennia-scale solar oscillations have been recently detected, like those of about 6000 and 2400 years, by Xapsos and Burke (2009) and Charvátová (2000), respectively, with important and interesting influences in the near past and future climate. These millennial-scale patterns of reconstructed solar activity variability could justify epochs of low activity, such as the Maunder Minimum, as well as epochs of enhanced activity, such as the current Modern Maximum, and the Medieval Maximum in the 12th century. Although the reason for these solar activity oscillations is unclear, it has been proposed that they are due to chaotic behavior of non-linear dynamo equations (Ruzmaikin, 1983), or stochastic instabilities forcing the solar dynamo, leading to on-off intermittency (Schmittet al., 1996), or planetary gravitational forcing with recurrent multi-decadal, multi-centennial and longer patterns (Fairbridge and Sanders, 1987; Fairbridge and Shirley,1987; Charvátová, 2000; Duhau and Jager, 2010; Perry and Hsu, 2000). It should be noted that all proponents of planetary forcing have forecasted a solar Grand Minimum for the upcoming decades, but one of them has also forecasted a Super Minimum for the next centuries (Perry and Hsu, 2000). In addition, during recent decades, statistical forecasts (with physically-based spectral information of reconstructed records) of solar magnetic activity predict a clear decrease in solar activity, reaching a minimum around AD 2100 (Steinhilber et al., 2013; S13, hereafter, Velasco et al., 2015).”
A new model of the Sun’s solar cycle is producing unprecedentedly accurate predictions of irregularities within the Sun’s 11-year heartbeat. The model draws on dynamo effects in two layers of the Sun, one close to the surface and one deep within its convection zone. Predictions from the model suggest that solar activity will fall by 60 per cent during the 2030s to conditions last seen during the ‘mini ice age’ that began in 1645.
Results will be presented today by Prof Valentina Zharkova at the National Astronomy Meeting in Llandudno. … Zharkova and her colleagues derived their model using a technique called ‘principal component analysis’ of the magnetic field observations from the Wilcox Solar Observatory in California. They examined three solar cycles-worth of magnetic field activity, covering the period from 1976-2008. In addition, they compared their predictions to average sunspot numbers, another strong marker of solar activity. All the predictions and observations were closely matched. “Combining both waves together and comparing to real data for the current solar cycle, we found that our predictions showed an accuracy of 97%,” said Zharkova.
“Effectively, when the waves are approximately in phase, they can show strong interaction, or resonance, and we have strong solar activity. When they are out of phase, we have solar minimums. When there is full phase separation, we have the conditions last seen during the Maunder minimum, 370 years ago.”
“The Earth’s climate shows a rather regular oscillation of ∼ 200 year period during the last millennia. However, frequency, phase, and strength of the oscillation are found to vary in different time series of temperatures and for different times (see Figs. 4–6, and 5 8). Nonetheless, the relative historic stability of the cycle suggests that the periodic nature of the climate will persist also for the foreseeable future. Disregarding other conceivable forcings e.g. anthropogenic influences, an approximate prediction of the climate for the next 100 years suggests itself. Figure 9 shows the Tsine representation from AD 1800 to AD 2100 derived from the ∆Tsine representation by a π/2 phase shift. 10 It gives correctly the 1850–1900 temperature minimum and shows a temperature drop from present to ∼ AD 2080, the latter comparable with the minimum of 1870, as already predicted in the studies (Steinhilber and Beer, 2013; Liu et al., 2011) on the grounds of solar activity data alone.”
“The estimation of solar activity for the next hundred years is one of the current problems in solar physics because the possible occurrence of a future grand solar minimum will probably have an impact on the Earth’s climate. … Depending on the composite used, PMOD (or ACRIM), we found a grand minimum for the 21st century, starting in ∼2004 (or 2002) and ending in ∼2075 (or 2063), with an average irradiance of 1365.5 (or 1360.5) Wm-2±1σ=0.3 (or 0.9) Wm-2. Moreover, we calculated an average radiative forcing between the present and the 21st century minima of ∼-0.1 (or −0.2) Wm-2, with an uncertainty range of-0.04 to -0.14 (or -0.12 to -0.33) Wm-2.”


Hathaway – 14 November 2016
“….We find that the average strength of the polar fields near the end of Cycle 24 will be similar to that measured near the end of Cycle 23, indicating that Cycle 25 will be similar in strength to the current cycle…..”
‘Predicting the Amplitude and Hemispheric Asymmetry of Solar Cycle 25 with Surface Flux Transport’
David H Hathaway, Lisa A Upton
Accepted manuscript online: 14 November 2016
http://onlinelibrary.wiley.com/doi/10.1002/2016JA023190/full
Looks like an interesting paper that is currently unavailable as it is —
“This article has been accepted for publication and undergone full peer review but has not been through the copyediting, typesetting, pagination and proofreading process, which may lead to differences between this version and the Version of Record. Please cite this article as doi: 10.1002/2016JA023190”
Trying to access the PDF give just an error message.
Darn!
CO2 is taking another vacation to allow those thermal critters to leave the planets surface easily.
The mystery is WHY does awesomely powerful CO2 molecules know when to do that…..
“The most recent Super El Niño natural warming event”
umm Kenneth, an El Niño is actually an ocean COOLING event.
I think most people understand that “El Niño” is the standard shortened way to express the entire warm-cool oscillation (ENSO), so I’m surprised the terms “warming event” were thought to be worth niggling over here. See definitions 5 and 6 below, and notice that the synonym for El Niño is a “warm event” — the exact wording used in the quote above. La Niña events are associated with cooling, the antonym of El Niño warm events.
Trenberth, 1997 “The Definition of El Niño”
http://journals.ametsoc.org/doi/pdf/10.1175/1520-0477%281997%29078%3C2771%3ATDOENO%3E2.0.CO%3B2
El Niño:
2: the name given by Peruvian sailors to a seasonal, warm southward-moving current along the Peruvian coast 3: name given to the occasional return of unusually warm water in the normally cold water [upwelling] region along the Peruvian coast, disrupting local fish and bird populations 4: name given to a Pacific basin-wide increase in both sea surface temperatures in the central and/or eastern equatorial Pacific Ocean and in sea level atmospheric pressure in the western Pacific (Southern Oscillation) 5: used interchangeably with ENSO (El Niño–Southern Oscillation) which describes the basin-wide changes in air–sea interaction in the equatorial Pacific region 6: ENSO warm event
synonym: warm event
antonym: La Niña – the young girl; cold event; ENSO cold event; non-El Niño year; anti-El Niño or anti-ENSO
They are referring to the atmosphere, where the energy goes.
I am referring to the ocean, where the energy comes from 🙂
Yes, heat energy trajectory is ocean—>atmosphere. So I’m still not clear as to why you wish to characterize El Nino warming events as cooling events. Just the other day you wrote this:
How is what you wrote here different than the original quote you are attempting to “correct” – or the substance of this essay itself? You agree the ‘peak of the El Nino’ refers to the peak of the El Nino warming event. Right?
Same, same depending if you are referring to the ocean or the atmospheric effect..
ie can be both or either depending on context.
El Nino is an energy discharge from the ocean that creates a transient type response in the atmosphere.
“can be both or either depending on context.”
And in the context it was used here, it was obviously and appropriately characterized as a warming event. Which is why the response….
“an El Niño is actually an ocean COOLING event.”
…is an unwarranted “correction.” I would assume you knew what was meant in the context it was being used. The synonym for an El Niño is a “warm event”, which is why the clause “the most recent Super El Niño warming event” (2015-’16) was not used incorrectly.
It wasn’t a “correction”..
it was an addendum 🙂
I know that El Nino is nearly always thought of as an atmospheric warming event… but it is ALSO an ocean cooling event.
There are a lot of not too bright people that don’t know where the El Nino atmospheric warming comes from.
Let’s not argue about the same thing 🙂
OT, is anyone else getting a server dialog asking for a name and password?
No idea what my password would be as I don’t remember ever using one.
Yes, I’ve been getting that. Irritating.
I just ignored it by pressing ‘cancel’.
Ditto
Interesting that they are all picking 2030-2040, that is a similar time-frame for both coal and oil to peak in demand.
https://notalotofpeopleknowthat.wordpress.com/2016/11/16/oil-demand-wont-peak-before-2040-despite-paris-deal-iea/#comment-80137
I have a suspicion that the 2040 peak will be a new ongoing demand level for a couple of decades or so.
Western governments have you all got your long term options to fuel your country sorted yet?
“The gradual weakening of the Gulf Stream leads to stronger cooling in the zone of its action in western Europe and the eastern parts of the United States and Canada”
When the Gulf Stream cools, it does not actually slow down but it gets higher viscosity which makes it flow more slowly. It speeds up when warmer as it is less viscous. This is the opposite of what the alarmists say will happen.
The above paper has it right but does not indicate the mechanism of the flow’s slow down.
Charles Higley,
I would have thought that “slowing down” is another way of saying “flows more slowly”. Silly me. 🙂
On the topic of picking cherries. +2.5 degrees per decade.
http://www.woodfortrees.org/plot/rss-land/from:2014.6/to:2016.8/plot/rss-land/from:2014.6/to:2016.8/trend
So is it your belief that both the spike in temperatures, and fall in temperatures, was caused by humans? Or do you believe that El Nino events are natural?
“So is it your belief that both the spike in temperatures, and fall in temperatures, was caused by humans? Or do you believe that El Nino events are natural?”
you did a terrible cherrypick.
the upward trend is over 3.5°C per decade over 2 years.
http://www.woodfortrees.org/plot/rss-land/from:2014.6/to:2016.6/plot/rss-land/from:2014.6/to:2016.6/trend
The COOLING in RSS-land since the peak of the NATURAL El Nino is 1.17ºC
This is the fastest and deepest cooling in the whole of the satellite data.
The fastest 8 month warming has been 0.9ºC
https://s19.postimg.org/yeucrzp4j/RSS_8_month.png
The data makes a FOOL of sop, yet again.
And of course, a change of MINUS 1.17ºC in 8 months ..
.. is a trend of MINUS 17.55ºC/decade. !
Now that’s SCARY !! 😉
““So is it your belief that both the spike in temperatures, and fall in temperatures, was caused by humans? Or do you believe that El Nino events are natural?””
It is noted that sop ignored the question completely.
The ENSO signal is natural but the longer term trend is more than likely not.
Cherry picking, like my example and the example at the very top are just looking at the short term trends. The longer term trend looks like this http://www.woodfortrees.org/plot/rss/from:1980/plot/rss/from:1980/trend .
So if the warming trend in the ENSO signal is natural, what stops that natural warming from imputing itself onto the longer-term trend? How does the natural warming just appear and then disappear like that, and how do you know that it disappears? And what evidence do you have to support your position? See: https://notrickszone.com/2016/11/14/since-1982-temperature-records-show-no-warming-other-than-that-due-to-natural-el-nino-warmth-inducing-events/
Did you realize that enhanced/intensified ENSO phases occur on decadal to centennial scales, and that these enhanced ENSO phases are associated with warm periods like the Medieval Warm Period?
https://www.sciencedaily.com/releases/2016/06/160609115117.htm [press release]
El Niño oscillations in Pacific Ocean may have amplified global climate fluctuations for hundreds of years at a time
Scientists have found past El Niño oscillations in the Pacific Ocean may have amplified global climate fluctuations for hundreds of years at a time. The team uncovered century-scale patterns in Pacific rainfall and temperature, and linked them with global climate changes in the past 2000 years. For example, northern hemisphere warming and droughts between the years 950 and 1250 [Medieval Warm Period] corresponded to an El Niño-like state in the Pacific, which switched to a La Niña-like pattern during a cold period between 1350 and 1900 [Little Ice Age].
—–
http://link.springer.com/article/10.1007/s00382-014-2173-x
The most intense El Niño episodes in more than a century occurred after the 1970s climate shift. Previous studies show that the characteristics of the El Niño-Southern Oscillation (ENSO) phenomenon changed synchronously with the shift, but the associated causes are not fully understood. We present observational evidence which supports the hypothesis that the change in the TPMM [tropical Pacific meridional mode, responsible for the post-1970s climate shift to warming] was triggered by the great salinity anomaly (GSA), which manifested in the North Atlantic during the late 1960s. The GSA induced a weak Labrador convection and a SST dipole south of Greenland. The associated atmospheric structure includes a North Pacific Oscillation sea level pressure dipole in the Pacific sector. This excites the TPMM which contributes to the intense El Niño events and to the enhanced ENSO’s asymmetry, observed after the shift. Our results imply that, if the GSA has not an anthropic origin, as was suggested, then the tropical Pacific climate shift has a natural origin. This is supported by the end of the North Atlantic regime in the 1990s and by the rebound of the tropical Pacific after 1998.
—–
http://www.pnas.org/content/111/41/14716.full.pdf
The bidecadal to centennial climate shifts in the Pacific region during the MCA [Medieval Climate Anomaly] can be described in terms of the latitudinal extent of the tropics and the mean state of the Pacific Ocean region with respect to the persistence or frequency of either phase of the El Niño−Southern Oscillation (ENSO). Shifts in mean climate state result from a change in the timing and frequency of persistent seasonal summer−winter weather patterns, and storm frequency. For example, a shift to more El Niño-like (La Niña-like) climate involves a higher frequency of westerly (southeasterly) winds in the Southern Hemisphere tropics and, on a decadal scale, represents the occurrence of multiyear El Niño (La Niña) events, as seen in recent decades 1980–2000 (1950–1970).
Kenneth,
There is nothing stopping a natural phenomena causing a long term increase in temperatures, but the evidence for ENSO being responsible for this is slim.
The term ‘Oscillation” in the name El-Nino Southern Oscillation is there for a good reason. The ENSO anomaly oscillates around neutral (see https://en.m.wikipedia.org/wiki/El_Niño–Southern_Oscillation#/media/File%3ASoi.svg ) at least since the latter half of the nineteenth century.
It is hard to envisage a physical mechanism that cause long term warming that is based on an SST that oscillates around a mean temperature, unless the mean temperature is itself increasing.
Yes, these mean SST temperatures have increased in the long term but there is a highly plausible non- natural mechanism that can account for this.
There are also claims of increased frequency of El Nino, relative to la Nina events, in recent times but this has been attributed to global warming.
Kenneth, your three links to papers are interesting, but they are only marginally relevant as they do not address trends but refer mainly to changes in the amplitude of ENSO oscillations at various times.
Yes, and who is doing the attributing of enhanced natural El Nino frequencies/intensities to human- or CO2-caused global warming? The same people who believe that CO2 concentrations in volumes of parts per million (0.000001) are capable of dominating as the cause of net changes in deep ocean heat. Which begs the question that I hope you will at least attempt to answer, MikeR:
Please cite a controlled scientific experiment (with direct observation and physical measurements) that shows that varying atmospheric CO2 concentrations up or down in volumes of 0.000001 cause changes in deep ocean heat to depths of 1,000s of meters. If you can’t locate one (you can’t, of course, since it doesn’t exist), see if you can locate a controlled scientific experiment that shows that varying CO2 concentrations up or down by 100 ppm, 1,000 ppm — any ppm volume — physically changes the temperature of any body of water. A pool in a greenhouse with 500 ppm CO2 (control) located directly across from an identical pool in an identical greenhouse with 1,000 ppm CO2 will do. What will the change in water temperature be over a specified time with the added 0.0005 CO2 volume? Do you know? Of course you don’t. No such scientific evidence exists that CO2 heats up water. The entire conceptualization of CO2 heating water bodies is rooted in hypothetical models, not the real world. In other words, it’s a belief. If you don’t think it is, cite the non-modeled physical science that supports your position that it is not a belief, but an observed phenomenon, that varying CO2 by 0.000001 over water bodies cause heat changes. Let’s see what you have. Present your scientific evidence.
And look for the essay that will be posted later today (1 December) regarding the non-detection of an anthropogenic influence on ocean heat content for the last 200 years. And then post a response in that comment section that supports an opposing position (yours). We’d love a good debate.
Kenneth has attempted to avoid my point regarding a physical plausible mechanism by which El-Nino can cause an increase in tropospheric temperatures in the long term (greater than 23 years) .
He has gone on a Gish Gallop (thankfully small) onto a new direction with references to the depths of the oceans. I lack significant knowledge in oceanographic matters , unlike Kenneth, and I am reluctant to comment in this area well outside my expertise. This attitude may be foreign to many who comment here.
My limited understanding is that ENSO involves the surface and subsurface (to about 500 m depth see http://www.bom.gov.au/climate/enso/#tabs=Sea-sub%E2%80%93surface ) and I ‘m not sure whether Kenneth’s references to what occurs at the ‘depth of 1000s of metres’ has any relevance.
Contrary to Kenneth’s declamations , I do not believe anyone has seriously suggested (I may be wrong) that atmospheric CO2 is directly responsible for heating the depths of oceans.
I also note that Kenneth is recycling the meme “what can CO2 at 400 pm (0.04%) do?”. If he believes minority gases have no role to play then I assume he would be happy to dispense with ozone (0.6 ppm) and other lesser gases. In fact, what has that other minority gas oxygen ever done for us (except for suppressing the poor downtrodden nitrogen fixating and other anaerobic organisms)?.
Returning to the pint of the main article ( and removing the tongue that is firmly embedded in my cheek), I would still like for those who advocate that El Ninos are responsible for long term tropospheric warming to provide a plausible physical mechanism for this.
I would even take a semi plausible mechanism.
Finally I am not sure what gives with AndyG55.
I have to repeat it very, very, very slowly. The linked figure in my last post demonstrates that the long term trend hardly changes when you include or exclude major La Nina events. This strongly suggests that these events do not play a significant role in producing the long term increasing trend in tropospheric temperatures.
If Andy is incapable of understanding this , as evidenced by his inane comments, then he has provided a definite answer my ancillary question, do the numerals after his name refer to his age or his IQ?
Wow. So you have, once again, completely avoided responding to the highly relevant question of what physical mechanism allows CO2 concentrations in volumes of 0.000001 to dominate as THE cause of both surface and deep ocean heat as evidenced by scientific experiment. After all, it IS your claim that the Sun and ENSO do not play a significant role in long term warming trends, but CO2 does — and dominates over both solar and ENSO forcing…right? Could you at least have the decency to attempt to support your beliefs about CO2 causing the water temperature changes (from surface to abyssal depths) that have led to the net increase in surface and atmospheric temperatures since the Little Ice Age? You complain that I have “avoided” your point about ENSO by failing to provide evidence, but then you turn around and claim that the scientific evidence I have (briefly) provided is only “Gish Gallop.” I’m beginning to wonder whether or not you truly want to learn about these matters, considering you acknowledge that you know very little about the ocean and what mechanisms lead to its heating.
So as not to be accused of Gishing again, I’ll just provide you with ONE paper that describe the mechanism whereby ocean water temperature variations — and thus long-term net climate changes — occur. You will note that this mechanism does not involve CO2. It is still your call as to whether or not you’d like to at least attempt to support your beliefs that CO2 is the dominant factor controlling net water temperature changes over the long-term with actual scientific data/experiments/physical measurements, or whether you’d like to continue to insist that CO2 concentration variations can and do have an effect on water temperature changes (surface to abyss) without having the scientific evidence to substantiate it.
Why is it that you expect others to provide substantiation for their positions, but you do not think you have to provide substantiation for your belief that CO2 is the dominant cause of net ocean temperature changes over time?
Hope this summary of the following paper isn’t too long for you. Wouldn’t want to be accused of “Gish Gallop” again. If you are interested (and I highly doubt that you are), you could take the time to read more about it. Meanwhile, I’ll wait for you to provide substantiation for your beliefs about CO2 causing water temperature changes. I have a feeling I will be waiting a while.
http://www.pas.rochester.edu/~douglass/papers/PLA_Sun_II_in_press.pdf
Global ocean temperature time series from the surface to depths of 2000 m since the year 2000 are found to agree in detail with those of other diverse climate indices. It is asserted that these systems are driven by a forcing unquestionably of solar origin that has two manifestations: (1) a direct phase-locked response to what is identified as a solar forcing at a frequency of 1.0 cycle/yr for the whole time series; (2) a second phase-locked response at a period of two years or three years. With these findings it is becoming clear that the entire climate system is responding to the varying incident solar radiation… The most prominent manifestations of the pattern are found in the El Niño/La Niña phenomena.
——————————————————–
The IPCC has claimed that “climate forcing” from greenhouse gases (i.e., anthropogenic CO2) will “continue” to warm the deep ocean from “centuries to millennia” even after CO2 emissions have stabilized. So this is completely new information for you that no less than the IPCC has claimed that humans are responsible for warming the deep ocean with their CO2 emissions?
https://www.ipcc.ch/pdf/assessment-report/ar5/wg1/WG1AR5_Chapter03_FINAL.pdf
The ocean’s large mass and high heat capacity allow it to store huge amounts of energy—more than 1000 times that in the atmosphere for an equivalent increase in temperature. The Earth is absorbing more heat than it is emitting back into space, and nearly all this excess heat is entering the oceans and being stored there. The ocean has absorbed about 93% of the combined heat stored by warmed air, sea, and land, and melted ice between 1971 and 2010. The ocean’s huge heat capacity and slow circulation lend it significant thermal inertia. It takes about a decade for near-surface ocean temperatures to adjust in response to climate forcing (Section 12.5), such as changes in greenhouse gas concentrations. Thus, if greenhouse gas concentrations could be held at present levels into the future, increases in the Earth’s surface temperature would begin to slow within about a decade. However, deep ocean temperature would continue to warm for centuries to millennia (Section 12.5), and thus sea levels would continue to rise for centuries to millennia as well (Section 13.5).
roflmao.
Mike R. you have just used both El Ninos to create the trend
The reality is that there are two zero trend period, with an El Nino in the middle and one at the end
The RANK STUPIDITY of putting a monkey drawn line through the whole satellite data marks you as a non-thinker.
RSS before the 1998 El Nino.
https://s19.postimg.org/y6om3sbjn/RSS_Before_El_Nino.jpg
And RSS between the two El Ninos.
https://s19.postimg.org/b7c0ivoqb/RSS_pre_2015.png
Throw off your brain-washing and think. !!
AndyG55
My trained monkeys have been very busy.
The RSS trend for the entire period from 1979 until present is 0.135 degrees per decade. If we look at the trend until prior to the latest El Nino (i.e. up until the end of 2015) the trend is 0.124 degrees per decade. Removing the 1998 El Nino as well as the latest El-Nino , the trend is 0.122 degrees per decade.
Note the minimal impact of major El-Ninos on the trend.
See https://s20.postimg.org/fabbcs1jx/RSS_v3_3.jpg .
By the way the period of time for which you show the RSS data above is less than the minimum 23 year period which is required to obtain a statistically significant trend value, see https://wattsupwiththat.com/2016/09/19/uah-and-enso-now-includes-july-and-august-data/ and https://moyhu.blogspot.com.au/p/temperature-trend-viewer.html.
Andy, the above discussion of trends may not be relevant as you seem unable to perform a trend line fit to your data.
If this is indeed the case, you should get your own personal monkey to help you. Just a word of advice. Make sure you don’t eat a banana while doing this, as in these circumstances, some monkeys can get extremely violent.
“The RSS trend for the entire period from 1979 until present is 0.135 degrees per decade.”
ROFLMAO… you just used the El Ninos again
PROVING my point
Thank you ! 🙂
There was NO WARMING from 1980-just before the 1998 El Nino.
https://s19.postimg.org/y6om3sbjn/RSS_Before_El_Nino.jpg
There was NO WARMING between the El Ninos.
https://s19.postimg.org/im6e8dgxf/RSS_pre_2015.png
Sorry that your monkeys can’t come to grips with this.. Find someone to train them better.
“My trained monkeys have been very busy.”
Don’t forget to give them some plastic bags to clean up your poop after you.
pps.. I want to see you put a linear trend line through the pre-1998 data. 😉
please do it, so we can all laugh at your sad ineptitude and total lack of mathematical understanding trend lines with cyclic data.
Viewing the work of your monkey-brain will be truly funny 🙂
“Note the minimal impact of major El-Ninos on the trend.”
ROFLMAO.
The 1998 El Nino gave a step change.
Your childish attempt still uses that NON-CO2 driven El Nino step change to create a trend. DOH !!!
Your monkeys need to teach you, because you have sure failed with their education.
“The 1998 El Nino gave a step change.”
No, it did not. You need a statistical tool to show a step change.
Please provide us your analysis!
sod: “You need a statistical tool to show a step change.”
sod, please provide a statistical tool that demonstrates that raising or lowering CO2 concentrations in volumes of ppm (0.000001) cause net changes (i.e., step changes) in ocean temperatures — or any water body’s temperature for that matter. Cite the scientific source for this statistical tool and the scientific experiment/physical measurements verifying it.
The El Nino gave a step change..
And it is that step change that gives to only warming in the satellite era.
before that step change there was no warming
https://s19.postimg.org/y6om3sbjn/RSS_Before_El_Nino.jpg
after that step change up until the beginning of the current now disappearing El Nino, there was NO WARMING
https://s19.postimg.org/im6e8dgxf/RSS_pre_2015.png
Between these two ZERO WARMING periods, there was a step up of about 0.26ºC
You can DENY this fact as long you like, but all it does is make you look even more of a fool.
“You can DENY this fact as long you like, but all it does is make you look even more of a fool.2
you look like a fool, not me. many positive trends will “look” like a step change. Most positive trends with a “el nino” type noise effect thrown in will look like a step change.
Statistics has tools to spot step changes.
If you had any clue on the subject, you would be showing some statistical analysis.
Since you seem to believe you are well-informed on this subject, will you please attempt to provide an answer to this fundamental question (below), sod? I’ve asked you this question probably about 10 times now. Why not finally answer it?
sod, please provide a statistical tool that demonstrates that raising or lowering CO2 concentrations in volumes of ppm (0.000001) cause net changes (i.e., step changes) in ocean temperatures — or any water body’s temperature for that matter. Cite the scientific source for this statistical tool and the scientific experiment/physical measurements verifying it.
ROFLAMO..
Two 15 year long, basically ZERO TREND, with a STEP of 0.26ºC between them
GET OVER IT !!!!!
The ONLY warming in the satellite data has come from those EL Ninos and some minor ocean circulations like the AMO..
Drawing trend lines across EL Ninos as alarmist HAVE to do to show any trend, PROVES that point.
A trend cannot be FABRICATED without using those El Nino events, as you and your alarmist cultists prove, every time you do it.
I’m sorry that your low level abilities at EVERYTHING cannot come to grips with the truth.
But that is your ignorance and incompetence, and not mine to waste my time trying to fix.
Heck, even HadSST data shows this MAJOR step change.
https://bobtisdale.wordpress.com/2008/12/12/the-step-change-in-hadsst-data-after-the-199798-el-nino/
It is NOTHING to do with atmospheric CO2 because CO2 cannot affect sea temperatures.
RSS El Nino Step change in graphical form so that even a brain-dead twerp like sop can see it
https://s19.postimg.org/v9zxq3zzn/RSS_El_Nino_step.png
Note that the only reason the trend in the first period is slightly +ve is because of the 0.4ºC COOLING at the start of the section, from 1980-1985. Those with adequate maths/stats comprehension will realise this, (no, not you sop)
“many positive trends will “look” like a step change”
And in this case, the positive trend is CREATED by the step change
Step changes will always produce a linear change IF you are dumb enough to apply linear rules to something that is not linear.
And you, sop, have proven that you are CERTAINLY dumb enough.
Do you DENY that an El Nino is an “event”, ie a transient release of energy from the ocean, and therefore is NOT linear.?
“sod, please provide a statistical tool that demonstrates that raising or lowering CO2 concentrations in volumes of ppm (0.000001) cause net changes (i.e., step changes) in ocean temperatures ”
You are asking a difficult question. This can not be done with a simple statistical test.
Whether there are step changes in the temperature record is simple.
you could learn about it here:
https://tamino.wordpress.com/2012/01/09/steps/
“This can not be done with a simple statistical test.”
Please cite a physical scientific experiment that shows CO2 heats water…no statistical tools are necessary.
All you’ve done is show (via blogscience) that you can see step changes in temperature datasets. That doesn’t explain how CO2 causes step changes by changing the heat properties of water. Obviously, you’re incapable of doing this.
Summing up the sot’s argument so far.
“You need a statistical tool to show a step change.” – sod
“sod, please provide a statistical tool that demonstrates that raising or lowering CO2 concentrations in volumes of ppm (0.000001) cause net changes (i.e., step changes) in ocean temperatures — or any water body’s temperature for that matter.” – Kenneth Richard
“Statistics has tools to spot step changes.” – sod
“sod, please provide a statistical tool that demonstrates that raising or lowering CO2 concentrations…” – Kenneth Richard
“If you had any clue on the subject, you would be showing some statistical analysis.” – sod
“sod, please provide a statistical tool that demonstrates that raising or lowering CO2 concentrations…” – Kenneth Richard
“You are asking a difficult question. This can not be done with a simple statistical test.” – sod
Stay tuned for more exciting developments as sob reveals even more profound depths of his/her/it’s whatever intellect.
Poor sop, If you cite places like “Tamino’s closed and empty mind”..
… you will come across as someone with a closed and empty mind.
As usual.
Kenneth
I note that you have studiously avoided a response to my request for a physically plausible mechanism by which el-Nino can cause a long term increase in tropospheric temperatures by going off on tangents, first of all plumbing the depths of the oceans ( I seem to recall the discussion was about RSS satellite data!) and now invoking the sun and ocean
Kenneth do you actually read these papers that you link to or it just a cut and paste from a compendium that you have diligently accumulated?
The paper you link to by Douglass and Knox is “interesting” in a bizarre way. Firstly Douglass does not go the well worn route of making claims regarding the influence of sunspot numbers and T.S.I. etc. He ignores he eleven year cycle and claims that there is a 1 year cycle which is not unreasonable due to changes in solar irradiance which result from the eccentricity of the earth’s orbit. He also claims that there are longer sub-harmonic periods due to the phase delays of the ocean’s response.
However with regard to trends, the paper massively overreaches and has major problems. The only reference to trends is a small section before the conclusion.
It is clear even after a very cursory read of this paper that there are at least 5 major flaws in this section .
They are as follows
1. Equation 3 has an obvious typo (it should read dt in the denominator).
2. Equation 3 also does not appear to be dimensionally correct (with or without the correction).
3. The values quoted in Table 1 are not consistent with Equation 3 for the same data set. For example T700 the value of D (depth)required to give the appropriate number for the derivative of the Ocean Heat Content is about 8 m for the first set and D=0.5 m for the second set.
4. They do not give the confidence levels for their estimate of uncertainties in the slope of Delta T.
5. They also do not state how they obtained these uncertainties . Did they use an unbiased OLS estimate or did they also include the uncertainties due to serial correlation? If the latter, what model did they use for the serial correlation? The briefness of periods that phase locking is assumed to occur are major issue, as the trends will have enormous uncertainties for estimates of the trend in temperature over a relatively small interval of time.
Another aspect that is questionable is that the authors could only use this analysis for limited numbers of years where they could detect phase locking. For instance from the period from 2008 to 2013 was not included which is a pity because the temperature trend was high for this period.
It is clear that the journal reviewers of this paper had fallen asleep at the wheel by the time they got to this latter section. It is the only conceivable explanation for letting this paper pass review. As it stands the only place this work should have been published is in the Daily Mirror .
Finally I have things better to do than follow Kenneth down the deep ocean rabbit hole at full gallop. I will just link to http://ipcc-wg2.gov/AR5/images/uploads/WGIIAR5-Chap30_FINAL.pdf (see Section 30.3) .
By the way the November RSS data for land has come out and the figure is up by almost a factor of 3, see http://data.remss.com/msu/monthly_time_series/RSS_Monthly_MSU_AMSU_Channel_TLT_Anomalies_Land_v03_3.txt. Kenneth, I think if you desire any residual credibility you should update the figure at the top.
Any way you could explain why it is you think it is tangential to the subject at hand to reference ocean heat change as a barometer of anthropogenic global warming (as opposed to atmospheric temperature changes) since, as the IPCC acknowledges, the atmosphere only represents 1% of heat budget changes, whereas the oceans represent 93%? Did you think that El Ninos are an air–>ocean phenomenon, or is it new information for you that it is the other way around (ocean–>air)?
https://www.ipcc.ch/pdf/assessment-report/ar5/wg1/WG1AR5_Chapter03_FINAL.pdf
“Ocean warming dominates the total energy change inventory, accounting for roughly 93% on average from 1971 to 2010 (high confidence). The upper ocean (0-700 m) accounts for about 64% of the total energy change inventory. Melting ice (including Arctic sea ice, ice sheets and glaciers) accounts for 3% of the total, and warming of the continents 3%. Warming of the atmosphere makes up the remaining 1%.”
Of course, I know the reason why you wish to avoid discussing ocean heat changes: because you know you have absolutely no scientific evidence to present that demonstrates that atmospheric CO2 changes in volumes of 0.000001 cause heat changes in the global oceans — where 93% of the heat energy from global warming is contained. Because you know that it is only a belief of yours that carbon dioxide causes heat changes in the global oceans, you wish to continue to ignore my highly relevant questions asking you for evidence that might substantiate your position/belief that changes in oceanic temperature are predominantly caused by CO2. I understand your problem, mikeR. You haven’t got the science on your side that might support your belief that CO2 is the cause of water temperature changes. So…you dither.
You offered us a ridiculous “critique” of one peer-reviewed scientific paper that didn’t conform to your beliefs. mikeR, here’s a link to a compilation of 107 peer-reviewed scientific papers linking solar forcing to climate changes authored by hundreds of scientists from just the last 11 months alone (2016). Eleven more have been added to that list since it was published, bringing the total to 118 for 2016. There were 95 Sun-Climate papers published in 2015, and 93 in 2014. You’ve offered us one quite substantive critical review (“the only place this work should have been published is in the Daily Mirror”) of one science paper linking solar-ENSO forcing to climate changes. Try critiquing over 300 since 2014.
https://notrickszone.com/2016/11/21/the-sun-climate-connection-over-100-scientific-papers-from-2016-link-solar-forcing-to-climate-change/
While you’re at it, see if you can explain why it is you believe an anthropogenic signal is detectable in ocean heat data….
https://notrickszone.com/2016/12/01/new-paper-human-climate-forcing-below-detection-deep-oceans-warm-by-2c-within-200-years-100-naturally/
…or why you believe that CO2 forcing caused temperature changes in recent decades when there has been a hiatus in the greenhouse effect since 1992:
https://notrickszone.com/2016/09/19/new-paper-documents-imperceptible-co2-influence-on-the-greenhouse-effect-since-1992/
While MikeR doesn’t seem to like it, Roger Pielke Sr refers to it as “…the scientifically sound paper by Knox and Douglas.”
[ I don’t see the first two of MikeR’s objections as anything but silly. I don’t want to address the others without reading a bit more of the background on this and related matters.
http://www.pas.rochester.edu/~douglass/papers/ ]
If I’m understanding Douglass, he seems to be claiming (legitimately, I think) that if there’s neither excess nor deficiency in energy input, then the system becomes “locked.” It gets interesting when there is excess or deficiency, and when we’re able to quantify that (or at least approximate it by his methods), then we’ll have a good handle on the earth’s actual, as opposed to imagined, heat budget.
In any case, I would say he’s onto something, or the hounds (Cook, Trenberth, and the rest of the Warmunistas wouldn’t be attacking him so violently).
RPSr has proven himself to be very bitter and biased. Just read his Twitter.
“Kenneth do you actually read these papers that you link to or it just a cut and paste from a compendium that you have diligently accumulated?”
i seriously doubt that Kenneth is reading any papers, definitely not in any critical way. Basically he is compiling lists of papers that mention certain key words (cycle, deep ocean, solar, …) or acceptable trends (basically everything going down) or historic data that fits his believes.
This “method” (accept everything that supports your thesis, ignore every problem in those papers, ignore all papers that contradict them) can proof absolutely everything.
“i seriously doubt that Kenneth is reading any papers, definitely not in any critical way.”
Perhaps you could provide a critical analysis of these papers, sod:
Hertzberg and Schreuder, 2016
http://eae.sagepub.com/content/early/2016/10/21/0958305X16674637.abstract
http://www.tech-know-group.com/papers/Reassessing_CO2_climate_role.pdf
The authors evaluate the United Nations Intergovernmental Panel on Climate Change (IPCC) consensus that the increase of carbon dioxide in the Earth’s atmosphere is of anthropogenic origin and is causing dangerous global warming, climate change and climate disruption. The totality of the data available on which that theory is based is evaluated. The data include: (a) Vostok ice-core measurements; (b) accumulation of CO2 in the atmosphere; (c) studies of temperature changes that precede CO2 changes; (d) global temperature trends; (e) current ratio of carbon isotopes in the atmosphere; (f) satellite data for the geographic distribution of atmospheric CO2; (g) effect of solar activity on cosmic rays and cloud cover. Nothing in the data supports the supposition that atmospheric CO2 is a driver of weather or climate, or that human emissions control atmospheric CO2.
Vares et al., 2016
http://file.scirp.org/Html/7-2801173_63199.htm
Quantification of the Diminishing Earth’s Magnetic Dipole Intensity and Geomagnetic Activity as the Causal Source for Global Warming within the Oceans and Atmosphere
Quantitative analyses of actual measurements rather than modeling have shown that “global warming” has been heterogeneous over the surface of the planet and temporally non-linear. Residual regression analyses by Soares (2010) indicated increments of increased temperature precede increments of CO2 increase. The remarkably strong negative correlation (r = -0.99) between the earth’s magnetic dipole moment values and global CO2-temperature indicators over the last ~30 years is sufficient to be considered causal if contributing energies were within the same order of magnitude. Quantitative convergence between the energies lost by the diminishing averaged geomagnetic field strength and energies gained within the ocean-atmosphere interface satisfy the measured values for increased global temperature and CO2 release from sea water. The pivotal variable is the optimal temporal unit employed to estimate the total energies available for physical-chemical reactions. The positive drift in averaged amplitude of geomagnetic activity over the last 100 years augmented this process. Contributions from annual CO2 from volcanism and shifts in averaged geomagnetic activity, lagged years before the measured global temperature-CO2 values, are moderating variables for smaller amplitude perturbations. These results indicated that the increase in CO2 and global temperatures are primarily caused by major geophysical factors, particularly the diminishing total geomagnetic field strength and increased geomagnetic activity, but not by human activities. Strategies for adapting to climate change because of these powerful variables may differ from those that assume exclusive anthropomorphic causes.
Kristoufek, 2016
https://arxiv.org/pdf/1611.03646.pdf
After controlling for the effect of the CO2 emissions on temperatures, the dependence between sunspot numbers and temperatures increases considerably. Importantly, the connection is now statistically significant even for periods after 1960. The dominant scale overlaps with the one for original series, i.e. around 21-22 years. The correlation between series is positive and the changes in sunspot numbers precede the changes in temperatures, which is represented by phase arrows pointing southeast for the significant periods. In the same manner as for the original series, the relationship is much stronger for the northern hemisphere temperatures with statistically significant connection over the whole analyzed period [1880-2016]. …The relationship for the global temperature (Fig. 5) in a way represents an average between the southern and the northern hemisphere with statistically significant connection between the sunspot numbers and temperatures for almost the whole analyzed period [1880-2016]. For the significant regions, the connection is positive and changes in the solar activity precede changes in the global temperatures.
Easterbrook, 2016
http://www.sciencedirect.com/science/article/pii/B9780128045886000148
Global temperature changes show excellent correlations with sunspots, total solar irradiance, 14C and 10Be production in the upper atmosphere, and cosmic ray incidence. Periods of global cooling coincided with these changes during the Oort, Wolf, Maunder, Dalton, 1880–1915, and 1945–1977 Solar Minimums. Increased14C and 10Be production during times of increased cosmic radiation serves as a proxy for solar activity. Increased cloudiness, produced by ionization of aerosols in the atmosphere by cosmic rays, causes increased reflection of incoming solar irradiance and results in cooling of the atmosphere. The amount of cosmic radiation is greatly affected by the sun’s magnetic field, so during times of weak solar magnetic field, more cosmic radiation reaches the Earth, creating more cloudiness and cooling the atmosphere. This mechanism accounts for the global synchronicity of climate changes, abrupt climate reversals, and climate changes on all time scales. Thus, cloud-generating cosmic rays provide a satisfactory explanation for both long-term and short-term climate changes.
Luening and Vahrenholt, 2016
https://www.researchgate.net/publication/308928345_The_Sun%27s_Role_in_Climate
The amplitude of the observed temperature fluctuations is often more than 1°C and thus has a similar or even greater range than the warming that has occurred since the Little Ice Age. Furthermore, many of these Holocene, natural climate fluctuations show the same level of abruptness as the 20th-century warming. A common characteristic of many of the documented millennial climate fluctuations is their good match with solar activity changes, as well as a North Atlantic climate record by Bond et al. (2001). Besides solar activity changes, internal millennial ocean cycles may have contributed to the observed climate oscillations.
de Larminat, 2016
http://www.sciencedirect.com/science/article/pii/S1367578816300931
[T]he recent anthropogenic contribution is found to be less than the contribution of solar activity. Reflecting the predominance of internal variability in the error output, the natural contribution (solar and volcanic activities, plus internal variability) becomes clearly much greater than the anthropogenic contribution in the recent warming.
Harde, 2016
http://downloads.hindawi.com/journals/ijas/aip/9251034.pdf
Including solar and cloud effects as well as all relevant feedback processes our simulations give an equilibrium climate sensitivity of CS = 0.7 °C (temperature increase at doubled CO2) and a solar sensitivity of SS = 0.17 °C (at 0.1 % increase of the total solar irradiance). Then CO2 contributes 40 % and the Sun 60 % to global warming over the last century.
“Perhaps you could provide a critical analysis of these papers, sod:”
The first of those papers was published in Energy and environment.
There have been 23 references to papers published in the peer-reviewed scholarly journal Energy and Environment in the last two IPCC reports. Why are you citing blogscience (Tamino) to support your beliefs while at the same time you’re opposed to a reference from a peer-reviewed scholarly journal extensively cited by the IPCC?
What a PATHETIC cop-out from sop. !!
Kenneth
“There have been 23 references to papers published in the peer-reviewed scholarly journal Energy and Environment in the last two IPCC reports”.
I gather this is Kenneth’s source of “facts” – http://www.populartechnology.net/2010/04/correcting-misinformation-about-journal.html#IPCC which lists 6 publications that appeared in the IPCC Fifth Assessment Report (AR5) (2014).
Looking at the final report itself at http://www.climatechange2013.org/images/report/WG1AR5_ALL_FINAL.pdf ( warning massive download) it appears that only 2 publications from this journal made the cut. There were 195 pages of references in the IPCC report which contained just under 10,000 references., so the 2 references which may have been impressive to some, corresponds to a concentration of 0.02% or 200 ppm.. Many authors in the IPCC report had more than 10 times the number of references than the total output of the authorship of this journal. This is all entirely consistent with this journal’s pathetic citation index (0.5) and ranking (98 out 104 in the field).
Another metric is the number of citations in the past 3 years ( see http://www.scimagojr.com/journalrank.php?area=2300 ).” Energy And Environmen”t is the 663 ranked journal in the area of Environmental Science. It has had a grand total of 109 citations. In comparison, the almost identical sounding ” Energy and Environmental Sciences” was ranked no 1 with 29,756 citations.
The above just confirms the deserved reputation of this journal.
Actually, there are 21 from the last two reports — not 6, as you oddly claim. Two of the papers were cited twice, or in different chapters, which I didn’t catch when I last read this list a few years ago (and why I remembered the number 23 instead of 21). So this was my honest mistake. I have no idea, mikeR, how you could possibly have miscounted by 15 in claiming there were only 6 E&E citations from the last two IPCC reports. It’s hard to imagine that a “mistake” like that was honest.
1. McIntyre, S., and R. McKitrick, 2003: Corrections to the Mann et al. (1998) proxy database and northern hemispheric average temperature series. Energy Environ., 14, 751–771.
2. McIntyre, S., and R. McKitrick, 2005b: The M&M critique of the MBH98 Northern Hemisphere climate index: Update and implications. Energy Environ., 16, 69–99.
3. Castles, I. and D. Henderson, 2003: The IPCC emission scenarios: an economic-statistical critique. Energ. Environ., 14, 159-185.
4. Goklany, I.M., 2005: A climate policy for the short and medium term: stabilization or adaptation? Energ. Environ., 16, 667-680.
5. Nicholls, N. and D. Collins, 2006: Observed change in Australia over the past century. Energy and Environment, 17, 1-12.
6. Castles, I. and D. Henderson, 2003a: Economics, emissions scenarios and the work of the IPCC. Energy and Environment, 14(4), pp. 415- 435.
7. Castles, I. and D. Henderson, 2003b: The IPCC emission scenarios: an economic-statistical critique. Energy and Environment, 14(2-3), pp. 159-185.
8. Goklany, I.M., 2003: Relative contributions of global warming to various climate sensitive risks, and their implications for adaptation and mitigation. Energy and Environment, 14(6), pp. 797-822.
9. Grübler, A., N. Nakicenovic, J. Alcamo, G. Davis, J. Fenhann, B. Hare, S. Mori, B. Pepper, H. Pitcher, K. Riahi, H.H. Rogner, E.L. La Rovere, A. Sankovski, M. Schlesinger, R.P. Shukla, R. Swart, N. Victor, and T.Y. Jung, 2004: Emissions scenarios: a final response. Energy and Environment, 15(1), pp. 11-24.
10. McKibbin, W.J., D. Pearce, and A. Stegman, 2004a: Can the IPCC SRES be improved? Energy and Environment, 15(3), pp. 351-362.
11. Nakicenovic, N., A. Grübler, S. Gaffin, T.T. Jung, T. Kram, T. Morita, H. Pitcher, K. Riahi, M. Schlesinger, P.R. Shukla, D. van Vuuren, G. Davis, L. Michaelis, R. Swart, and N. Victor, 2003: IPCC SRES revisited: a response. Energy and Environment, 14(2-3), pp. 187-214.
12. Bertoldi, P., S. Rezessy, and D. Ürge-Vorsatz, 2005: Tradable certificates for energy savings: opportunities, challenges and prospects for integration with other market instruments in the energy sector. Energy and Environment, 16(6), pp. 959-992.
13. Betz, R., W. Eichhammer, and J. Schleich, 2004: Designing national allocation plans for EU emissions trading – A first analysis of the outcomes. Energy & Environment, 15(3), pp. 375-425.
14. Meyer, N.I., 2004: Development of Danish wind power market. Energy & Environment, 15(4), pp.657-672.
15. Moe, A., K. Tangen, V. Berdin, and O. Pluzhnikov, 2003: [E]missions trading and green investments in Russia. Energy & Environment, 14(6), pp. 841-858.
16. Loehle, C., and J. H. McCulloch, 2008: Correction to: A 2000-year global temperature reconstruction based on non-tree ring proxies. Energy Environ., 19, 93–100.
17. Boretti, A., and T. Watson, 2012: The inconvenient truth: Ocean levels are not accelerating in Australia or over the world. Energy Environ., 23, 801–817
18. Nicholls, N., D. Collins, 2006: Observed climate change in Australia over the past century. Energy & Environment, 17(1), 1-12.
19. Held H., M. Ragwitz, and R. Haas (2006). On the success of policy strategies for the promotion of electricity from renewable energy sources in the EU, Energy & Environment 17 849–868 pp.
20. Eisenberger P., R. Cohen, G. Chichilnisky, N. Eisenberger, R. Chance, and C. Jones (2009). Global Warming and Carbon-Negative Technology: Prospects for a Lower‐Cost Route to a Lower-Risk Atmosphere. Energy & Environment. 20, 973–984 pp.
21. Klobasa M., J. Winkler, F. Sensfuß, and M. Ragwitz (2013). Market Integration of Renewable Electricity Generation – The German Market Premium Model, Energy & Environment 24 127–146 pp.
——————————————————————————————————————-
By the way, mikeR, I’ve asked you several times if you could cite a controlled scientific experiment that shows CO2 variations in volumes of 0.000001 cause heat changes in water. You’ve yet to provide any physical measurements confirming this belief you have that CO2 variances cause water temperature variances. Why do you keep avoiding this question? It’s fundamental to your beliefs.
If CO2 concentrations were raised by +10 ppm (0.00001) over a swimming pool, how much warming would that cause? If CO2 concentrations were lowered by -10 ppm over a swimming pool, how much cooling would that cause? Physical measurements and citations, please. Back up your claims that the 2015-’16 sea water temperature anomalies (very warm) were predominantly caused by the 0.000003 change in atmospheric CO2 during this period.
“Perhaps you could provide a critical analysis of these papers, sod”
sop says, “oooh too hard, I don’t like it”
…and runs back to his inner-city latte ghetto.
“‘Perhaps you could provide a critical analysis of these papers, sod:’ – Kennith Richard
The first of those papers was published in Energy and environment.” sod
And there you have it. Back him into a corner, and he regurgitates his late.
(It’s a common lower life form reflexive defense mechanism.)
Energy and environment???
It’s been known as a very crappy journal since my 2003 Scienific American article exposed its editor:
“Hot Words: A claim of nonhuman-induced global warming sparks debate,” Scientific American, June 24, 2003 (Web) and August 2003 (print), pp. 20-22.
http://www.scientificamerican.com/article/hot-words-2003-06-24/
I agree with you sod — Kenneth certainly does not take the time to read these papers in a critical fashion.
Blind people: 2016 will be the warmest year on record.
Can’t disprove that with a statistically insignificant small-month, cherry picked trend.
You deniers are getting every more desperate and pathetic.
So what was the cause of the anomalously warm SSTs during 2015-’16, since there is no scientific evidence (observational, experimental, physical measurements…) that show varying CO2 over a body of water in volumes of parts per million (+ or – 0.000001) cause heat changes in water, as the heat from greenhouse gases does not penetrate into the ocean itself (as acknowledged by RC, SkS)? If not CO2, what was the causal mechanism that led to the anomalously warm weather from mid-2015 to early 2016? If you still think it’s CO2, please cite the scientific experiment (complete with physical measurements) that demonstrates CO2 heats water by several tenths of a degree C when increased in volumes of +0.000003 (+3 ppm) as it did during 2015-’16. And then explain the cause of the -1.2 C anomalous temperature drop over land (RSS) within the last several months. Did CO2 cause the recent cooling, or was it only the warming?
Rotten Appell still doesn’t comprehend “El Nino”
And probably never will.
Just more desperate low-level propaganda from him,
He is also ignoring the first 3/4 of the Holocene, the RWP, the MWP, all of which were warmer than now.
The planet’s temperature is still only a tiny amount above the coldest period in the last 10,000 years.
That’s the real state of the climate and only an ignorant fool would deny that.
Kenneth: E&E has been known to be a junk journal since 2003, when I exposed the editor’s biases.
It’s only gone downhill from there.
Go learn, sonny.
So why has the IPCC cited 21 Energy and Environment papers in their 2007 and 2013 reports? Does the IPCC have such low standards that they routinely cite “junk”? Or did you think that as long as you consider a journal “junk”, therefore, by your authority, it must be so? It doesn’t appear that your opinions are revered around here as much as you think they should be.
““E&E has been known to be a junk journal since 2003”
I didn’t know you wrote for E&E, appell-worm.
Or is one that wouldn’t print your sci-fantasy claptrap.
“when I exposed the editor’s biases.”
So I was right.. David is all upset because a reputable magazine wouldn’t print his juvenile, biased, anti-science claptrap.
JILTED, hey rotten-appell.
Yonasan – “While MikeR doesn’t seem to like it, Roger Pielke Sr refers to it as “…the scientifically sound paper by Knox and Douglas.””
Roger Pielke was referring to earlier papers such as,
https://pielkeclimatesci.wordpress.com/2011/01/10/my-comments-on-robert-s-knox-and-david-h-douglass-kevin-trenberth-on-missing-heat/) and not the current paper.
I personally would be fascinated to see Roger Pielke’s comments about this latest paper especially with regard to the latter part of the paper.
Yonasan – “ I don’t see the first two of MikeR’s objections as anything but silly.”
Yes they are relatively minor compared to the other more egregious faults but clearly Yonasan has not reviewed a scientific publication. This presence of these types of typo normally flags other more serious issues and this turned out to be, indeed the case, once you scratched the surface.
Yonasan – “I don’t want to address the others without reading a bit more of the background on this and related matters.”
Sounds like a very wise idea. Get back to us when you have finished your reading.
Yonasan – “If I’m understanding Douglass, he seems to be claiming (legitimately, I think) that if there’s neither excess nor deficiency in energy input, then the system becomes “locked.” It gets interesting when there is excess or deficiency, and when we’re able to quantify that (or at least approximate it by his methods), then we’ll have a good handle on the earth’s actual, as opposed to imagined, heat budget.
In any case, I would say he’s onto something, or the hounds (Cook, Trenberth, and the rest of the Warmunistas wouldn’t be attacking him so violently)”
Has Cook (which one? John maybe?) and Trenberth attacked any of his work since the early part of this decade? I am not aware of these attacks, but I will stand corrected, if this is the case.
Finally I must make some additional comments about the latest Douglass and Knox papers.
These papers are based on the earlier 2011 paper by Douglass see http://www.pas.rochester.edu/~douglass/papers/5-2800127.pdf)
This work has been cited twice since 2011. The two citations are by guess who? For the answer, click here – https://scholar.google.com.au/scholar?cites=14206794797946881168&as_sdt=2005&sciodt=0,5&hl=en .
This absence of citations by other is usually a strong indication of the significance of this publication, which clearly sank without a trace.
Similarly , if you look at most of the more recent work of the authors on climate change , the same pattern is evident. Very few citations other than by the authors.
To paraphrase an old adage- ” The only thing worse than being criticized is being ignored”.
My major concern is however, is not so much with the authors, who are now well into their 80,s but the obvious lack of peer review by the journal Physics Letter A that allowed this paper to be published without the necessary oversight. What a pity for the journal.
mikeR again employs the “argument from authority” logical fallacy in “arguing” that a paper he doesn’t like is meritless. If it doesn’t have very many citations, it must be wrong. Right?
This publication, Ramanathan et al., 1989, has 1,400 citations. It says this:
“The size of the observed net cloud forcing is about four times as large as the expected value of radiative forcing from a doubling of CO2. The shortwave and longwave components of cloud forcing are about ten times as large as those for a CO2 doubling.”
So it’s settled, then. CO2 plays a negligible role in the greenhouse effect relative to natural factors. We know it’s true because this paper has so many citations. Right, mikeR?
By the way, mikeR. Please cite a peer-reviewed scientific paper that actually provides experimental, observational evidence (with physical measurements) that CO2 heats up water. We’ll see how many citations it has so we can determine its truth. Last time I asked you to do this, you cited 4 blog essays instead of a peer-reviewed paper, with two of the 4 skeptical scientists’ blogs (Curry, Spencer) who don’t agree with your beliefs about climate sensitivity to CO2 anyway. How about an actual peer-reviewed publication in a scientific journal — with citations — this time.
Kenneth,
I did explicitly refer above to “the 6 publications that appeared in the IPCC Fifth Assessment Report (AR5) (2014)”. It took several hours to download the report but, if needed, I can download the 2001 and 2007 reports and see how many survived the cull and appeared in the final reports and whether the hit rate was better(or worse) than 2 in 10,000.
With regards to your reference to ocean surfaces and the green house effect, I reluctantly, and against my better instincts, follow you down your rabbit hole. I am not a climate scientist or an oceanographer and I prefer to leave much o this material , like open heart surgery , to the experts.
I refer to your statements above” show varying CO2 over a body of water in volumes of parts per million (+ or – 0.000001) cause heat changes in water, as the heat from greenhouse gases does not penetrate into the ocean itself (as acknowledged by RC, SkS)?
Real climate has covered this here – http://www.realclimate.org/index.php/archives/2006/09/why-greenhouse-gases-heat-the-ocean/ and Skeptikal Science also has many articles debunking your claims see for instance http://www.skepticalscience.com/How-Increasing-Carbon-Dioxide-Heats-The-Ocean.html .
Two other references that you should look at are https://judithcurry.com/2014/05/21/mechanisms-for-warming-of-the-oceans/ and http://www.drroyspencer.com/2014/04/can-infrared-radiation-warm-a-water-body/ .
After reading the above, it is clear that you are out on a limb. I think it is time to reverse the onus of proof and ask a similar question, what, scientific evidence do you have from the vast trove of publications that rule out heating of a body of water via the green house effect at CO2 levels of 400 ppm?
mikeR, E&E papers are referenced 21 times in the last two reports. So why did you decide to claim that I wrote there are 21 (23) from only the last report when I clearly wrote that number was from the last 2? To me that’s just dishonest.
Wonderful, so the best you can come up with is blogscience – two of them committed skeptical blogs whose originators espouse very low climate sensitivity to CO2 — to support the most fundamental aspects of your beliefs. Why is the question of whether or not CO2 heats water a “rabbit hole” question in your view? It’s the most basic aspect of the entire conceptualization of humans causing global warming!
Apparently you believe I have never read any of these blog posts before. As expected, you have no actual scientific evidence that CO2 heats water, just blogscience steeped in speculation and modeling. Both RC and SkS say the same things (actually, the SkS blogpost was written by a non-scientist (former police officer) who essentially changed a few words around from the RC post). Both blogs admit that (a) no scientific experiment has ever shown that heat from CO2 (a) penetrates into the ocean itself, or (b) actually heats water (clouds which have 10s of times more radiative forcing range than does CO2 within the GHE, are used as a proxy).
SkS: “Greenhouse gases, such as carbon dioxide, trap heat in the atmosphere and direct part of this back toward the surface. This heat cannot penetrate into the ocean itself”
SkS: “Obviously it’s not possible to manipulate the concentration of CO2 in the air in order to carry out real world experiments, but natural changes in cloud cover provide an opportunity to test the principle.”
RealClimate: “Clearly it is not possible to alter the concentration of greenhouse gases [CO2] in a controlled experiment at sea to study the response of the skin-layer. Instead we use the natural variations in clouds to modulate the incident infrared radiation at the sea surface.”
RealClimate: “Of course the range of net infrared forcing caused by changing cloud conditions (~100W/m2) is much greater than that caused by increasing levels of greenhouse gases (e.g. doubling pre-industrial CO2 levels will increase the net forcing by ~4W/m2“
In the experiment using clouds, which have a “much greater” longwave (greenhouse) effect on the micrometer skin layer temperature than does CO2 (cloud shortwave forcing completely dominates over longwave), the forcing amounted to a abysmal 0.002ºK (W/m2)-1 for the skin layer. And, according to your beliefs, this forcing contained in the hair-thin skin layer is capable of warming the depths of the ocean, where 93% of the heat from global warming is contained.
Again, no scientific experiment has ever been conducted that shows CO2 heats water. Instead, it is assumed that CO2 functions just like clouds do — even though clouds provide both shortwave and longwave forcing at 10 times the magnitude of what is assumed for CO2, and CO2 is only a LW forcing agent, not shortwave. It’s like using a refrigerator as a proxy for an apple. So the most commonly cited blogs in the world you believe in –and the best “evidence” you have — both acknowledge that no “real world” experiment has ever shown that CO2 heats water. It’s only assumed to be true. And assumptions aren’t science.
As is her practice, Judith Curry allows bloggers to propose a model whereby CO2 might heat the ocean. Again, this is a model. No real-world experiment was actually conducted. And this model is based entirely on assumptions on heat flux that are so uncertain and error ridden that, as even the IPCC acknowledges, the uncertainty and error ranges are 10 times greater than the assumed forcing from CO2 itself!
“Models were developed in the 1970s and 1980s to estimate the magnitude of this effect. In my paper, I develop a simple model based on these earlier studies to estimate the rate of heat gain by the oceans due to an increase in back IR radiation. This model is based on taking an energy balance around the ocean surface. Unfortunately, it is difficult to estimate the rate of heat gain by the oceans for any given level of increased back radiation, because (i) the calculation is extremely sensitive to how the air above the ocean reacts as the ocean warms, and (ii) it is very difficult to estimate how the air above the ocean reacts to a warming ocean.”
Finally, Dr. Spencer, who has published papers that propose the effects of doubling CO2 concentrations to 600 ppm may amount to a climate sensitivity of just 0.7 C, echoing the same ECS temperature value as Dr. Lindzen, writes this from the link you provided to his blog:
“It might well be that solar radiation is more efficient (on a Watt per Watt basis) than IR radiation at changing ocean temperature. In other words, that IR warming of a water body is more likely to be lost through evaporation, since its warming effect does occur only at the surface, and so that energy is more likely to be lost through evaporation than absorbed solar radiation would be.”
I’m beginning to wonder if you have ever even considered this aspect of your belief system before, namely, where and how it has ever been determined that CO2 heats water in the real world. It appears as though you are just now scrambling to find support for this belief of yours, as you’ve had to admit that all you have is blogscience that doesn’t even reference controlled scientific experiments, only models and proxies.
Why are you so convinced of the rightness of your beliefs, mikeR, when you’re not even capable of referencing observational (non-modeled) scientific evidence to support your contentions that CO2 is capable of dominating as the oceans’ net heat source?
So you’re asking me to “rule out” an assumption you have that heat from CO2 heats up water bodies — an assumption that hasn’t ever been observed in a controlled scientific experiment? I think you have it backwards, mikeR. The onus of proof isn’t on me to “rule out” your untested hypotheticals.
https://notrickszone.com/2016/12/01/new-paper-human-climate-forcing-below-detection-deep-oceans-warm-by-2c-within-200-years-100-naturally/
https://notrickszone.com/2016/08/18/theres-no-observational-physical-evidence-that-co2-heats-water/