About two weeks ago, NOAA released the annual version of their latest Arctic Report Card. Of course, the usual media outlets peddled the requisite doomsday headlines when describing the report’s contents, deploying words like grim and dire and pedantically issuing a failing grade so as to paint a picture of an Arctic climate teetering on the brink of catastrophe.
It was on page 33 that the authors divulged the Greenland Ice Sheet’s mass balance statistics for 2015-’16.
2016 Arctic Report Card “Between April 2015 and April 2016 (the most recent period of available data) there was a net ice melt loss of 191 Gt. This is about the same as the April 2014-April 2015 mass loss (190 Gt).”
So the ice sheet reportedly lost 191 gigatonnes (Gt) of water between April 2015 and April 2016. Interestingly, last year’s report card (2015) had the April 2014 to April 2015 loss pegged at -186 Gt, not -190 Gt. Somehow another 4 Gt were added to the total loss for 2014-’15 between then and now.
2015 Arctic Report Card “Ice mass loss of 186 Gt over the entire ice sheet between April 2014 and April 2015 was 22% below the average mass loss of 238 Gt for the 2002- 2015 period.”
For 2013-’14, the mass loss for the Greenland Ice Sheet was even lower: just -6 Gt. In other words, the ice sheet was essentially in balance.
2014 Arctic Report Card “A negligible ice mass loss of 6 Gt between June 2013 and June 2014″
To review, that’s -6 Gt, -186 Gt, and -191 Gt for the 2013 to 2016 mass balance records. Averaged together, the loss was –128 Gt per year for 2013-’16, which is a substantially slower rate of loss relative to previous years.
A Rapid Deceleration In Greenland Ice Sheet Mass Loss Since 2012
Now here’s where it gets interesting. For their 2013 report card, NOAA authors wanted to accentuate just how profound the loss of ice mass had been for the 2008-2012 period compared with the 2002-2006 period. This way, they could point to a rapid acceleration of ice sheet mass loss.
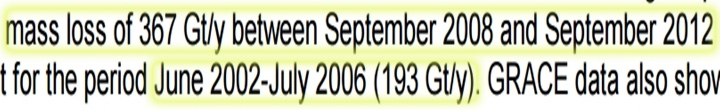
2013 Arctic Report Card “The rate of mass loss has accelerated during the period of observation, the mass loss of 367 Gt/y between September 2008 and September 2012 being almost twice that for the period June 2002-July 2006 (193 Gt/y)“
As some may have noticed, NOAA curiously uses different starting and ending months for each demarcated period, making direct data comparisons difficult (due to different gain/melt rates depending on the month). Instead of comparing September to September every year (as they did in 2008-’12), they’ve compared April to April in some years, June to June in another year, and June to July in still another 4-year-long selection. And they’ve ignored the melt record for 2007 altogether in the above analysis when comparing 2002-2006 to 2008-2012. NOAA wouldn’t dare “move the goal posts” by cherry-picking different start and end points depending on the melt rates for specific months so as to bolster their claims of “acceleration” would they? That would imply operating with a tendentious agenda rather than objectively reporting the data. Would they do that?
But instead of digressing to discuss their odd “selectivity” with regard to choosing some months or years to start and end with instead of others, we will just accept NOAA’s methodology and analyze the yearly averages as originally reported.
So according to present and historical NOAA Arctic Report Cards we have the following rates of annual Greenland Ice Sheet mass loss for 2002-2016:
–193 Gt/yr for 2002-2006
-367 Gt/yr for 2008-2012
-128 Gt/yr for 2013-2016
We can even go a step further and add the 1990s to the record. Despite of a highly increasing rate of human CO2 emissions for the 1992-2002 period, NASA’s Zwally et al. (2005) reported an average net gain of +11 Gt/yr for the Greenland Ice Sheet during those 10 years.
Zwally et al., 2005 “Changes in ice mass are estimated from elevation changes derived from 10.5 years (Greenland) [1992-2002] … of satellite radar altimetry data from the European Remote-sensingSatellites ERS-1 and -2. The Greenland ice sheet is thinning at the margins (–42 ± 2 Gt/yr–1 below the equilibrium-line altitude (ELA)) and growing inland (+53 ± 2 Gt/yr–1 above the ELA) with a small overall mass gain (+11 ± 3 Gt/yr–1; –0.03 mm a–1SLE (sea-levelequivalent)).”
So, adding the 1992-2002 NASA values to the 2002-2016 NOAA values, here is what the overall trend in Greenland Ice Sheet Mass Balance looks like during 1992-2016 using these as-reported mass balance values:
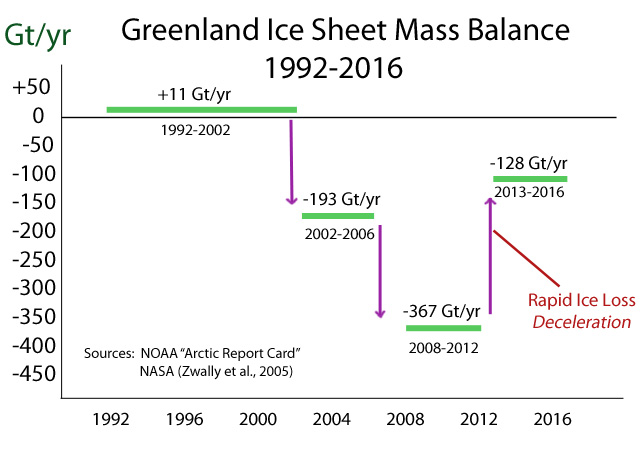
Notice the dramatic rate of deceleration (by two-thirds) in Greenland Ice Sheet mass loss averages for recent years on the graph above, contradicting the reports of a perpetually increasing ice loss acceleration.
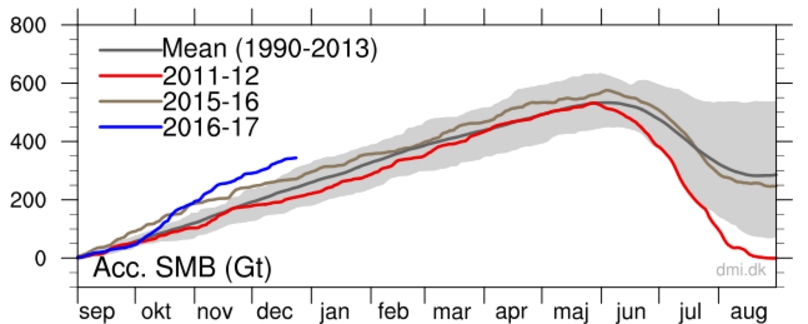
And the slowing mass loss rate has continued in 2016-’17. According to DMI monitoring, the Greenland Ice Sheet is gaining ice substantially above the long-term average in the last 3-4 months. It is highly likely that by the end of the record, the 2016-’17 mass loss will be significantly less than 200 Gt/yr, and perhaps less than 100 Gt/yr again.
The Context Of The Insignificant 1992-2016 Greenland Ice Sheet Mass Change
Some may counter the above analysis by claiming that even losing 100 to 200 Gt of ice per year is still quite substantial and concerning, and thus the alarmist headlines are merited. But this perspective ignores history.
First, estimates of surface mass balance for the Greenland Ice Sheet almost invariably use the 1961-1990 period as a baseline, as it is assumed that the ice sheet was essentially in balance (no net losses or gains) for those 30 years. As records have shown, though, the 1961-1990 baseline period was the coldest decadal-scale stretch since the 1800s for Greenland, which means that the 1995-to-present Arctic warming trend is being directly compared to a very cold period for the Greenland ice sheet rather than a more representative period. In fact, as indicated by several recent papers, the Greenland ice sheet’s surface mass balance was similar to or even lower during the as-warm-as-now 1920s to 1940s than it has been during the last few decades. If the baseline period were to include Greenland’s early 20th century warm years (1920s to 1940s), the recent losses would likely be substantially smaller.
Also, let’s consider what losing, say, 150 Gt per year actually means in terms of its environmental impact. According to Shepherd et al. (2012), the Greenland Ice Sheet lost an average of -142 Gt/yr (with substantial uncertainty of ±49 Gt/yr) during the years 1992-2011. This translates into an average of 0.4 mm/yr of sea level rise contribution from the Greenland Ice Sheet during this high-melt period. In other words, over the entire 20-year record (1992-2011), the Greenland Ice Sheet contributed to sea level rise at a rate of 4 centimeters (1½ inches) per century. That’s it. That’s what a loss of -142 Gt per year multiplied by 20 years translates into.
Even if this alleged modern rate of loss were doubled to -300 Gt/yr, we are still only talking about 3 or 4 inches of sea level rise contribution from the Greenland Ice Sheet every century if that rate of loss could be sustained for 100 years. As indicated above, that rate of loss couldn’t even be sustained for more than a few years in the last few decades.
Finally, as mentioned above, scientists presume the Greenland Ice Sheet was in balance during the 1961-1990 period, which is why it is used as the baseline reference period for surface mass balance estimates. If that’s the case, there is no reason why estimates of the human impact on the Greenland Ice Sheet’s mass balance should not extend back to 1961 too. Or even 1951. After all, the IPCC has indicated in their latest (2014) synthesis report that the overwhelming (“more than half”) anthropogenic influence on climate commenced that particular year:
“It is extremely likely more than half of the observed increase in global average surface temperature from 1951 to 2010 was caused by the anthropogenic increase in greenhouse gas concentrations and other anthropogenic forcings together.”
So if we were to include the ~40 years of majority anthropogenic influence between 1951 and 1991 that apparently saw no net change in Greenland Ice Sheet mass balance with a (rounded up) combined mass loss rate of -150 Gt/yr between 1992 and 2016, the total human impact on the mass balance of the Greenland Ice Sheet might amount to an annual loss average of -55 to -60 Gt for the entire 65-year period. That’s a rate of contribution to sea level rise of about 1 ½ centimeters per century since 1951, or since humans allegedly began causing the majority of global warming.
Since a headline that reads “Humans Have Caused Greenland’s Ice To Melt At Rate That Adds 1 ½ Centimeters Per Century To Sea Levels!” probably wouldn’t be effective in grabbing readers’ attention, it’s understandable why journalists and advocates for the cause would prefer to use doomsday language instead. It’s also understandable why they’d prefer to gloss over the recent deceleration in Greenland Ice Sheet mass loss found in the latest Arctic Report Card. It sounds so much scarier to write about the hundreds of billions of tons of ice lost instead.


Kenneth, what are your calculations of the Total Greenland Ice Mass? (in tonnes , scientific notation)
I have a number, but I keep finding different estimates of the total volume, and of ice density. Seems the density may vary a bit with depth. (0.92 – 0.96 tonnes/m³)
My point being that if you graph the Total Greenland Ice Mass with a zero vertical axis, you end up with a dead flat, horizontal line.
These losses and gains are microscopic compared to the total mass.
The Ron Clutz analysis below is excellent.
https://rclutz.wordpress.com/2015/10/29/greenland-is-melting-really/
Doing the numbers: Greenland area 2.1 10^6 km2 80% ice cover, 1500 m thick in average- That is 2.5 Million Gton. Simplified to 1 km3 = 1 Gton
200 Gton is 0.008 % of that mass.
Annual snowfall: From the Lost Squadron, we know at that particular spot, the ice increase since 1942 – 1990 was 1.5 m/year ( Planes were found 75 m below surface)
Assume that yearly precipitation is 100 mm / year over the entire surface.
That is 168000 Gton. Yes, Greenland is Big!
Inflow = 168,000Gton. Outflow is 168,200 Gton.
So if that 200 Gton rate continued, an assumption not warranted by observations below, that ice loss would result in a 1% loss of Greenland ice in 800 years.
That’s good, I got 2.4 x 10^15 tonnes using a density of 0.95. So pretty darn close 🙂
That means that the graph of the total Greenland Ice Mass since 1900 looks like this.
https://s19.postimg.org/9iwxep7jn/Greenland_Ice_Mass.png
oops, just checked my spreadsheet.
I used density of 0.92 (as found in texts), not 0.95
What a poor post.
Using only a few years data, even that showing substantial loss, to claim melting rate is slowing. You may have had some case if the ice had been growing, even then the period is too short to be taken seriously.
Then to say the melting only raises sea level by 4mm/century. Guys, we are only talking about Greenland here. Add the contribution from everywhere else for a global view.
Seriously, this sort of story is bad for your argument.
Yet, the often repeated claim that Greenland is melting rapidly is refuted.
So to be consistent, do you also believe the 4-year periods used by NOAA (2002-2006, 2008-2012) aren’t long enough to establish a trend of acceleration?
If you noticed in the body of the post, the record identified here includes a 65-year period (1951-2016) of presumed anthropogenic influence on the Greenland Ice Sheet that combined amounts to about -55 Gt/yr on average even when using the highest estimates (and most cited) available (Shepherd et al., 2012). That’s about 4 cm per century of sea level rise contribution from the Greenland Ice Sheet. Do you find that “substantial”?
OK. If we do that, we get a rate of about 1 mm/yr of sea level rise contribution from Greenland, Antarctica, and all the world’s glaciers combined in the last decade or two even if we use the highest estimates available (i.e., we don’t use Zwally et al., 2015, which found Antarctica gaining mass overall and subtracting -0.23 mm/yr from sea levels). One millimeter per year for recent decades is a rate of about 3 or 4 inches per century. Again, do you find that substantial?
Shepherd et al., 2012 http://science.sciencemag.org/content/338/6111/1183
“Since 1992, the polar ice sheets [Antarctica and Greenland] have contributed, on average, 0.59 ± 0.20 millimeter year−1 to the rate of global sea-level rise.”
Jacob et al., 2012 http://www.nature.com/nature/journal/v482/n7386/abs/nature10847.html
“Here we show that GICs [global glaciers and ice caps], excluding the Greenland and Antarctic peripheral GICs, lost mass at a rate of 148 ± 30 Gt yr−1 from January 2003 to December 2010, contributing 0.41 ± 0.08 mm yr−1 to sea level rise.”
Graeme,
Here is the graph of the Greenland Ice mass since 1900
https://s19.postimg.org/9iwxep7jn/Greenland_Ice_Mass.png
And here is the graph of the Antarctic Ice mass since 1900
https://s19.postimg.org/nqmm3ck8j/Antarctic_Ice_Mass.png
Notice anything ?
Do these graphs include the net gain in ice mass between 1940 and 1990, when the Greenland Ice Sheet cooled by 1.5 to 2.0 C relative to the 1930s?
https://notrickszone.com/wp-content/uploads/2016/12/Holocene-Cooling-Greenland-Ice-Sheet-Surface-Mass-Balance-Fettweis-08.jpg
Because if they don’t, the original and thus only “loss” occurred in the 1930s, and recent decades are just an oscillatory regression to the 1930s values. Succinctly, the net SMB loss occurred in the 1930s, and it’s been a stable oscillation ever since.
http://www.the-cryosphere.net/2/117/2008/tc-2-117-2008.pdf
“The absolute minimum [surface mass balance] occurred around 1930 with a SMB anomaly near −300 km3 yr−1 . Secondary (minor) SMB minima appear to have occurred in 1950 and 1960, equalling the surface mass loss rates of the last few years (1998, 2003, 2006). … After the 1990s, the GrIS SMB decreases slowly to reach the negative anomalies of the last few years, although the summers of the 2000s were not exceptional compared to 70 yr ago”
Kenneth, the relative changes are so tiny that they will not show up at all on a graph using a “scale from zero” total mass axis.
That is the whole point.
As nature changes most things in logarithmic rates of progression, maybe all natural processes including weather and climate data, would be better shown on a zeroed, log/log scale.
Where it may show the real natural impact on the living dynamic system, including us humans.
Unrealistic to put time on a log scale.
And you can’t have a zeroed log scale, anyway. 🙂
AndyG55 27. December 2016 at 7:14 AM,
Can not see your problem.
Graphing is just a ratio-metric display method, with scaling at an arbitrary length to display relevant information.
Rejigging graphs for log scale (rescaling a log graduations) should not be a problem, electronic engineering does it all the time. E.g. Rescaling arbitrary linear amplitude values to log, or dB scales (also a log value wrt a stated standard). All that is needed is to state what the zero value id defined as.
And with time — any current (and stated) ‘now’ is zero, and time is log-scaled of the before now (as is often used in graphs from archeology).
If this can not be seen just use deci-Bel (dB) scale for everything on normal (linear) graph! You just state your standard (zero dB=10meters snow (say)).
tom0.. a log graph can never start at zero.
unless you use the index, to some base.
10^0 = 1 but there is number, N, (except 0) such that N^anything = 0
“but there is NO number, N…..”
You are of course more than welcome to create the graph that you envision. 🙂
Maybe we have a communication issue.. A picture can tell… etc 🙂
“Guys, we are only talking about Greenland here”
But the Antarctic is actually increasing mass by a small amount.
Its contribution to sea level is negative.
And Glaciers.. remember that they are finding tree stumps and human artefacts under naturally receding glaciers.
We are actually still in a cold period of the current interglacial, and the sooner people wake up to this fact the sooner this AGW clap-trap can be brought to an end.
Would you be able to tell me what 128GT of ice represents as a percentage of the total Greenland ice sheet. I have always wondered, since nobody ever states it, I fear the wool is being pulled over my eyes.
Many thanks in advance.
See above.. a tiny percentage
I get about 0.005% (give or take a 4th decimal value)
The ice sheet is reported to be 1.71m KM in area and to average over 1km in thickness. As 1 cubic KM contains 1,000,000,000,000 litres and assuming 1l of ice weighs 1kg, then that equates to 1,710,000,000,000,000,000kg which I think is 1.71m GT.
So if my maths is right, a loss of 200gt pa is just 0.02% of its mass.
Happy to be corrected if I got lost with all those 0s!
See Ron’s calc above..
I get 2.4 X 10^15 tonnes using a density of 0.95
density 0.92 used, not 0.95
Oh, and 200Gt is 0.0083% of 2.4 x 10^15 tonnes,
I don’t believe a word, a number, a statistical analysis – NOAA publishes, ever utters about annual Ice loss concerning the Greenland ice sheet is guesstimation direct from the fiction factory. A land mass the size of Greenland is accreting ice at any time, where some areas are also melting
Furthermore, second guessing these sorts of made up ‘modelled’ figures only bestows a quite unearned veneer of quasi legitimacy on an organization which, should no longer exist.
If one reads into remote sensing altimetry and GRACE: gravity recovery and climate experiment techniques the science is to say the least doubtful and bear in mind the BAS and NASA have vested interests in pursuing their own agendas – if you know what I mean.
“filtering methods are not optimal” I’ll translate – “the techniques are a crock”.
All of this is based on two very old canards. ie the Western Antarctic ice sheet and the ‘melting’ Greenland glaciers – and this is pure conjecture that blaming ‘melt’ on man induced warming is specious bollocks, as is remote sensing altimetry.
Here is some context on Greenland ice sheet and reasons not to fear it melting.
https://rclutz.wordpress.com/2015/10/29/greenland-is-melting-really/
See my two graphs above for a dose of perspective. 🙂
(actually, may have to wait.. they are under moderation.. why? who knows!)
@Hivemind,
When discussing continental ice the Media and Alarmists are careful to avoid putting the rate of melting in context.
The Ron Clutz link above provides context which should convince any reasonable person that the melting is nothing to be concerned about. It has been going on for 15,000 years and it is slowing down given that most of the continental ice melted millennia ago.
In the IPCC’s AR5 report their best estimate for the rate of loss was ~300 Giga-tonnes per year. That sounds pretty scary unless you understand the context which is the “Total Ice Inventory”. Right now the inventory is 30,000,000 Giga-tonnes which means it would take another 10,000 years to melt all the ice.
“Right now the inventory is 30,000,000 Giga-tonnes”
That’s for Antarctica. Greenland is about 2.5 million Gt.
ps… If you check your maths you will find that 30,000,000 divided by 300 is 100,000.
But yes, Greenland would take around 10,000 years if melting continued.. which it won’t once we drop into the next ice age.
@AndyG55,
Thanks for pointing out the schoolboy howler. When quoting numbers from memory I tend to drop a decimal point or two. This time my memory was good but my arithmetic was not.
The global ice inventory is ~30,000,000 Giga-tonnes at least according to UNEP:
http://www.grid.unep.ch/glaciers/pdfs/3.pdf
The IPCC AR5 figure of 300 Giga-tonnes per year melt rate was “Global” so I agree with you when you say it will take 100,000 years to melt that much ice at the present rate.
You can bet that the next glaciation will kick in within less than 5,000 years so we won’t need to worry about an “Ice Free Earth”.
Why would anyone want an iced-over island or continent anyway?
Seriously what would be the problem in water rising by 76 meters if all of Antarctica melted. Yeah, coastal city dwellers would have to move. Cry me a river. I thought progressives were for change? Look how conservative they suddenly become when it’s about their beloved shitholes like NYC.
“Seriously what would be the problem in water rising by 76 meters if all of Antarctica melted. Yeah, coastal city dwellers would have to move. Cry me a river. ”
I can explain this easily. Today, the difference is insurance.
you see sea level rise by even a little and another strong storm and suddenly those towns will not get any flood insurance any longer. In most countries old contracts remain, but change of ownership becomes very difficult. That is a problem, because those houses are mostly investments also.
You also can nor relocate these people, because their houses have a huge value, including a future premium added (which of course does not factor in damage or loss to a massive storm).
So the road is opened eyes, directly< into catastrophe.
But it isn’t happening and it isn’t going to happen.
So Di Paprio and his ilk will be safe in their multi million dollar houses and resorts barely 6″ above sea level
They obviously are not concerned with the tiny, almost imperceptible and immeasurable rate of sea level rise.
“But it isn’t happening and it isn’t going to happen.”
Dirk invented a “what if” scenario. And that is, what i replied to. (it is a little strange that he can not figure out why a 76 m sea level change would be a problem…)
What you do is one of “sceptics” classic techniques:
A problem turns up (sea level). people deny that it is any problem at all (even 76 m sea level rise would not be a problem). people demonstrate, that it would be a big problem. You change defence to “it will not happen anyway”.
So for once please stick to the topic: you simply have to demonstrate that 76 m of sea level rise would not be a problem. Have fun!
sod, you have it all wrong. Of course 76 meters of sea level rise would be a problem over the next couple hundred years, but not over thousands of years. Indeed there are no signs of man-made polar melting whatsoever. Just because Greenland is fluctuating a couple of tenths of a percent, it is very well within natural variability limits, and so is the Arctic sea ice cover when examined over the past 100 years, or when it is compared to the cover seen during the MWP, or other warm periods throughout the Holocene. Unfortunately you have become a victim of hysteria spread by some nutty irresponsible alarmists — who are hopefully about to get the boot once Trump takes office. It’s time to focus on real problems.
And besides, Pierre, it’s not happening anyway. 🙂
http://joannenova.com.au/2012/12/are-sea-levels-rising-nils-axel-morner-documents-a-decided-lack-of-rising-seas/
OMG but you are an idiot, sop.
Have a look up the top, the topic is the tiny fluctuations in the Greenland ice sheet.
We all know that the AGW scammers have to invent and play with impossible hypotheticals that are never going to happen.
Its all the AGW scam has ever been about.
And some child-minded idiots have fallen straight into the scam.. haven’t you sop.
“It’s time to focus on real problems.”
For sop, that would entail regular visits to a psychiatrist..
His anxiety symptoms seem to be deep and irreversible.
I don’t know, Andy, it looks pretty serious to me.
http://scienceandpublicpolicy.org/images/stories/papers/reprint/sea_level_not_rising.pdf
Have you ever seen so little so not happening so fast?!
See also here
http://farm4.static.flickr.com/3206/3144596227_545227fbae_b.jpg
No wonder sod’s neuron is overloaded.
Of course when climate leader DiCaprio voluntarily ‘relocates’, then we can all take the 97% climate doomsday seriously.
http://www.businessinsider.com.au/leonardo-dicaprio-eco-resort-belize-2016-11?r=US&IR=T
hey sop.. is that you going ape on Roy’s site.. or is it some other sop??
There is a sop there pretending to be a climate scientist with an oil company . roflmao… !!!
Pretending he “knows” stuff.. and ranting like an 8 yr old having a tanty.
And he is just as ignorant and arrogant as our sop.
@sod,
If melting continues at the present rate it will take 100,000 years to melt all the continental ice. That corresponds to 80 mm of sea level rise per century. Your insurance company argument is absurd.
My guess is that sea level will start falling in less than 5,000 years……it will be a real problem when the Laurentide glacier buries New York under 1,000 meter of ice. How will insurance companies cope with that?
https://en.wikipedia.org/wiki/Laurentide_Ice_Sheet
gallopingcamel wrote:
“If melting continues at the present rate it will take 100,000 years to melt all the continental ice.”
Warming is already accelerating, as is sea level rise.
(Just fit both to a quadratic equation — if you know the necessary math), and calculate 2*(the leading coefficient on the time-squared variable).
That’s the acceleration.
“Warming is already accelerating, as is sea level rise.”
LYING AGAIN, hey rotten-Appell.
There has ben no acceleration in sea level rise, and there has been no warming in the whole satellite temperature era apart from El Nino events, which are actually ocean cooling events.
I remember very well, when Al Gore was preposterously scaremongering, spieling about some >6-7 meter SL rise in NYC and at about the same time he was investing some of his ill gotten $ millions in Beach front property in and around Miami or somewhere on coastal des res in the ‘Sunshine State’ aka FL.
Curious…in Australia 3 of the most prominent believers, ex-Prime Ministers Rudd and Gillard, and ‘Tim the fool’ Flannery all bought waterfront properties. (in Gillard’s case I should make it plain that it was at least 25 metres from the beach).
Gore, DiCaprio, Suzuki? Any more come to mind?
In the past, sea level has risen 10-20 m for each deg C of warming. It takes millennia, but for each degree (we have one C so far, and can’t avoid 2 C) the SLR is large.
source: David Archer’s papers of the ’00s.
So why do you think it is that sea levels were meters higher than now about 5,000 years ago, when CO2 levels were in the 260s ppm?
http://www.notrickszone.com/2016/08/29/30-scientific-papers-reveal-inverse-co2-sea-level-signal-as-co2-rises-sea-level-falls/
The is zero acceleration in sea level rise
You are still living in your anti-science fantasy world, inside an appell pip
Enjoy the next week or two of very cold weather in Oregon, twerp.
And make sure you have that fossil fuel electricity heating up full. Wouldn’t want you to catch a cold now , would we?
Speaking of numbskulls…