The Hockey Stick Collapses (2017)
A collection of 60 peer-reviewed scientific papers published in 2016 were displayed here last month in an article entitled, “The Hockey Stick Collapses: 60 New (2016) Scientific Papers Affirm Today’s Warming Isn’t Global, Unprecedented, Or Remarkable“.
Each paper from the 2016 collection cast doubt on claims of an especially unusual global-scale warming during modern times.
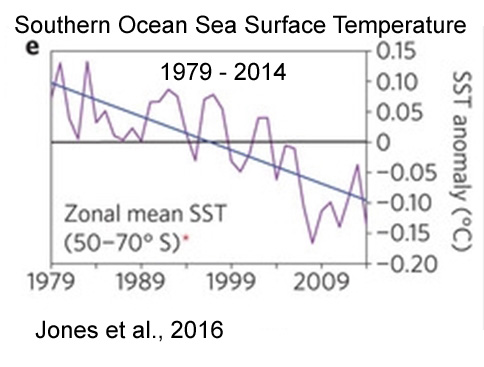
Yes, some regions of the Earth have been warming in recent decades (i.e., the Arctic since the 1990s), or at some point in the last 100 years. Some regions have been cooling for decades at a time (i.e., the Arctic during the 1950s to 1980s, the Southern Ocean since 1979). And many regions have shown no significant net changes or trends in either direction relative to the last few hundred to thousands of years.
In other words, there is nothing historically unprecedented or remarkable about today’s climate when viewed in the context of natural variability.
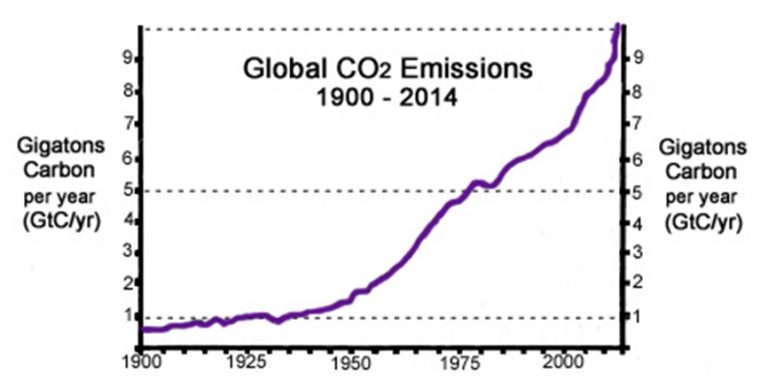
And the scientific evidence continues to accumulate for 2017. In just the first month of this year, there have already been at least 17 papers published in scientific journals once again documenting that modern warming is not global, unprecedented, or remarkable. In fact, several of these papers indicate that we are still living through some of the coldest temperatures of the last 10,000 years (just above Little Ice Age levels), and that a large portion of the amplitude of the modern warming trend (if there is one depicted) was realized prior to the mid-20th century, or before the period when human CO2 emissions began to rise dramatically.
Needless to say, these papers do not support the position that human CO2 emissions are the primary drivers of climate.
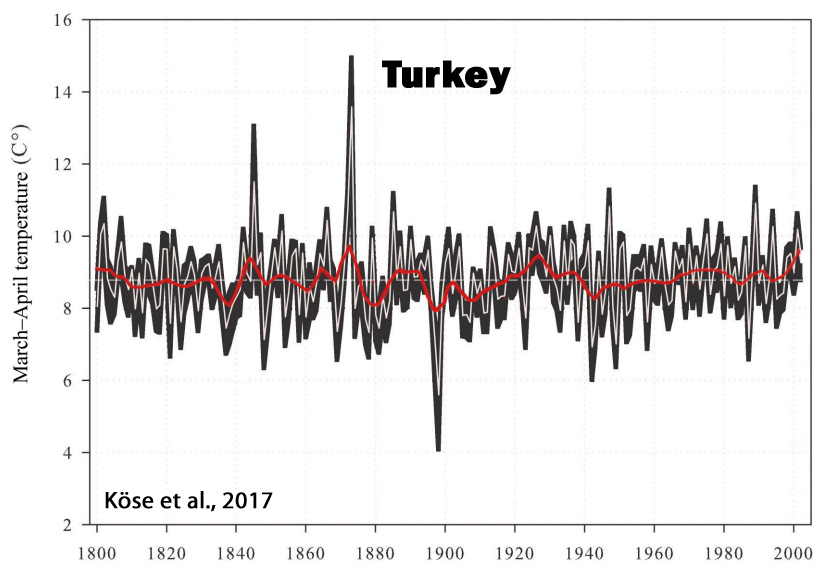
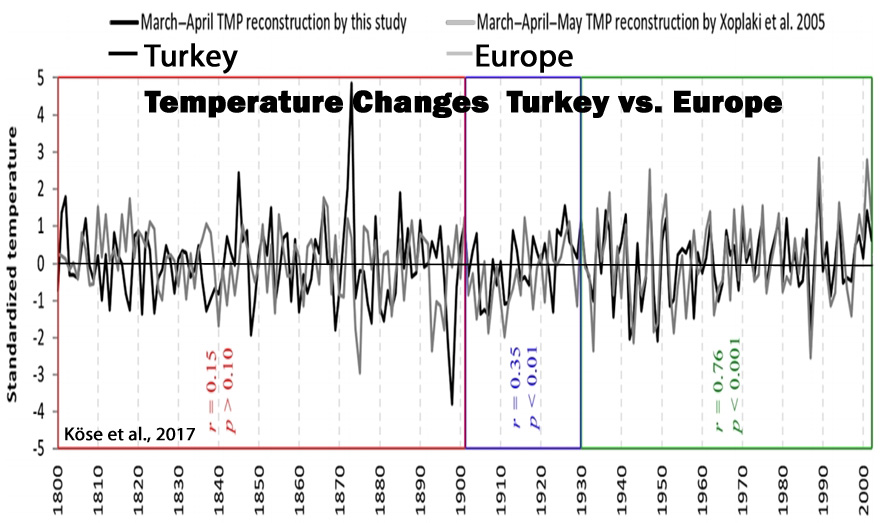
Köse et al., 2017 (Turkey, Europe)
“The reconstruction is punctuated by a temperature increase during the 20th century; yet extreme cold and warm events during the 19th century seem to eclipse conditions during the 20th century. We found significant correlations between our March–April spring temperature reconstruction and existing gridded spring temperature reconstructions for Europe over Turkey and southeastern Europe. … During the last 200 years, our reconstruction suggests that the coldest year was 1898 and the warmest year was 1873. The reconstructed extreme events also coincided with accounts from historical records. … Further, the warming trends seen in our record agrees with data presented by Turkes and Sumer (2004), of which they attributed [20th century warming] to increased urbanization in Turkey. Considering long-term changes in spring temperatures, the 19th century was characterized by more high-frequency fluctuations compared to the 20th century, which was defined by more gradual changes and includes the beginning of decreased DTRs [diurnal temperature ranges] in the region (Turkes and Sumer, 2004).”
Flannery et al., 2017 (Florida, U.S.)
“The early part of the reconstruction (1733–1850) coincides with the end of the Little Ice Age, and exhibits 3 of the 4 coolest decadal excursions in the record. However, the mean SST estimate from that interval during the LIA is not significantly different from the late 20th Century SST mean. The most prominent cooling event in the 20th Century is a decade centered around 1965. This corresponds to a basin-wide cooling in the North Atlantic and cool phase of the AMO.”

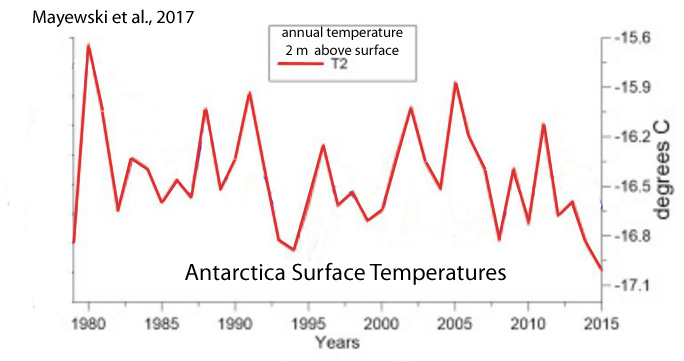
Mayewski et al., 2017 (Antarctic Circle)
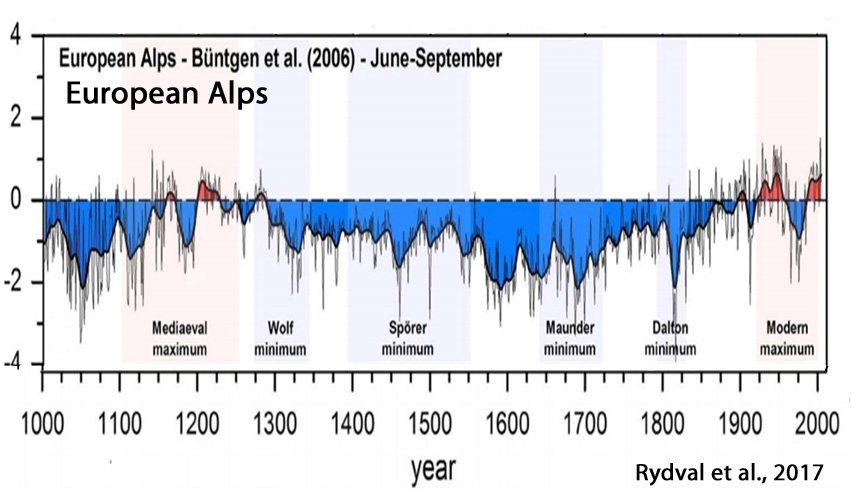
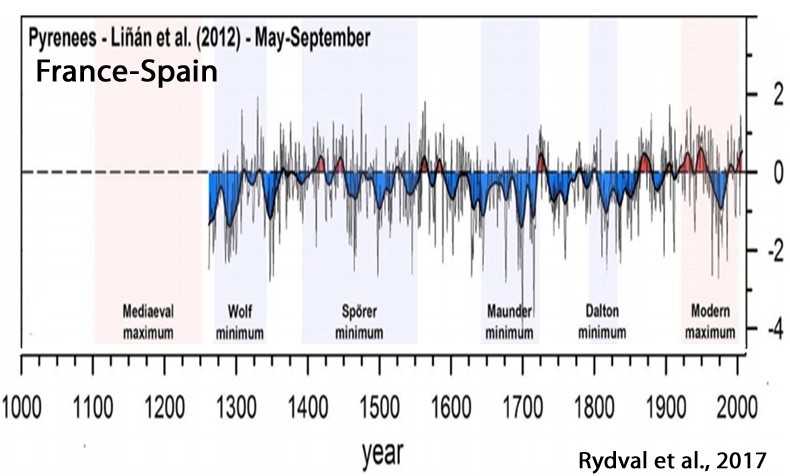
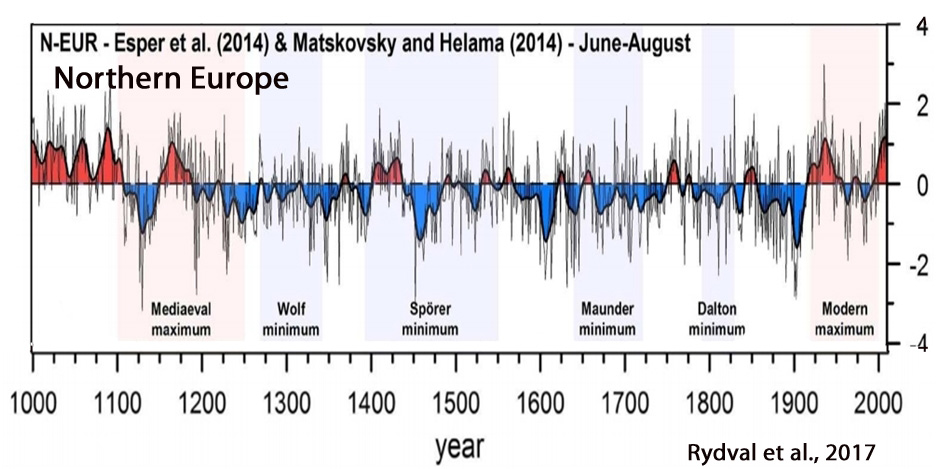
Rydval et al., 2017 (Scotland, Scandinavia, Northern Europe, Alps, France-Spain)
“[T]he recent summer-time warming in Scotland is likely not unique when compared to multi-decadal warm periods observed in the 1300s, 1500s, and 1730s … All six [Northern Hemisphere] records show a warmer interval in the period leading up to the 1950s, although it is less distinct in the CEU reconstruction. [E]xtreme cold (and warm) years observed in NCAIRN appear more related to internal forcing of the summer North Atlantic Oscillation. … There is reasonable agreement in general between the records regarding protracted cold periods which occur during the LIA and specifically around the Maunder solar minimum centred on the second half of the seventeenth century and to some extent also around the latter part of the fifteenth century coinciding with part of the Spörer minimum (Usoskin et al. 2007).”


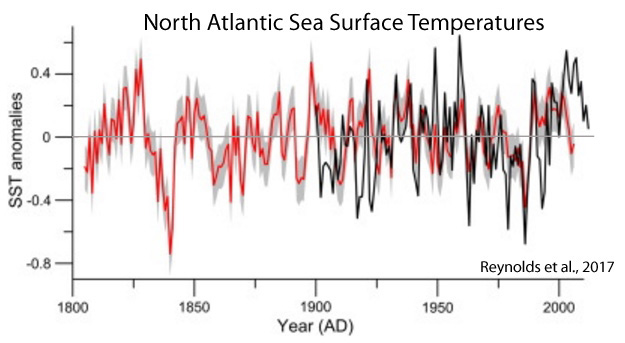
Reynolds et al., 2017 (North Atlantic)
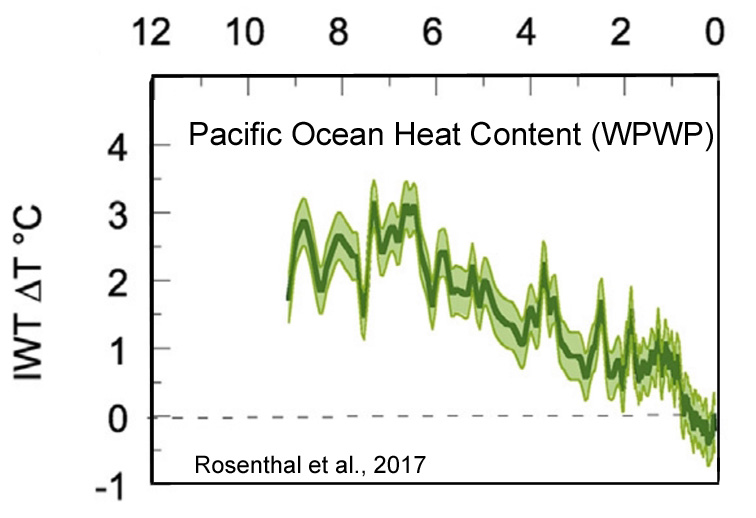
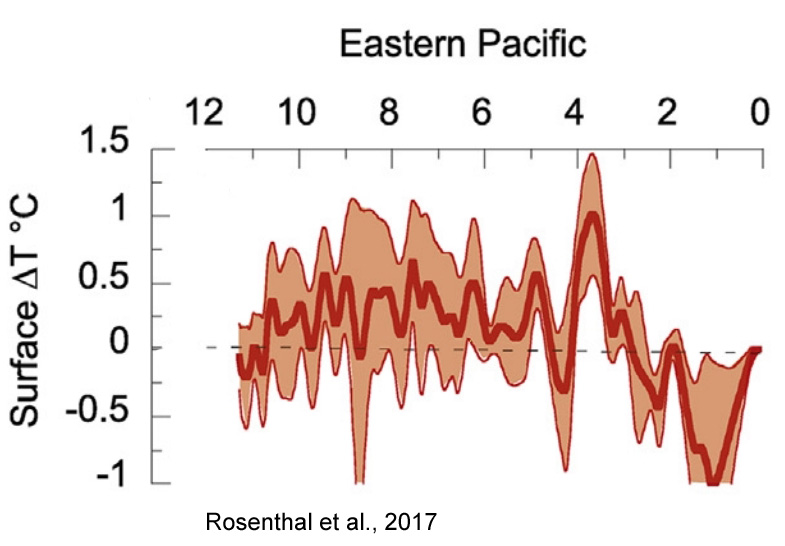
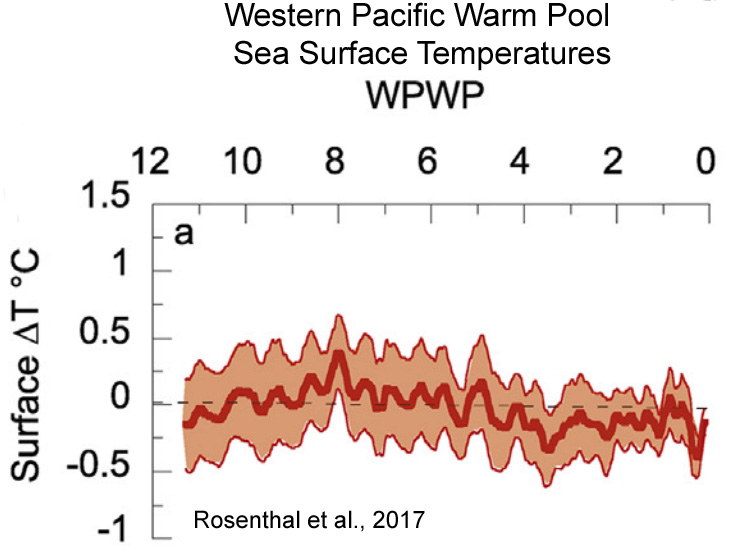
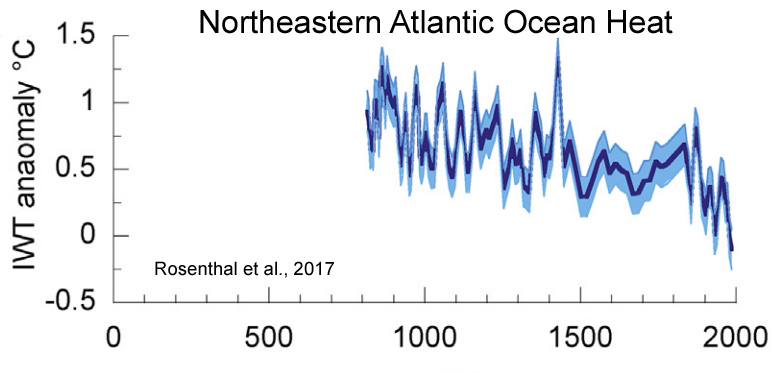
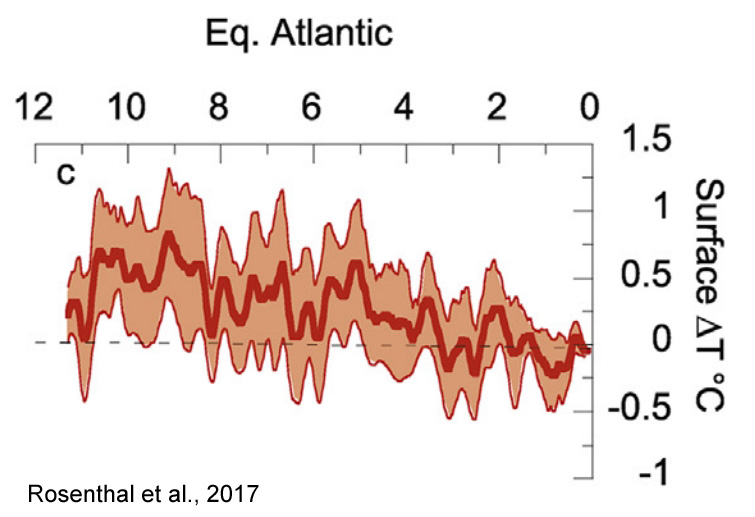
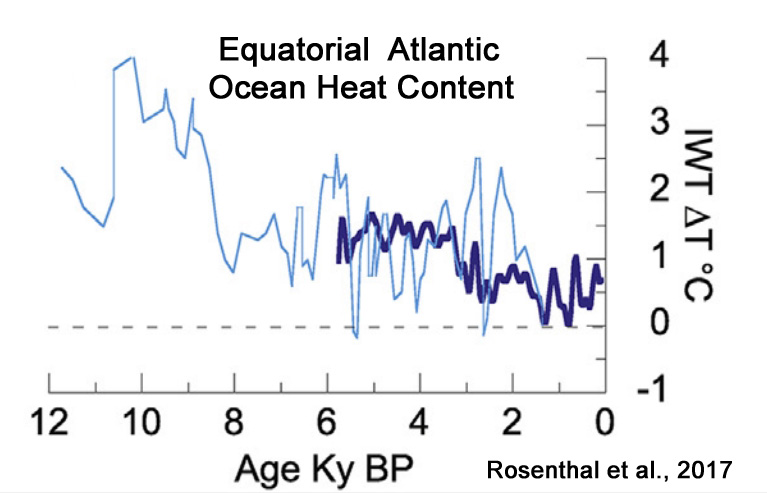
Rosenthal et al., 2017 (Atlantic, Pacific Oceans)
“Here we review proxy records of intermediate water temperatures from sediment cores and corals in the equatorial Pacific and northeastern Atlantic Oceans, spanning 10,000 years beyond the instrumental record. These records suggests that intermediate waters [0-700 m] were 1.5-2°C warmer during the Holocene Thermal Maximum than in the last century. Intermediate water masses cooled by 0.9°C from the Medieval Climate Anomaly to the Little Ice Age. These changes are significantly larger than the temperature anomalies documented in the instrumental record. The implied large perturbations in OHC and Earth’s energy budget are at odds with very small radiative forcing anomalies throughout the Holocene and Common Era. … The records suggest that dynamic processes provide an efficient mechanism to amplify small changes in insolation [surface solar radiation] into relatively large changes in OHC.”
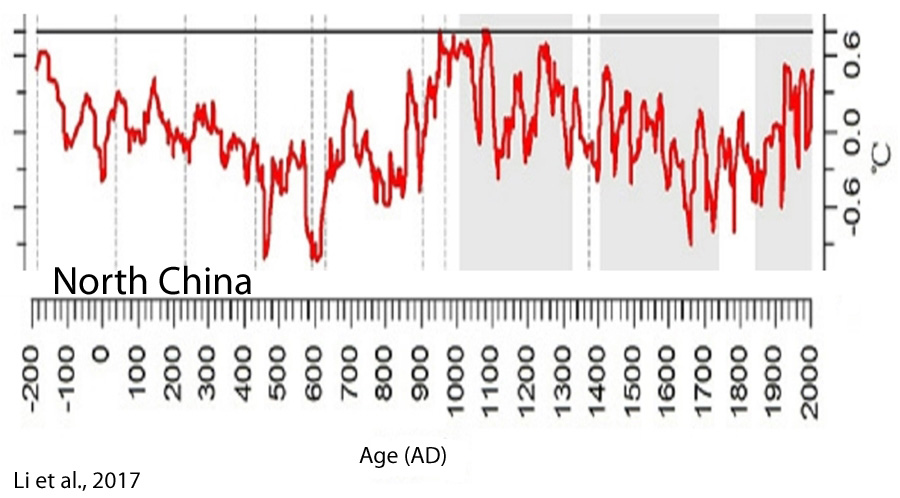
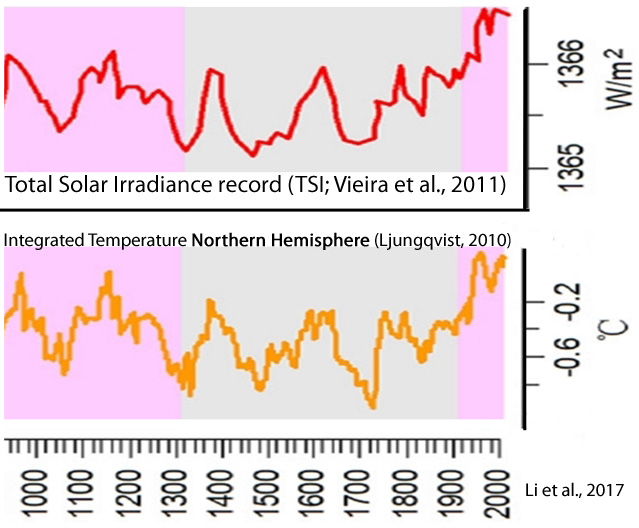
Li et al., 2017 (North China, Northern Hemisphere)
“We suggest that solar activity may play a key role in driving the climatic fluctuations in NC [North China] during the last 22 centuries, with its quasi ∼100, 50, 23, or 22-year periodicity clearly identified in our climatic reconstructions. … It has been widely suggested from both climate modeling and observation data that solar activity plays a key role in driving late Holocene climatic fluctuations by triggering global temperature variability and atmospheric dynamical circulation“
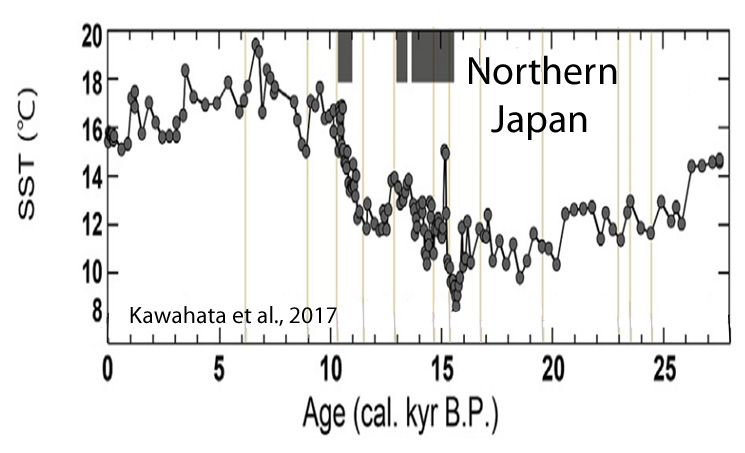
Kawahata et al., 2017 (Northern Japan)
“The SST [sea surface temperature] shows a broad maximum (~17.3 °C) in the mid-Holocene (5-7 cal kyr BP), which corresponds to the Jomon transgression. … The SST maximum continued for only a century and then the SST [sea surface temperatures] dropped by 3.5 °C [15.1 to 11.6 °C] within two centuries. Several peaks fluctuate by 2°C over a few centuries.”
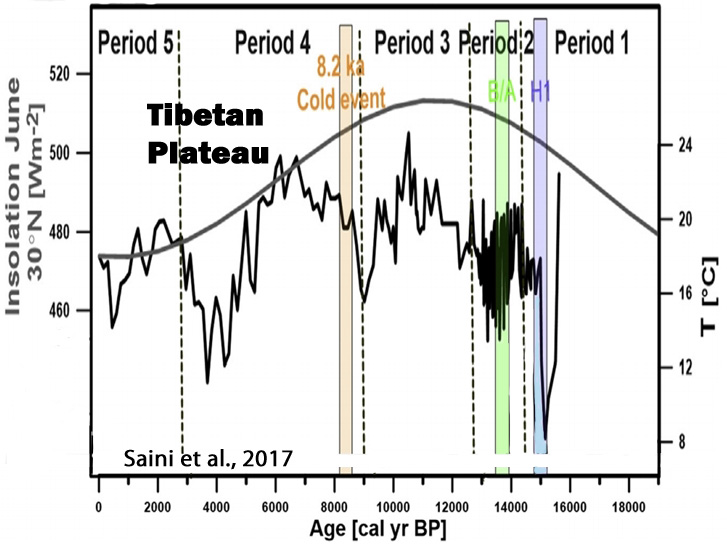
Saini et al., 2017 (Tibetan Plateau)
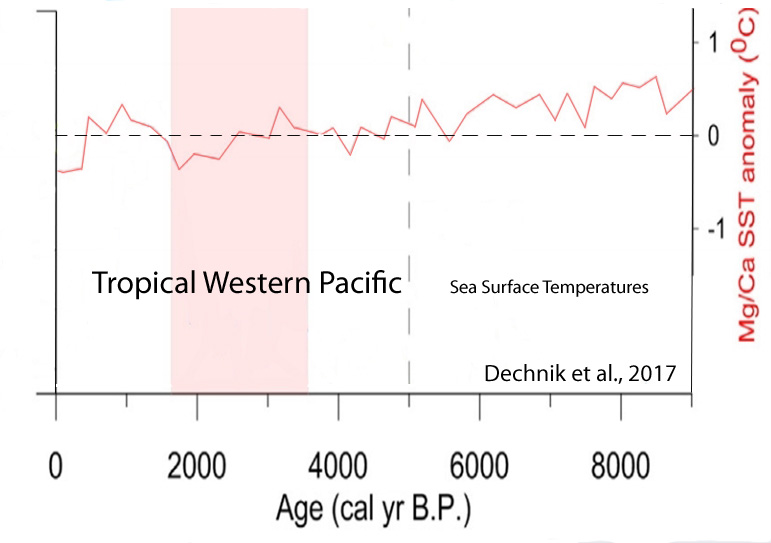
Dechnik et al., 2017 (Tropical Western Pacific)
“[I]t is generally accepted that relative sea level reached a maximum of 1–1.5 m above present mean sea level (pmsl) by ~7 ka [7,000 years ago] (Lewis et al., 2013)”
Wu et al., 2017 (South China Sea)
“The alkenone-based SST reconstruction shows rapid warming in the first 1500 years of the Holocene … an increase of sea surface temperature from c. 23.0 °C to 27.0 °C, associated with a strengthened summer monsoon from c. 10,350 to 8900 cal. years BP. This was also a period of rapid sea-level rise and marine transgression, during which the sea inundated the palaeo-incised channel … In these 1500 years, fluvial discharge was strong and concentrated within the channel, and the high sedimentation rate (11.8 mm/yr [1.18 m per century]) was very close to the rate of sea-level rise.”

Sun et al., 2017 (China, Southwest)
“[A]t least six centennial droughts occurred at about 7300, 6300, 5500, 3400, 2500 and 500 cal yr BP. Our findings are generally consistent with other records from the ISM [Indian Summer Monsoon] region, and suggest that the monsoon intensity is primarily controlled by solar irradiance on a centennial time scale. This external forcing may have been amplified by cooling events in the North Atlantic and by ENSO activity in the eastern tropical Pacific, which shifted the ITCZ further southwards. The inconsistency between local rainfall amount in the southeastern margin of the QTP and ISM intensity may also have been the result of the effect of solar activity on the local hydrological cycle on the periphery of the plateau.”

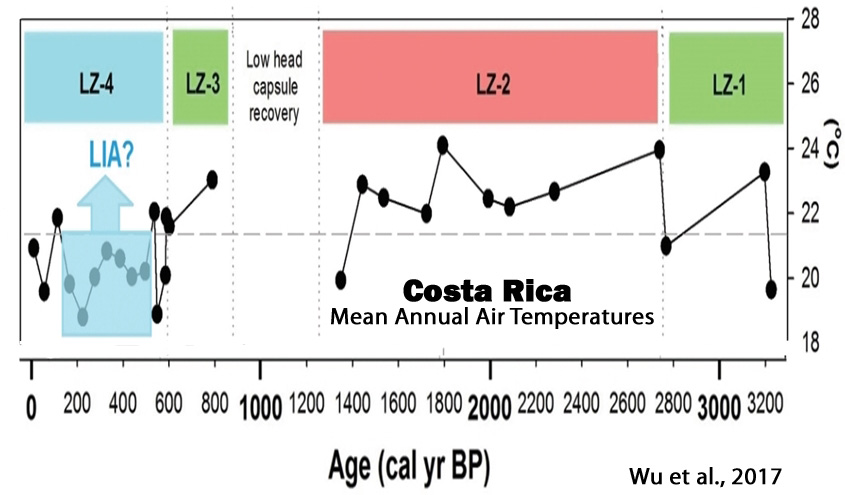
Wu et al., 2017 (Costa Rica)
“The existence of depressed MAAT [mean annual temperatures] (1.3°C lower than the 3200-year average) between 1480 CE and 1860 CE (470–90 cal. yr BP) may reflect the manifestation of the ‘Little Ice Age’ (LIA) in southern Costa Rica. Evidence of low-latitude cooling and drought during the ‘LIA’ has been documented at several sites in the circum-Caribbean and from the tropical Andes, where ice cores suggest marked cooling between 1400 CE and 1900 CE. Lake and marine records recovered from study sites in the southern hemisphere also indicate the occurrence of ‘LIA’ cooling. High atmospheric aerosol concentrations, resulting from several large volcanic eruptions and sea-ice/ocean feedbacks, have been implicated as the drivers responsible for the ‘LIA’.”
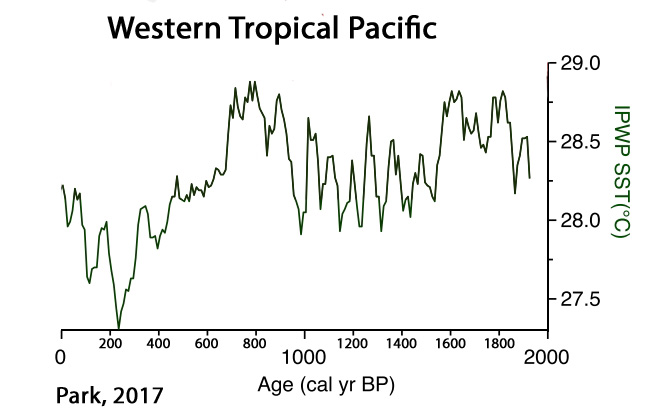
Park, 2017 (Western Tropical Pacific)
“Late Holocene climate change in coastal East Asia was likely driven by ENSO variation. Our tree pollen index of warmness (TPIW) shows important late Holocene cold events associated with low sunspot periods such as Oort, Wolf, Spörer, and Maunder Minimum. Comparisons among standard Z-scores of filtered TPIW, ΔTSI, and other paleoclimate records from central and northeastern China, off the coast of northern Japan, southern Philippines, and Peru all demonstrate significant relationships [between solar activity and climate]. This suggests that solar activity drove Holocene variations in both East Asian Monsoon (EAM) and El Niño Southern Oscillation (ENSO). In particular, the latter seems to have predominantly controlled the coastal climate of East Asia to the extent that the influence of precession was nearly muted during the late Holocene.”


Now have all these authors been flagged and place on the IPCC sh!t list? Is Michael Mann and Gavin Schmidt sending bags of flaming poo to their homes? Enquiring minds want to know.
https://www.youtube.com/watch?v=2r3Xs9sBEVg
Happy to notice that the alarmist cherry-pickers that usually are busy with littering this site with their thread-hijacking activities have learned to stay away from threads like this since it would demand that they reveal their true science-denier nature.
True, Pethefin. On the face of it, difficult to gainsay
I’m hoping that Kenneth will be kind enough to supply links, or at least references, on a consistent basis, that we can follow up, to verify for ourselves that some of these papers are not just KR’s invention. I sometimes wonder if KR is a fifth columnist, trying to set us up, such is the volume and scope of the work he assembles. He must spend all day doing it. If nothing else, it should give defenders of the 97% consensus pause for thought.
Not kidding us, are you, Kenneth?
You forgot to add the sarc off for the less focused readers. I would like to use the opportunity to thank Kenneth for his tireless work referencing the papers and even supplying clickable links to them!
Yes, I hope KR doesn’t take it too seriously. I have followed plenty of these links to satisfy myself that the references are there, and say what is claimed. Too many to do all! Although I have come across some papers which do also contain material which has an opposite lean (or at least the obligatory pro-AGW comments), I’ve not seen anything which is seriously misrepresented.
I’ve often complimented Kenneth on his efforts, which are massive.
My comment was to try to tease out some sensible criticism – but, so far, nothing. Come on, you warmists, why do you just ignore this? I’m listening, but your efforts so far are a poor show.
Yes, it’s true that some of the papers referenced contain throwaway phrases (“recent warming is associated with the increase in greenhouse gases”) that demonstrate an allegiance to the paradigm within the body of the paper itself. It’s generally the case that authors must include those comments so as to get published.
Here’s an example of what I mean…
https://notrickszone.com/2016/12/12/another-new-paper-reveals-no-discernible-human-or-co2-influence-on-global-ocean-temperatures-climate/
Not inclined to disappoint those advocating for the anthropogenic climate change paradigm, the Rosenthal et al. scientists obligingly granted one single appeasing sentence, offering that the“modern rate of Pacific OHC change is, however, the highest in the past 10,000 years.”
The increase in ocean temperatures in recent decades (reported by the IPCC to only be “about 0.015°C per decade” for the 0-700 m layer between 1971-2010) is claimed to be much faster than any other period during the Holocene. “It is virtually certain that the upper ocean (0 to 700 m) warmed from 1971 to 2010. … The warming rate is 0.11°C per decade in the upper 75 m, decreasing to about 0.015°C per decade by 700 m.” (IPCC AR5 WG1 Chapter 3, page 263)
So how did Rosenthal et al. leap to their conclusion? By oddly deciding that it is scientifically defensible to directly compare an 8,000-year-long trend to a 55-year trend (1955-2010) — which, statistically, is much like comparing an 8-month-long El Niño-dominated temperature anomaly to a 37-year-long temperature trend. In other words, Rosenthal and co-authors were able to claim an unprecedented modern warming rate (and thus earn publication in the journal Science) by cherry-picking an extremely short-term period (1950s-present) and by simultaneously ignoring all the other short term (<100 years) trends (from their own reconstructions) that greatly exceeded modern temperature changes in both rapidity and magnitude.
I’ll gladly reply and thank you for mentioning cherry-picking. I’ll now cherry pick from the very same papers that are presented in this arcticle. I hope you can see the irony …
1) Köse et al., 2017
2) Flannery et al., 2017
3) Mayewski et al., 2017
Indeed the Antarctic isn’t warming, but the used picture in this article was photoshopped and originally is used to illustrate that the greenhouse gas ozone influences the temperature (see fig 14 in the paper and it’s description):
4) Rydval et al., 2017
Does confirm warming and reconstructs equally warm periods in previous times. So it is not unprecedented in Scotland according to this paper. They do however emphasis (the reconstruction and that graphs in this arcticle – again unnecessarily photoshopped from fig. 8 of the paper – covers 2000 years):
5) Reynolds et al., 2017
The graphs show a reconstructed time series (red) vs. the detrended actual time series (black). If you don’t know what detrending is just look at the left column of graphs in fig. 10 in the paper. Temperature is increasing in both central england and on the surface of the north-east atlantic. The paper just presents a novel reconstruction method and shows how it performs against the actual measurements.
6) Rosenthal et al., 2017
Paywalled, but ok … ocean heat content was higher in the past. The first figure in the paper clearly shows recent increases and the second sentence of the paper’s abstract reads:
Thank you for the challenges, SebastianH.
–
–
Isn’t that like saying the last 115 years have been warmer than the 75 preceding years, which encompassed the Little Ice Age? Most would agree that it has warmed since the LIA. That doesn’t necessarily support the position that humans caused the warming any more than pointing out that the Medieval Warm Period was warmer than now doesn’t support the position that humans caused that either. The graphs of Turkey and Europe don’t demonstrate that there has been anything resembling “hockey stick” warming, and the paper itself says that climate variability was more pronounced during the Little Ice Age. In other words, it doesn’t support the claim that modern warmth is unusual, unprecedented, or remarkable.
–
–
Yes, and elsewhere in the paper, it says that the 1733-1850 Little Ice Age period “is not significantly different from the late 20th Century SST mean.” With all that extra CO2, don’t you think there *should* be a significant difference between the late 20th century and Little Ice Age if your position is correct that recent warming is primarily human-caused?
–
–
No, Sebastian, this is a false statement. What you just copied/pasted is not what is written describing the graph used above in Fig. 14. The description for Fig. 14 actually says this:
“Time series (1979–2015) of mean annual temperature at 2 m above the surface [red trend line, shown], mean annual total ozone column [blue trend line, removed]”
Again, the “mean annual temperature at 2 m above the surface” is what is represented in the graph. The blue line from the figure was the “total ozone column” and was removed so as not to confuse those who are merely glancing at figures like these (which is what most people do). Temperature, not ozone, is what is being discussed here. To say the figure was “photoshopped” implies that something deceptive was done. Assuming that was your intent, SebastianH, why did you write a completely different caption for the graph than what appeared in the paper? That’s purposeful misrepresentation. And you did know that human-induced ozone depletion was supposed to induce Antarctic warming, not cooling, right? Another example of failed modeling.
–
–
Can you explain why you are again trying to imply something sinister is going on here by writing “unnecessarily photoshopped”? What was “unnecessary” about using the graphs from the paper, SebastianH? Only one of the graphs used shows Scotland’s trends. The others show other regions in the Northern Hemisphere. Nothing is amiss about showing the graphs from the paper that do not support the “hockey stick” conceptualization of modern temperature trends.
–
–
SebastianH, Fig. 10 from the paper shows that the 1950s had similar temperatures compared to now in the North Atlantic. The authors happen to start their trend line during the coldest phase of the NAO. And the bottom graph of North Atlantic anomalies from Reynolds et al. (2017) above is not “detrended”, and is consistent with the other paleoclimate literature that shows the long-term *trend* for the North Atlantic does not indicate anything unusual about the post-1950 period. For example, see the multiple reconstructions from this article:
https://notrickszone.com/2017/01/05/north-atlantic-cooling-has-plunged-below-1950s-and-1800s-levels-and-scientists-project-more-cooling/
However, because I agree there is potential for the first two graphs from Reynolds et al. (2017) to be misinterpreted, I have removed the graphs of CE and NA that show “detrended” temperature.
–
“Instrumental observations show an increase in ocean heat content (OHC) associated with the increase in greenhouse emissions.”
–
For a full critique of Rosenthal et al. (2017), see here:
https://notrickszone.com/2016/12/12/another-new-paper-reveals-no-discernible-human-or-co2-influence-on-global-ocean-temperatures-climate/
Have you been able to locate a physical experiment that demonstrates GHGs are primary determinants of OHC changes?
I took a look at the first two, the Köse, and the Flannery papers.
What you quoted From Köse et al., 2017 was immediately preceded by what Kenneth used, and what I see as the “money quote” attributing the warming to urbanization, NOT CO2:
.
You did the same with the Flannery et al., 2017, where you try to focus our attention on the most recent warming, which is in no way greater (and possibly a bit less) than two previous warmings. (see figure 3B.) Here is what they write, and what Kenneth quotes:
Got that? While the latter part of the century warmed, it was a part of no overall century long trend.
That is the same thing warmists do with the Arctic satellite record. They ignore what they have prior to 1979, because it destroys their narrative.
Kenneth may not quote what you do, but that’s not a problem, because it doesn’t alter the more general conclusions derived from what he does quote. You try to get us to focus on the tree, in hopes we’ll miss the forest.
And that is why we have no patience with you. You are not honest.
“summer-time warming in Scotland is likely not unique when compared to multi-decadal warm periods observed in the 1300s, 1500s, and 1730s”
Do people here really not understand the meaning of such a phrase?
One indicator in one location shows a higher temperature sometimes in the past.
This is saying nothing about the globe and today.
and please read the full abstract and not just the cherries being picked:
” Calibration against July–August mean temperature explains 56.4% of the instrumental data variance over 1866–2009 and is well verified. ”
50% sounds great!
“although trends before the mid-sixteenth century should be interpreted with some caution due to greater uncertainty.”
greater uncertainty? who cares!
I will repeat my simple question: which decade was globally warmer than the latest one INCLUDING ERROR BARS.
should be easy!
Don’t be silly
“which decade was globally warmer than the latest one INCLUDING ERROR BARS”
Where? And relative to when?
Where? And relative to when?
globally is globally. (surface temperatures of course)
And in absolute numbers, what else?
We don’t have “global” records extending back further than 1979, the first full year of satellite-monitoring. And 1979 was among the coldest years of the last 100. Surface records for the SH, especially for the oceans, are so sparse prior to the 1970s that any instrumental record that suggests we can know a “global” temperature using thermometers is presumptive at best. Because of the grossly under-represented scope of the thermometric record, especially at the poles (Greenland, Antarctica) and in continents like Africa and Asia and the sea surfaces, the best we can do is use proxy evidence for past temperatures at regional locations…and then compile them. And when we do that, recent decades continue to show that nothing is unusual about the modern period in the context of natural variability.
As I’ve pointed out previously, both the RSS and UAH satellite datasets indicate that both 1998 and 2016 are tied for the warmest years since 1979, with 2/100ths of a degree separating them.
@sod
Ahh, the old Error Bar. I’ve had many a good time there in the past.
OK, enough nostalgia: I think this may be what you are asking for, sod. but, like Deep Thought said, “You’re not going to like it.”
https://wattsupwiththat.com/2013/09/17/dodgy-statistics-and-ipcc-assessment-reports/
Barkeep. Another round for me and my warmist pal. He’s gonna need it.
What sop is actually trying to say is that that the temperature hasn’t actually change, within error, over the last 100 years or more.
yes.. WE KNOW THAT, sop.
Thanks for finally realising that there is really has been very little, effectively NO GLOBAL WARMING from increased CO2
Only the natural and highly beneficial rise from the LIA., which was a drop from the much warmer MWP , RWP and Holocene optimum.
The outcome was as expected, the resident trolls making complete fools of themselves, again.
Please elaborate … I invested time in reading those papers, have you even looked at them or is Kenneth’s biased overview enough? I tried to show you that you can even cherry-pick from papers which you think support your skeptical viewpoint. Just read the papers and you’ll understand what they are about, don’t pick a few sentences and charts without explanation that happen to support your point.
P.S.: I am waiting for AndyG55 and yonason to yell at me. Will they read those papers full of mentions of the greenhouse house effect? Surely those papers must have been written by some AGW-alarmist 😉
Sebastian –
Thanks for trying – but really you are demonstrating the point I’m trying to get at. Sure, you can find things in these papers that seem to support the general idea of AGW, but very often these are just throw-away lines showing that the authors have allegiance to (or, perhaps, fear of) the right-on position. You cannot RE-DESCRIBE these papers as being in scientific support of the consensus.
The point of all this meticulous work of Kenneth’s is, above all, to demonstrate
(1) that the science is NOT settled and
(2) that there is a voluminous body of work in the literature that contradicts, in part or in whole, many of the most dearly-held positions, and oft-repeated statements which are presented by the alarmists as FACT.
I think he does this very effectively.
I believe that I am open-minded about this fascinating debate, but all the evidence I’m seeing pushes me more and more into the sceptical camp. The warmists don’t seem to have much to offer today except for their strident shouting down of any sign of opposition.
I’d like to see a coherent and better considered response.
“Thanks for trying – but really you are demonstrating the point I’m trying to get at. Sure, you can find things in these papers that seem to support the general idea of AGW, but very often these are just throw-away lines showing that the authors have allegiance to (or, perhaps, fear of) the right-on position.”
this is just rubbish.
I quoted the relevant part above:
““although trends before the mid-sixteenth century should be interpreted with some caution due to greater uncertainty.”
the only part that could show a clearly higher temperature today (and today is 2009 in that paper) is around 1300. you add the error bars and your message is gone.
https://static-content.springer.com/image/art%3A10.1007%2Fs00382-016-3478-8/MediaObjects/382_2016_3478_Fig3_HTML.gif
“….I quoted the relevant part above:
““although trends before the mid-sixteenth century should be interpreted with some caution due to greater uncertainty.” ………..”
no one is going to disagree with that statement, sure, but are you saying that means nothing at all can be learned from the comparison? i.e, unless we can re-invent thermometers that can look back hundreds of years, we can’t make any comparison with today’s temperatures?
Remember, the onus is not on the sceptics, but firmly on the warmist community, whose own attempts at enrolling the palaeo record have been dubious, and at times shameful, to establish their case in the face of a very large body of contrary evidence (albeit, without error bars). Your objections seem both contrived, and partisan. Argument for argument’s sake
Everyone is STILL waiting for Sleb to produce something to support the very basis of his irrational, anti-science, religious belief in CO2 forced Global Warming.
Just one paper proving empirically that CO2 causes warming in a convective atmosphere. There must be one.. surely !!!
Thing is.. there is not proof it does cause warming.. NONE, NADA..
No CO2 warming signal in the whole of the satellite temperature data. Only NON-CO2 El Nino events.
It must take a deep-seated idiocy to continue to “believe” in something which is totally unsupportable from a scientific point of view…..
…… unless, of course, its a religion
Sorry Sebastian, I do not suffer fools lightly, even less so cherry-picking fools who proved my point in no time. Those less strong in their faith in the AGW, understand my point perfectly and am I not going feed trolls like you. If you ever get tired of the taste of cherries you might want to read the papers again and maybe even comprehend something. Until then, feel free pick more cherries.
So you didn’t understand at all and I wasted my time. So be it.
The ones cherry-picking are skeptics. I have great respect for Kenneth spending so much time to compile these lists. But you have to be blind to not see what those overviews are …
And claiming that the authors have to include some reference to established science to get published and in reality they are thinking it is all a big hoax … I have no words for this nonsense …
“So you didn’t understand at all and I wasted my time. So be it.”
yes, that is the reason why i only answer in examples any longer. It doesn t make sense to look at dozens of papers, just to have the results ignored.
–
No, in reality they are not thinking this is “all a big hoax.” Like you ostensibly do, many authors just accept what is sold to them as “settled science” about modern temperature changes predominantly caused by fossil fuel emissions because that is the “accepted” academic (and political) position. Scientists who question the paradigm generally keep those thoughts to themselves or de-emphasize them so as not to be excluded from the “accepted” class or otherwise marginalized.
No, I’m sure he understands your attempts to critique. The problem is that your “rebuttal” offered for 6 of the 17 papers, or 30+ graphs, is a rather glaring example of the very “cherry-picking” you are accusing “skeptics” of employing.
Essentially your argument is this: The last few decades are warmer than previous decades in the 20th century; therefore, human activity is responsible for recent warming.
Apparently we’re supposed to ignore the part where the warming in recent decades does not fall out of the range of natural variability, or that which has occurred without human perturbation. Because THAT is the point of publishing an article like this: to undermine the claims that recent decades are unusual, unprecedented, or in any way hockey-stick-like.
And no, I’m not convinced that YOU understand this.
@Kenneth Richard
“The problem is that your “rebuttal” offered for 6 of the 17 papers, or 30+ graphs, is a rather glaring example of the very “cherry-picking” you are accusing “skeptics” of employing.”
Precisely!
“and I wasted my time”..
ah… the story of your life… yet here you are continuing to waste your worthless time, bizarre, to say the least.
Trouble is that you also waste everybody else’s time with your cherry-picked idiocy.
Ask your self why you are here wasting your time.
The only thing you have managed to do so far is convince everybody here that you are at least as dumb, brain-washed and ignorant as sop… and that really is a race to the very bottom level of human intellect.
Kenneth, me cherry-picking from the listed papers was the whole point I was trying to make. Without actually reading the papers one gets a very biased summary from this post. Some of the papers don’t even show what you think they do (no warming, as in the one where you copied the detrended time series or no warming in Antarctica where the original image shows a strong relation between temperature and greenhouse gases which you deliberately omitted).
—
I see. So by cherry picking quotes from 6 of the 17 papers, disregarding that the graphs from those very same papers you cherry-picked quotes from that do not support your position that modern warmth is unusual or outside the range of natural variability, and by falsely misrepresenting (purposefully) what the Mayewski graph of Antarctica cooling shows…this was the “whole point” of what you were trying to do.
—
Why are you falsely claiming AGAIN that the “original image [from the Mayewski paper of Antarctic cooling] shows a strong relation between temperature and greenhouse gases” — which it clearly doesn’t — and then you falsely claim I “deliberately omitted” the blue trend line from the graph for deceptive reasons, which, again, is dishonest.
—
Let’s go through this again. The original graph from the Mayewski paper looked like this: https://notrickszone.com/wp-content/uploads/2017/01/Antarctica-Cooling-1979-2015.jpg (I took the time to copy it again…just for you.)
—
The description of the graph was this: “Fig. 14. Time series (1979–2015) of mean annual temperature at 2 m above the surface [red line], mean annual total ozone column [blue line].” I copied/pasted this quote from the description into the key at the top, as seen here: https://notrickszone.com/wp-content/uploads/2017/01/Holocene-Cooling-Antarctica-Circle-Mayewski-17-1.jpg
—
Since the blue line was the “total ozone column,” and ozone trends are not cogent to an article about temperatures, I removed the blue ozone line from the graph itself in photoshop so as not to confuse the casual observer (and most people just glance at images like these) into wondering what the blue line was vs. the red line. That was my sole purpose in removing the blue ozone line. It was not dishonest, as you are falsely accusing me of. Instead, it is you, SebastianH, who have engaged in deception and dishonesty, as you have claimed that the blue trend line from the “original image shows a strong relation between temperature and greenhouse gases.” By portraying the blue trend line, ozone, as “greenhouse gases,” you have engaged in deliberate fabrication. The blue trend line is not representative of “greenhouse gases.” This is a false statement, and I now can no longer assume you are an honest person.
—
If you’re “whole point” was an attempt to expose me as deceptive, it has backfired. You are the one who has been exposed here.
—
As mentioned above, I will say that because there was potential for the Reynolds graphs of CET and NA to be misrepresentative, I have removed them and only kept the graph of the North Atlantic that shows no significant temperature trends since the 1800s. That’s about the only “point” you made that has any validity.
I am aware what the description of figure 14 says. The paragraph immediately before the figure describes the recent climate trend. It specifically mentions greenhouse gases and the ozone hole.
The “whole point” was that you can cherry pick whatever you want from papers to present your view. Reading the papers results in a different picture which isn’t at all consistent with the believes of skeptics. I realize that this post was just about the hockey stick and the warming not being special, but that’s not all those papers are saying. And I do not believe that scientist write “accepted science” into their papers so it get accepted more easily. Are those authors then intentionally fooling the science community? Sounds like conspiracy theories to me.
Everyone here is deceptive, me included. I clearly have a bias as well as any other commenter here. Mine happens to go in the other direction. Sorry if it felt like an aggressive act from my side. It wasn’t ment as insult like all the real insults from other commenters on this blog/website.
Then why did you deliberately fabricate what the graph depicts, SebastianH, and then falsely accuse me of being deceptive by removing the blue ozone trend, which is NOT “greenhouse gases” as you claim (twice) in your explanation for why you think the blue trend line should have remained? I have no patience for this dishonesty. The blue ozone trend line was intentionally removed for completely honest reasons. You, on the other hand, have purposely accused me of deception when you know full well that the graph itself does not depict what you claim (“greenhouse gases”). Why do you claim that O3 = “greenhouse gases”, SebastianH?
And why did you imply that I did something insidious by referring to the graphs from Rydval et al. (2017) as “unnecessary” photoshops? What was photoshopped about them other than adding “Rydval et al., 2017” and the location “France-Spain” to the graphs so that the casual reader (who may not know where the Pyrenees are located) might know what region the graph represents? Why did you imply impropriety by saying photoshopping clarity is “unnecessary”?
So you’re basing your fabrication on the placement of the paragraph in relation to the graph…rather than honestly representing what the authors themselves wrote that the graph depicts? SebastianH, just because a graph is located in close proximity to an appealing sentence that you find supports your beliefs about “greenhouse gases” does not mean you get to fabricate a claim that that is what the graph is actually depicting…and then falsely accuse others of deception. You’re digging a deeper hole for yourself. It would be better to apologize for the false accusation and purposeful misrepresentation than to continue down this track.
In other words, if I state my position, and then support this position with graphs from scientific papers that do not support the CAGW position that modern warming is global, unprecedented, or remarkable, I am engaging in…what? Deception? Dishonesty? Cherry-picking? Should I expect you to support your positions with papers and graphs that do not actually support your positions? Of course not. I would expect that, if you believe the entire world has undergone hockey-stick warming since 1950 (hence global warming), you will produce graphs that look like hockey sticks. That’s what people do who intend to support their positions. Again, what in the world is sinister about supporting my stated positions with scientific evidence?
Kenneth, I really hope you by now understand that the only goal of trolls like Sebastian is to make you waste your time, rather than using your time writing excellent posts like the one above. There is no point in arguing with AGW-missionaries, who have shown no respect for honesty.
I actually thought that SebastianH was a little different than most. He hadn’t demonstrated this level of blatant dishonesty before (that I had witnessed). Just some fudging, a lot of subject-changing, some diversional analogies…but not outright fabrications. Even now, I’m a little surprised he hasn’t tried to at least apologize for the false accusations. I guess it’s true that, like David Appell, he comes here, takes a dump, and then leaves. Just thought he’d be better than that.
Pointless yelling at this fool named Slebastian. Its skull is too thick.
It still hasn’t put forward a paper that shows empirically that CO2 causes warming in a convective, pressure/thermal controlled atmosphere.
Until it can, the sleb is a waste of time and space.
Point an infrared spectrometer up at the sky and it will tell you how much backradiation is caused by which gas. There is no magic behind the greenhouse effect.
How would you describe the energy budget of earth? Why is the surface as warm as it is? If possible, please provide a link for further reading (I’d like to know why you persist that CO2 has no effect)
Sebastian
I don’t support at all the rather silly ad. homs that you seem to attract, and I’ll thank you for sticking with it (Pierre’s blog deserves more attention than it currently gets).
However, you’ll surely see that your appeal to ‘basic physics’ which I assume is what your last comment is getting at, really isn’t addressing the substance of this post. No serious sceptic denies the emission spectrum of CO2, but that’s a helluva long way from conceding CAGW.
Andy-
Back off, will ‘ya?
Completely agree. Having spent 2 years undergoing name-calling, insults, false accusations… on pro-CAGW comment boards (and never returning the vitriol), I would like to think that skeptics are above doing that when we have brave souls who dare to try to support their beliefs here.
“Seb still hasn’t put forward a paper that shows empirically that CO2 causes warming in a convective, pressure/thermal controlled atmosphere.”
Waiting.. waiting .. waiting
So far an absolute blank, just ducking and weaving.
There is absolutely no CO2 warming signal in the satellite temperature data, none whatsoever.
NO CO2 signal in the sea level data.
There is NO PROOF anywhere that CO2 causes warming in a convective atmosphere.
I am waiting for you to provide that proof, but it seems you are totally incapable of doing so.
You duck and weave, and complain about getting a bit of actual heat for you stupid comment.
Pathetic.
Another Gish Gallop.
We’re on to you.
You again with your “Gish Gallop” nonsense.
It’s a stupid analogy.
It is a debating technique designed to give the opponent no time to respond in the time frame allowed. Here we have all the time we want. You’re using it proves you haven’t a clue what it is, and all you want to do is cast doubt on what’s being said.
Oh, and also, having seen it employed I can say the person using it brings a lot of irrelevant information, making it impossible to easily show any single point is wrong. Here, Kenneth uses it to bring a massive amount of evidence in favor of a single point or two. IT IS NOT THE SAME AT ALL.
You David,with that PHD in your back pocket,utterly fail to post a decent evidence based counterpoint,to numerous published research papers listed here.
All you have is your dead on arrival babble,to brag about,pathetic effort from a PHD owner.
Lets face it David, the Hockey Stick delusion is well exposed.
David lasted 5 years in science.. around 20 years ago he found it way too hard for him, the hallucinogenic drugs etc probably didn’t help, and degenerated into a low-end science fantasy writer.. a job he sticks with all the time on his blog postings.. sci-fantasy from the gutter. !!.
PS: Writing “The Hockey Stick Collapses” is plain stupid — the hockey stick doesn’t make projections of the future, it reconstructs temperatures of the past, and it stops about 1970 due to the northern forest divergence problem.
Did someone claim the hockey stick “makes projections of the future”?
Do you believe it’s scientifically acceptable for Mann to have claimed his graph represented the entire Northern Hemisphere by using a few trees from North America?
Another D.o.A. straw man down. Not to worry, he’ll repeat it ad nauseum in future posts. Why? because he is an activist jerk, not interested in learning, but just interfering with same.
Kenneth,the Bristlecone tree ring data,that Dr. Mann used,were taken form Dr. Isdo’s paper which were not about temperature,but about increased CO2 effect on plant growth.
David, you need to get of the proven hockey stick delusion.
====================================================================
You were taken apart about the global cooling evidence:
David Appell : The Global Cooling Denier
https://stevengoddard.wordpress.com/2012/05/27/david-appell-the-ice-age-scare-denier/
====================================================================
You were taken apart over the bogus Australian death thread claims too.
Paging David Appell and Nick Stokes again: time to fess up and apologize
https://wattsupwiththat.com/2012/05/28/paging-david-appell-and-nick-stokes-again-time-to-fess-up-and-apologize/#comments
====================================================================
In continued delusion over bogus hockey stick papers.
More Appell comedy gold
http://www.bishop-hill.net/blog/2015/9/1/more-appell-comedy-gold.html
====================================================================
Stop being delusional,David.
[…] 17 New (2017) Scientific Papers Affirm Today’s Warming Is Not Global, Unprecedented, Or Remarkable. By Kenneth Richard on 26. January 2017 A collection of 60 peer-reviewed scientific papers published in 2016 were displayed here last month in an article entitled, “The Hockey Stick Collapses: 60 New (2016) Scientific Papers Affirm Today’s Warming Isn’t Global, Unprecedented, Or Remarkable“. […]
[…] that began at the end of the Little Ice Age. Check the resources in this section for more… 17 New (2017) Scientific Papers Affirm Today’s Warming Is Not Global, Unprecedented, Or Remarkable. By Kenneth Richard on 26. January 2017 A collection of 60 peer-reviewed scientific papers […]
Agree with the basic premise and content but totally disagree with the methodoloy behind the conclusions. The derived (contrived)thing used to show the warming or cooling is not the correct scientific term or measure of heat content. “Temperature anomaly” is contrived by modellers to comply with the result modellers want. Yet most of those papers cited go to it for the vertical axis. There is no scientific meaning to the term average temperature. Ask yourself what the meaning of the average temperature between New York and Melbourne has to someone in London. Or what meaning can be given to the average temperature between midnight on Tuesday and midnight on Friday on the Equator to remove the spatial aspect.
The horizontal axis cannot be scaled meaningfully for presentation of point-time specific events. It is an “average” representation of a dimension that cannot be averaged.
On the occasions that I have asked a warmist these conundrums I have never found the answer. Plenty of apoplexy and bluster usually at questioning this basic belief.
Right!
Temperature is a quantity that is only indirectly related to heat content, and so isn’t a proxy for that. Averaging it is meaningless, even on small scales (bridges freeze before roads, for e.g.).
Multi-variable chaotic non-linear processes CAN NOT be modeled. There is no meaningful statistical analysis that can be done on them.
[…] illustrate, consider the 60 papers published in 2016 (or the 17 papers already published in 2017) that display no clear evidence of an unusual warming trend after the 1940s — or in the last […]
[…] Li et al., 2017 Summary The Mechanism Of Solar Forcing And Climatic/Oscillatory Changes Conclusion. 17 New (2017) Scientific Papers Affirm Today’s Warming Is Not Global, Unprecedented, Or Remarkable. […]