Global Temperature ‘Truth’ Changes With The Times
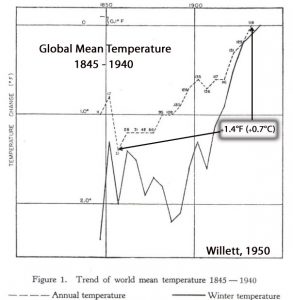
In the early 1950s, the accepted scientific truth — as determined by thermometer records available at the time — was that global mean temperatures had risen by 0.7°C between 1860 and 1940.
Willett, H. C. 1950. “Temperature Trends of the Past Century” Centenary Proc. Royal Meteorol. Soc., pp. 195-206.
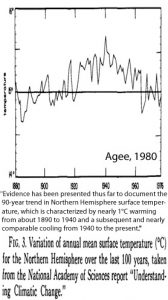
As recently as 1980, it was still considered “consensus” science that the Northern Hemisphere had warmed by “nearly 1.0°C” between 1880 and 1940, and then cooled by a “nearly comparable” amount from 1940 to the late 1970s.
Agee, 1980
The Temperature ‘Truth’ Changes After The 1980s
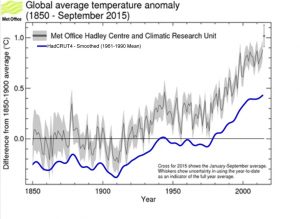
The raw thermometer or instrumental temperature data available in the 1950s have not changed in the last 35 years. In other words, daily high and low temperature numbers from thermometer accounts that were not available in the 1870s or 1910s or 1930s did not subsequently become available, or appear, in the years following the early 1980s. And yet after the 1980s, the thermometric instrumental record accepted during the 1950s to 1970s was fundamentally changed to reflect a new truth that aligned with climate models. For instead of a global warming +0.7°C between 1860 and 1940, the Met Office decided that the 1860-1940 warming trend should be +0.3°C instead. Again, no new raw thermometric evidence had emerged. And yet about 0.4°C of warming was lopped off the previously accepted trend anyway.
Source
New Paper’s Ice Core Evidence Indicates Globe Was Similarly Warm In 1920s, 1930s
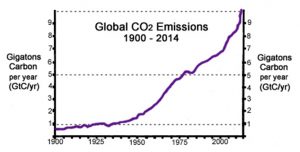
Interestingly, when graphs of regional temperatures using geophysical proxy evidence (ice cores, tree rings, etc.) are reconstructed for the last few centuries or millennia, the results look rather different than the current instrumental records do. Instead of a sharp warming trajectory after the 1950s, for example, many regions do not show a significant warming trend at all. In fact, more and more, temperature reconstructions using proxy evidence indicate that there has been no unusual or remarkable warming trend in recent decades that strongly aligns with the abrupt increase in anthropogenic CO2 emissions after the 1940s.
To illustrate, consider the 60 papers published in 2016 (or the 17 papers already published in 2017) that display no clear evidence of an unusual warming trend after the 1940s — or in the last 100+ years relative to the last few thousand. Instead, many reconstructions of regional temperatures using proxy evidence show that a large portion of modern era warming occurred prior to the 1940s, and not after it.
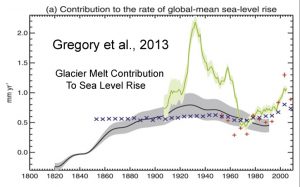
For example, consider the glacier melt rate in the 1920s to 1950s relative to recent decades in Gregory et al. (2013) below. Could this explosive glacier melt rate have occurred with only modest warming as depicted in the highly altered instrumental record?
Gregory et al., 2013
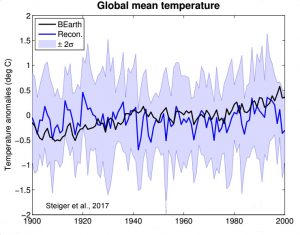
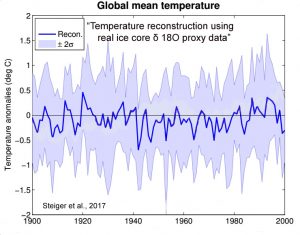
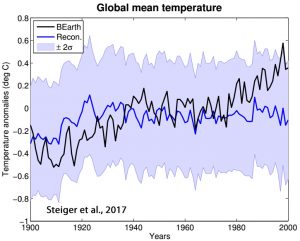
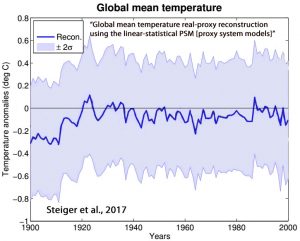
Now, in a new paper, Steiger et al. (2017) have constructed graphs using compilations of ice core proxies to represent the globe. As might be expected, there are notable differences in the reconstructions of global temperature using geophysical evidence when compared to the instrumental thermometer record (Berkley Earth). Namely, (a) the instrumental record warms up the post-1970s period substantially relative to the ice core record (which shows an incompatible non-trend or cooling after the 1990s), and (b) the ice core record shows much more warming than the instrumental record does in the early 20th century.
In the graphs below, the instrumental (black) and isotope record (blue) appear together (as they do in the paper), and then the instrumental trend is removed in the subsequent representation.
Steiger et al., 2017
“Through several idealized and real proxy experiments we assess the spatial and temporal extent to which isotope records can reconstruct surface temperature, 500 hPa geopotential height, and precipitation. We find local reconstruction skill to be most robust across the reconstructions, particularly for temperature and geopotential height, as well as limited non-local skill in the tropics. These results are in agreement with long-held views that isotopes in ice cores have clear value as local climate proxies, particularly for temperature and atmospheric circulation.”
Temperature ‘Truth’ Pivots Upon One’s Presuppositions, Biases
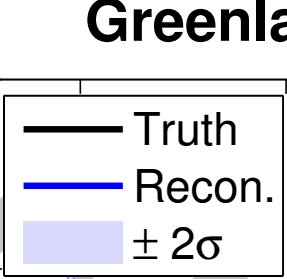
Convinced we have already obtained the truth about global temperatures, the Steiger et al. (2017) scientists possess the certitude to encapsulate that very word in their graph keys:
Considering scientists 30 years ago were documenting an artificial (urbanization) warming bias of more than 0.1°C per decade already existed in the post-1970s instrumental records, that 1/3rd of the oceans hadn’t even been sampled (temperatures) yet as of the 1990s, or that overseers of temperature datasets acknowledged that they just “made up” temperatures in places where there was no data, can we really know the Earth’s true temperature?
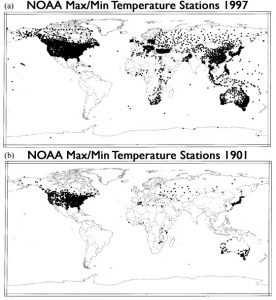
Take a locality like Greenland. When we consider that just a tiny fraction of the Greenland ice sheet has instrumental temperature readings available for both recent decades and for the beginning of the 20th century (see illustration below), just how certain can we be that we have the truth anyway?
Peterson and Vose, 1997
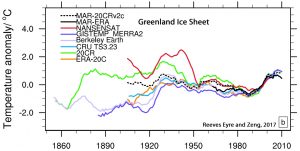
Or consider the below graphic of competing early 20th century temperature trends for Greenland. Reeves Eyre and Zeng (2017) indicate modeling biases may reach 5°C for Greenland, and they point out that widespread temperature monitoring has only been available since the 1990s.
Of the spaghetti of trends depicted in the graph below, which one is the truth? For those who believe the warming in recent decades is dangerously unprecedented, the lower early 20th century temperature trends are truth. For those skeptical that the modern climate is unusually warm or that the Earth’s climate undulates in concert with CO2 emissions, the truth is likely that the 1920s and 1930s had warmer temperatures. Which conceptualization is the “right” one? Probably neither.
Reeves Eyre and Zeng, 2017
“Ice sheet-average annual mean SAT [surface air temperatures] from different datasets are highly correlated in recent decades, but their 1901–2000 trends differ even in sign [some show cooling, some show warming]. Compared with the MERRA2 climatology combined with gridded SAT analysis anomalies, thirty-one earth system model historical runs from the CMIP5 archive reach ~5°C for the 1901–2000 average bias and have opposite trends for a number of sub-periods. … Due to its remoteness and extreme climate however, continuous widespread climate monitoring over the GrIS has been carried out for only about the last two decades, and even then with rather sparse coverage in some geographic areas and glaciological regimes. … Box (2002) found a pattern of warming from ~1900 to ~1940, cooling from ~1940 to ~1990, and warming from ~1990 onwards. In addition, inter-annual variability was found to be closely related to the North Atlantic Oscillation (NAO). …Biases vary by season and by region of the ice sheet: in the ablation region (demarcated here by the 1500 m elevation contour) during summer, most reanalyses have a ~1°C positive bias (though 20CR and ERA–20C have negative biases) while CRU and Berkeley Earth gridded SAT analyses have larger positive biases.”
Before It Was Ignored, The Scientific ‘Consensus’ Was That Explosive Warming Occurred Prior To The 1940s
At the time, there wasn’t any disagreement among geologists. The late 19th century to early 1940s was considered a period of unprecedented warming. The highest temperatures on record.
The Arctic winter warmed by 7.7°C. Antarctica warmed by nearly 3°C. Sea levels rose at a clip of 8 mm/yr in the Atlantic. Glaciers melted “catastrophically”. Dozens of animal species migrated north to escape the warmth. Crops could be grown in regions where they hadn’t before.
At the time, this was the climate truth. Below is a summary of accepted climatic trends as they existed in 1959, compiled by Princeton geologist Dr. Erling Dorf.
Dorf, 1959: “CLIMATIC CHANGES OF THE PAST AND PRESENT”
•A 14°F (+7.7°C) winter mean warming in the Arctic (North Pole region) between the early 1900s and 1950, with ice-free ports 7 months out of the year rather than the mere 3 months per year that were common at the turn of the century.
“It has been observed, however, that the greatest temperature increases during the last hundred years have been in the Arctic regions. In Spitsbergen, only about 10 to 12 degrees from the North Pole, the mean winter temperatures have risen about 14° F. since 1910 (Willett, 1950). Ice-free ports there are now open to navigation about 7 months of the year as compared with only 3 months fifty years ago (Ahlmann, 1953, p. 32). If the warming trend of the north polar region should continue at its present rate, it has been estimated that the entire Arctic Ocean would be navigable all year long within about a hundred years.”
•A 5°F (+2.8°C) warming in Antarctica since the early 1900s.
“At the opposite end of the world, according to recent reports from the Weather Bureau (Wexler, 1958), the Antarctic region has undergone a rise of about 5°F. in average temperature in the last fifty years.”
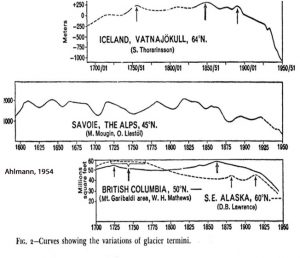
•“Catastrophic” and “violent” wasting away of glaciers since 1900, with Muir Glacier retreating 2 miles (3.2 km) in 10 years. The retreat began in the 1700s, with severe wasting between the 1920s and 1940s.
“What have been some of the notable results of this warming trend during the last hundred years? Glaciers throughout the world have been melting away at a rapidly increasing rate. Brooks (1949, p. 24). the eminent British paleoclimatologist, stated that “Since the beginning of the 20th Century glaciers have been wasting away rapidly, or even catastrophically.” In the Juneau region of Alaska, all but one of the numerous glaciers began melting away as far back as 1765. Muir Glacier, for example, has retreated as much as two miles in 10 years. Baird and Sharp (1954, p. 143) have referred to the “alarming retreat of glaciers” in the Alaskan region; along the Pacific Coast of North America and in Europe they believe the glacial melting “appears to be progressing violently.” In only a few regions of the world, such as the Pacific Northwest, are there any records of glaciers advancing during the past century, and these have been mostly since 1950 (Hubley, 1956).”
Ahlmann, 1953
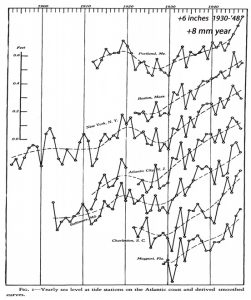
•Due especially to the massive glacier-melting during the 1920s to 1940s, there was as much as a 6-inch (15 cm) rise in sea level between 1930 and 1948, a rate of about 32 inches (+80 cm) per century, or 8 mm per year, which is 5 times the overall rate of rise for the entire 1901-2010 period (1.7 mm/yr) according to the IPCC (2013) and a “six-fold” increase relative to the 19th century rate.
“Believed in large part to be the result of the melting of the world’s glaciers, sea level has been rising at a rapidly increasing rate, amounting to as much as a 6-inch rise from 1930 to 1948 (Marmar, 1948). This is about four times the average rate of sea level rise during the past 9000 years [~2 mm/yr], as recorded by Shepard and Suess (1956). It should be noted that more than a six-fold increase in the rate of sea level rise occurred in the mid-1920’s at the same time there was a striking change in the rate of glacial melting in the north (Ahlmann, 1953, Fig. 11).”
•Agricultural crop lines shifted 50 to 100 miles (80 to 161 km) northward, with 10-day longer growing seasons. Tree lines moved 65 feet (20 meters) up the mountains in Sweden.
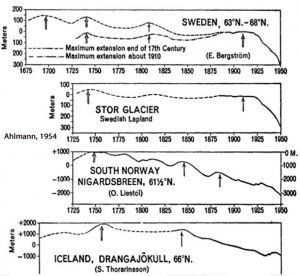
“Changes in vegetation brought about by the warmer temperatures include the encroachment of trees into the subpolar tundra as recorded in Alaska, Quebec, Laborador, and Siberia. In the Canadian prairies the agricultural crop line has shifted from 50 to 100 miles northward as a result of the lengthening of the growing season by as much as ten days. In parts of northern New England and eastern Canada the birch trees have been dying off over large areas, and the spruces and balsams have begun to suffer as a result of the rise in summer temperatures. In Sweden the timberline has moved up the mountain slopes as much as 65 feet since 1930 (Ahlmann, 1953, p. 35).”
•Many birds and mammals extended their habitats northwards; about 25 species of birds advanced from the south up into a warmer Greenland; codfish replaced seals along the coasts of Greenland, which led “Greenland Eskimos” to switch to cod-fishing rather than seal-hunting.
“In the animal world many southern types of both birds and mammals have been extending their habitat ranges northward as a result of the warming trend. The cardinal, the turkey vulture, the tufted titmouse, and the blue-winged warbler, as well as the warmth-loving opossum, have slowly moved their ranges into the northern United States. A good many central European species of animals have been shifting their ranges northward into Scandinavia, Greenland, Iceland, and the Faero Islands. Twenty-five species of birds alone are reported to have invaded Greenland from the south since 1918 (Jensen and Fristrup, 1950). Codfish from the Atlantic have replaced the seals in the waters along the coast of Greenland. It is reported that compared to a shipment of 5 tons of codfish from Greenland in 1913, the 1946 shipment had risen to over 13,000 tons; the Greenland Eskimos have become cod fishermen instead of seal fishermen (Kimble, 1950). Farther south tunafish have moved northward into the waters off New England, and tropical flying fishes have become increasingly common off the coast of New Jersey.”
The ‘Truth’ About Past Climates…Is What We Want It To Be
But the truth about the climate as it existed in the 1950s is no longer accepted or acceptable. And that version of the truth is to be ignored. Why? Because if we accept that dramatic and rapid warming (and glacier melt and sea level rise) could occur while anthropogenic CO2 emissions were flat and rather negligible (prior to the 1940s), then we would have to acknowledge that modern climate changes may not be predominantly influenced by human activity. And that couldn’t be the truth. So . . . it isn’t.
And 2016 was the Earth’s hottest year on record.


Some very interesting papers there. The current crop of “activist” scientists are doing so much damage to the integrity of science that it is perhaps irreparable.
The lack of real temperature record for the vast majority of the globe is what prevents NOAA’s historic records being meaningful as a global reference. However as a regional indicator, especially for the USA, it could be useful, if the records are not tampered with (adjusting past records).
As various climate effect are very regional it would be more useful to examine real temperature records for a region rather than attempt to dig significance out of a morass of homogenized temperature records.
It is easier to see the global effects if they were presented as an array of sharply focused regional snap-shots, than the de-focused smear of homoginized data. Sharply focused regional snap-shots would also have the advantage of easily showing where better data is required thus better indicating where new stations could usefully be deployed.
“Could A New Global Temperature Reconstruction Using Ice Cores Be More Accurate Than The Instrumental Record?”
NO NO NO!
what kind of a question is this?
could the market fair future teller give me good investment advice?
Given the nature of wholesale “adjustments” and tendentious data manipulation intrinsic to the instrumental record, with artificial removal of the previously documented several tenths of a degree cooling in the 1960s and 1970s, as well as the several tenths of a degree warmer temperatures during the 1920s to 1940s — not to mention the additional +0.2 C of phantom warming added to the 1998-2016 trend relative to satellites — it is indeed pertinent to ask whether the instrumental record has been corrupted so profoundly that it ceases to be reliable.
For example, according to Gregory et al. (2013), the glacier melt contribution to sea level rise was far greater in the 1920s to 1940s than it was during the the last few decades, as shown here:
https://notrickszone.com/wp-content/uploads/2016/10/Holocene-Cooling-Global-Glacier-Melt-Contribution-To-Sea-Level-Rise-copy.jpg
Considering the highly adjusted instrumental record indicates that global temperatures were much colder during the 1920s to 1940s, why did glaciers melt so much more rapidly during that period than in recent years, sod?
For that matter, did you even read the article, sod? The observations available from geologists in the 1950s indicate that sea level rise, glacier melt, warming in the Arctic and Antarctic, growing season length…were all more pronounced than what has been observed in recent decades. And yet, for the sake of the cause, this evidence has been erased. Obviously, you have no problem with this incompatibility, as it fits the paradigm you believe in.
Kenneth, please, ONCE IN A LIFETIME, but error margins around your reconstruction curves.
That would answer your question in a second.
Compared with modern thermometer data, ice cores are rubbish, as are all other proxies.
You do not like the facts, but they still are facts.
They’re not my reconstruction curves, nor are they my glacier melt rate trends or sea level rise trends from the 1920s to 1940s. I shouldn’t be adding my own error margins around reconstructions to “answer [my] question in a second.”
If that’s the case, your “thermometer data” has no long-term context. So saying 2016 is the “hottest year ever” means that it’s the hottest year since…1979 (though it isn’t — satellites have 1998 just as warm).
Can I assume you agree that Mann’s hockey stick reconstruction, as well as Marcott’s (2013) reconstruction, are “rubbish” then?
“The observations available from geologists in the 1950s indicate that sea level rise, glacier melt, warming in the Arctic and Antarctic”
the glaciar melt was caused by soot.
http://climatenewsnetwork.net/soot-melted-alps-glaciers-not-heat/
So at what point did glaciers stop melting because of soot, and instead they began melting due to 0.000001 changes in atmospheric CO2?
Thankyou Mr Richard for providing a very informative article;especially the numerous references to pre-alarmist papers.I have seen sea captains logs from the 19th century where disappearing,and disappeared glaciers are noted as well as raised Arctic ocean temps.
The abrupt increase in temp.appears to be similar to the one that brought us out of the last major ice age,and if a cooling trend now takes hold,perhaps our present interglacial will end faster than we thought it would.
I will now go away and see what more information I can glean from your refs. above .
It will be more than pleasant to read papers that contain hopefully some scientific truth,rather than some of the current alarmist dross