The ‘Real Proxy’ Temperature Record
Hints Near-Global Cooling Has Begun
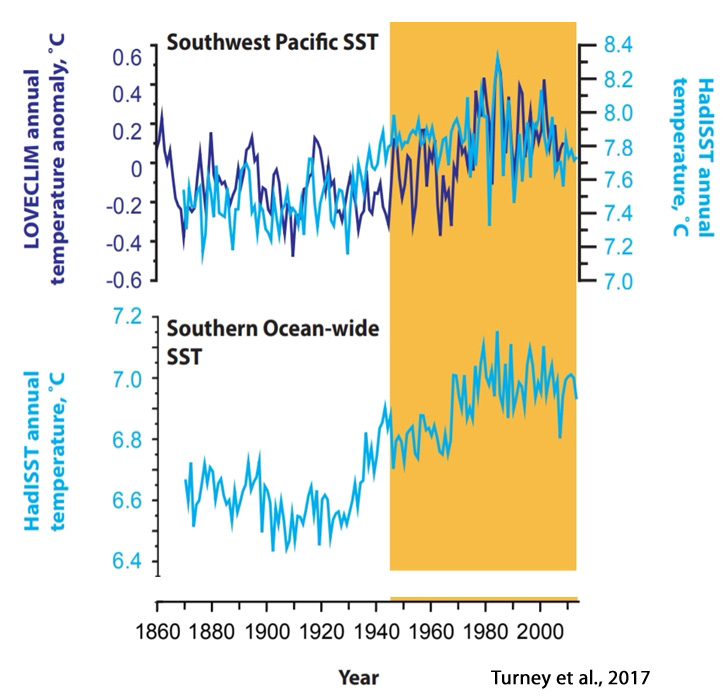
As a new scientific paper (Turney et al., 2017) indicates, the Southern Ocean encompasses 14% of the Earth’s surface. And according to regional temperature measurements that have apparently not been subjected to warming “corrections” by data adjusters, the Southern Ocean has been cooling in recent decades.
The Northern Hemisphere embodies the top half (50%) of the world’s surface. And according to many scientists’ temperature reconstructions using proxy evidence (ice cores, tree rings, etc.) from numerous locations North of the equator, there has been no net warming in the Northern Hemisphere since the 1940s.
Antarctica (2.7%) and the Indian Ocean (14.4%) together represent about 17% of the Earth’s surface. Neither Antarctica nor the Indian Ocean have been observed to have warmed since the 1970s, with Antarctica exhibiting a cooling trend.
Just these regions of the globe alone represent more than 75% of the Earth’s surface. A net non-warming (cooling) trend in these regions in recent decades is highly inconsistent with commonly accepted instrumental data sets (such as NOAA, NASA, and HadCRUT) which show an abrupt recent warming trend – especially since the 1980s.
Is Ice Core Evidence More Reliable Than Heavily Adjusted Instrumental Record?
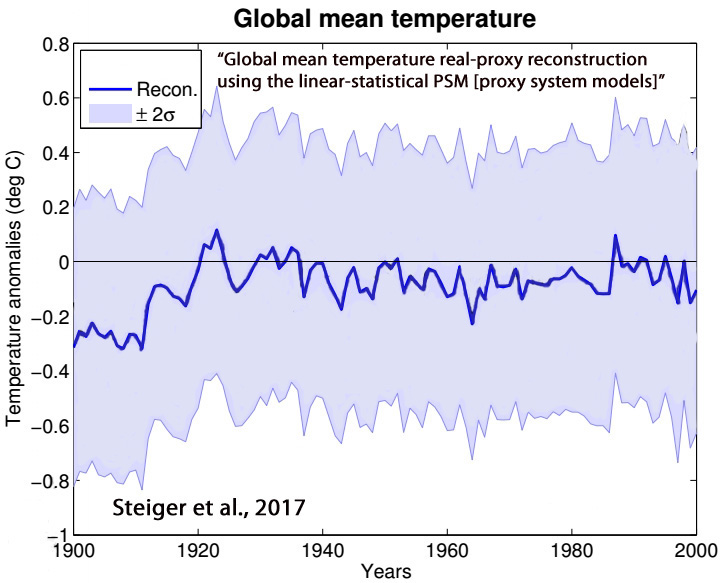
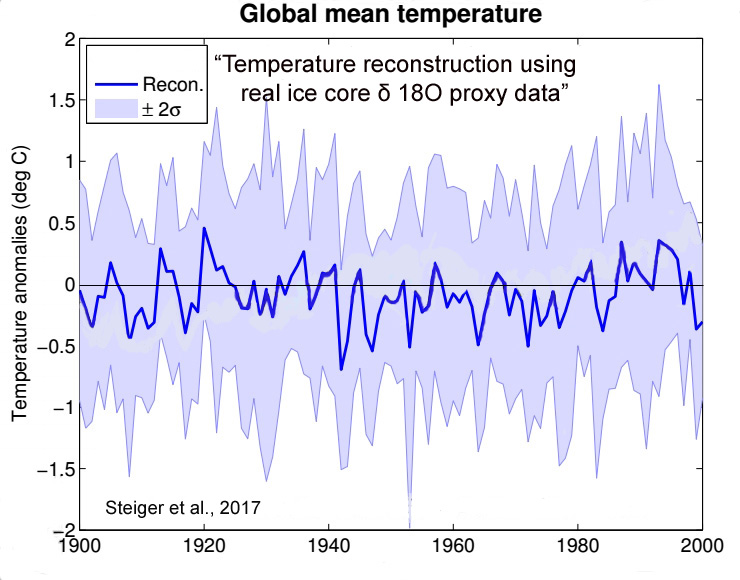
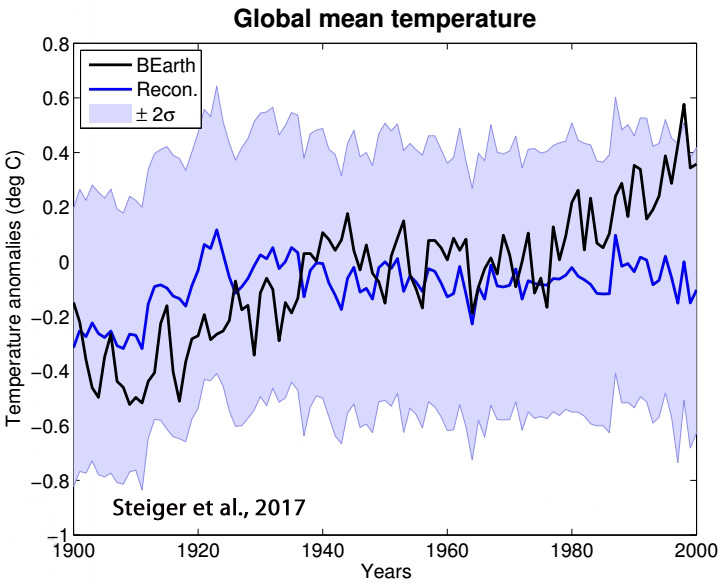
Earlier this year, an intriguing paper published by Steiger et al. (2017) contrasted the instrumental temperature record (which showed dramatic recent warming) with the global-scale temperature record as revealed by “real proxy” evidence from ice cores. The reconstructions using proxy evidence showed a global warming trend during the first half of the 20th century, and then no significant net warming thereafter.
Steiger et al., 2017
“Through several idealized and real proxy experiments we assess the spatial and temporal extent to which isotope records can reconstruct surface temperature, 500 hPa geopotential height, and precipitation. We find local reconstruction skill to be most robust across the reconstructions, particularly for temperature and geopotential height, as well as limited non-local skill in the tropics. These results are in agreement with long-held views that isotopes in ice cores have clear value as local climate proxies, particularly for temperature and atmospheric circulation.”
Interestingly, the Steiger et al., (2017) “real proxy” global temperature trends during the modern era seem to align with hundreds of other regional proxy temperature reconstructions that permeate the recently-published scientific literature.
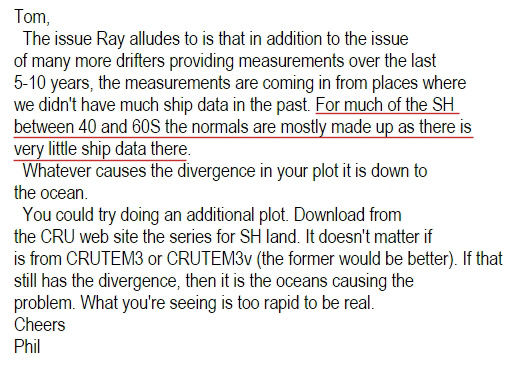
Scientists have previously acknowledged that (a) an artificial (urbanization) warming bias of more than 0.1°C per decade existed in the post-1970s instrumental records, (b) 1/3rd of the oceans hadn’t even been sampled (temperatures) yet as of the 1990s, and (c) overseers of temperature data sets just “made up” temperatures in places where there was no data. Therefore, could it be possible that “real proxy” temperature reconstructions are more reliable and authentic than the data from thermometers corrupted by urbanization and bias?
Below is a compilation of about 65 graphs from peer-reviewed scientific papers indicating that recent decades are no warmer (and in several cases cooler) than the instrumental data sets suggest.
For large regions of the globe, cooling may have already begun.
Southern Ocean (Pacific) – Cooling Since 1979
Turney et al., 2017
“Occupying about 14% of the world’s surface, the Southern Ocean plays a fundamental role in ocean and atmosphere circulation, carbon cycling and Antarctic ice-sheet dynamics. … As a result of anomalies in the overlying wind, the surrounding waters are strongly influenced by variations in northward Ekman transport of cold fresh subantarctic surface water and anomalous fluxes of sensible and latent heat at the atmosphere–ocean interface. This has produced a cooling trend since 1979.”
Jones et al., 2016
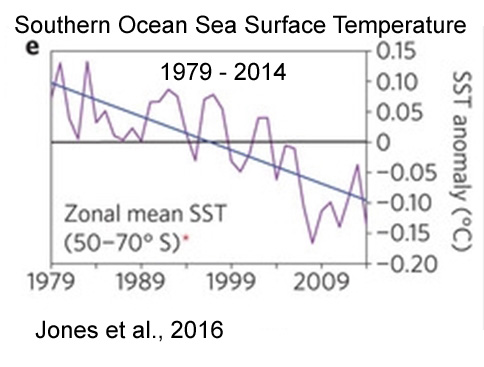
Fan et al., 2014
“Cooling is evident over most of the Southern Ocean in all seasons and the annual mean, with magnitudes approximately 0.2–0.4°C per decade or 0.7–1.3°C over the 33 year period [1979-2011].”
Wei et al., 2015

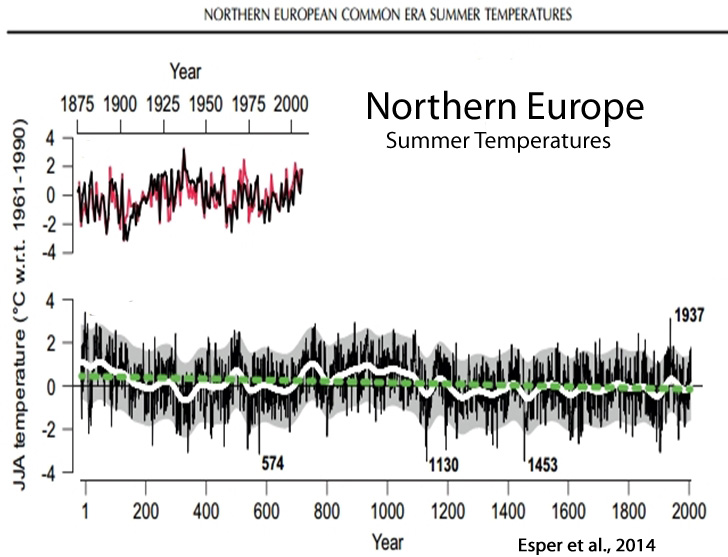
Northern Hemisphere – No Net Warming Since 1940s
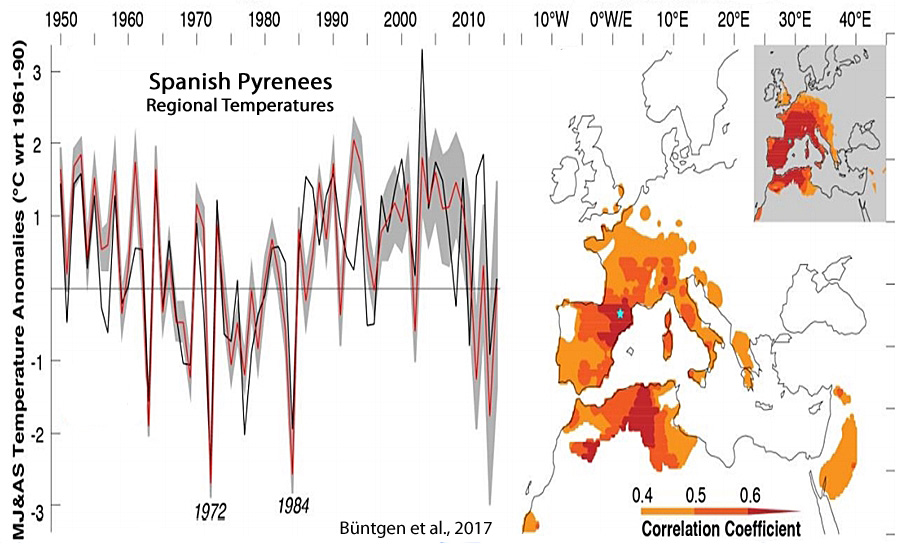
Büntgen et al., 2017
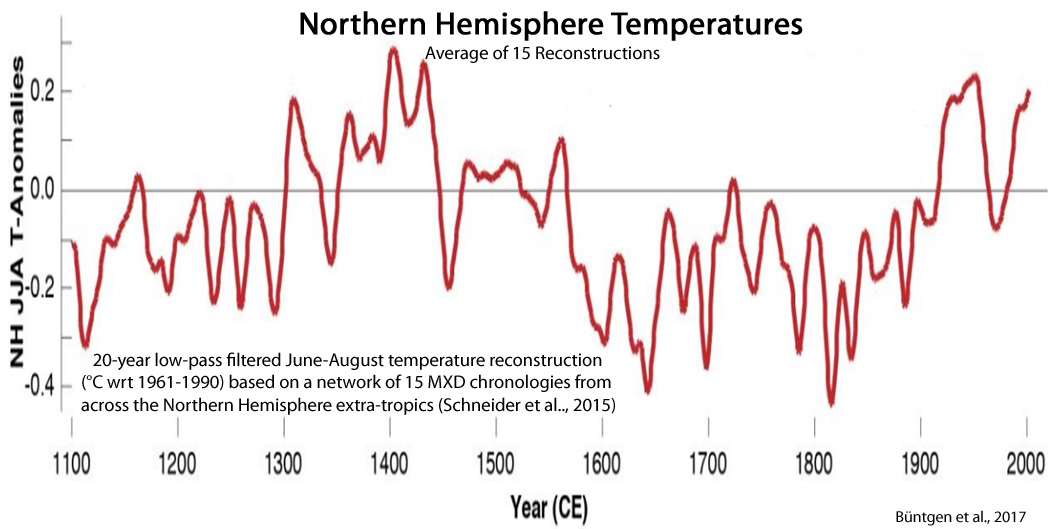
Schneider et al., 2015
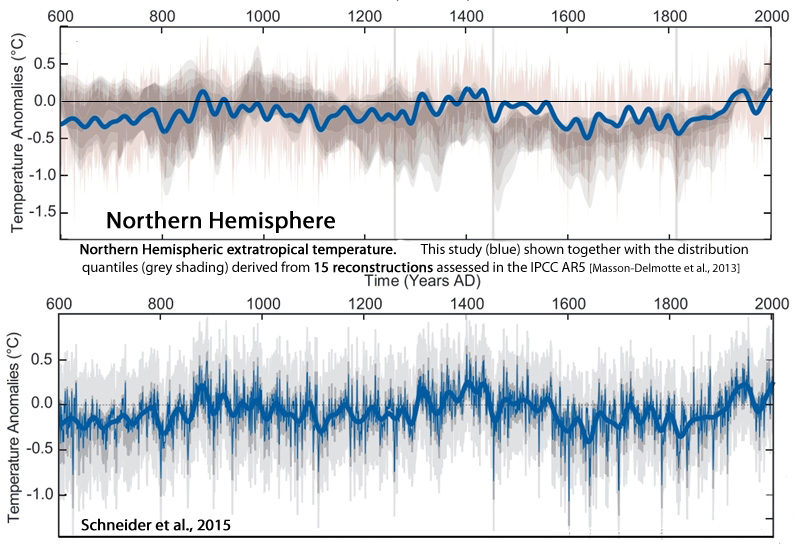
Stoffel et al., 2015

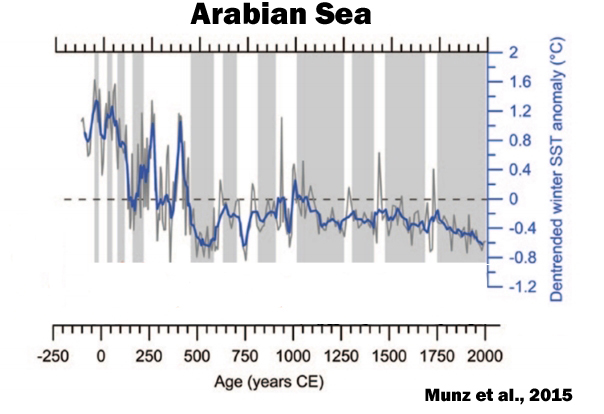
Indian Ocean (Arabian Sea) – No Net Warming Since 1970s (1750)
Zinke et al., 2016

Munz et al., 2015
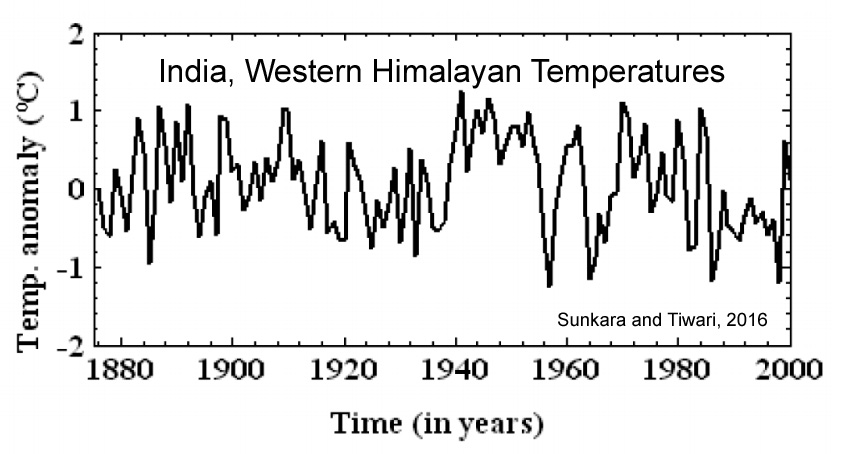
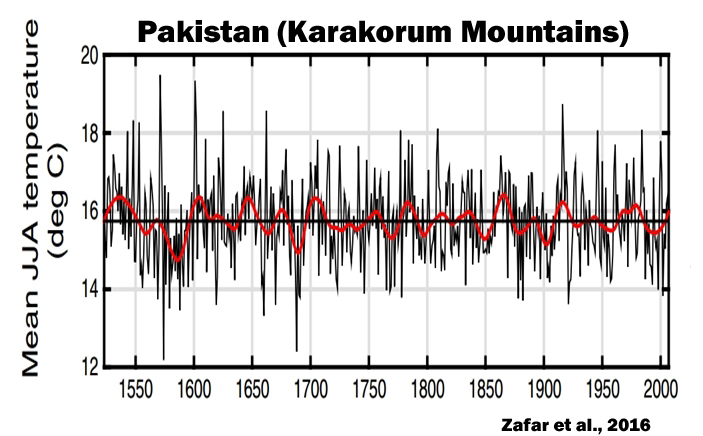
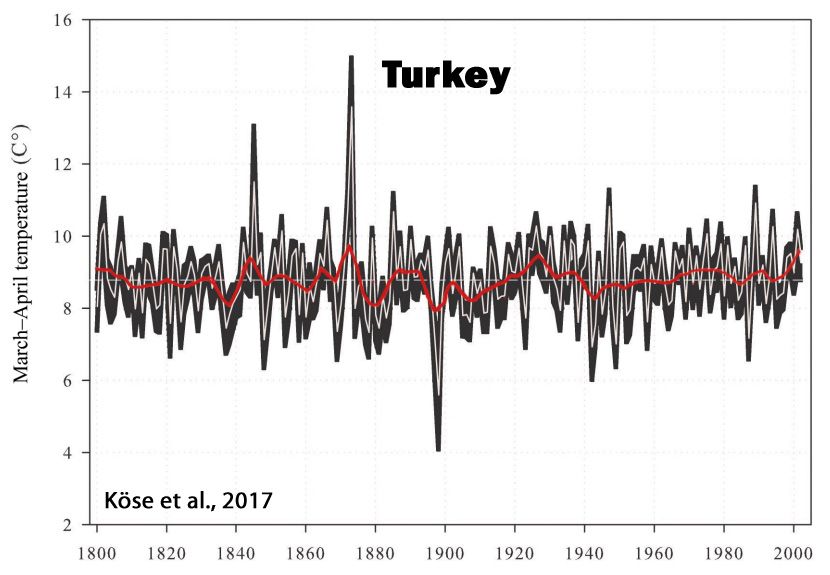
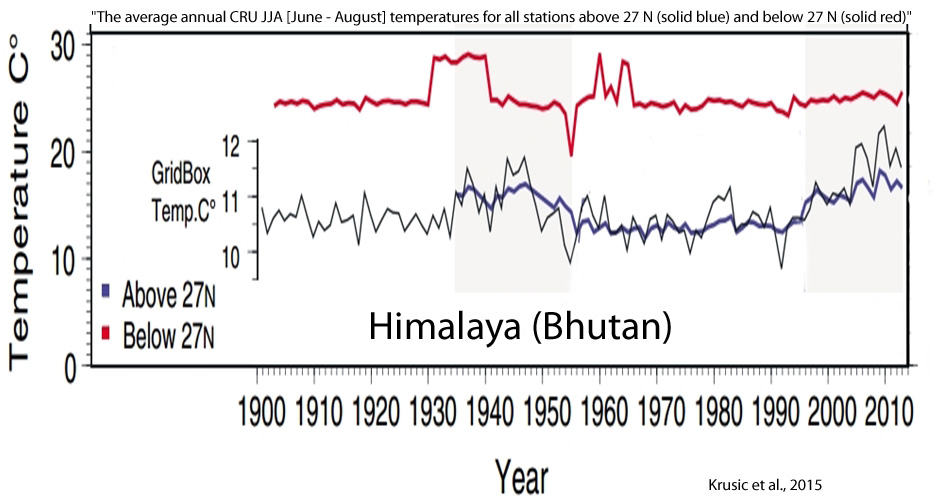
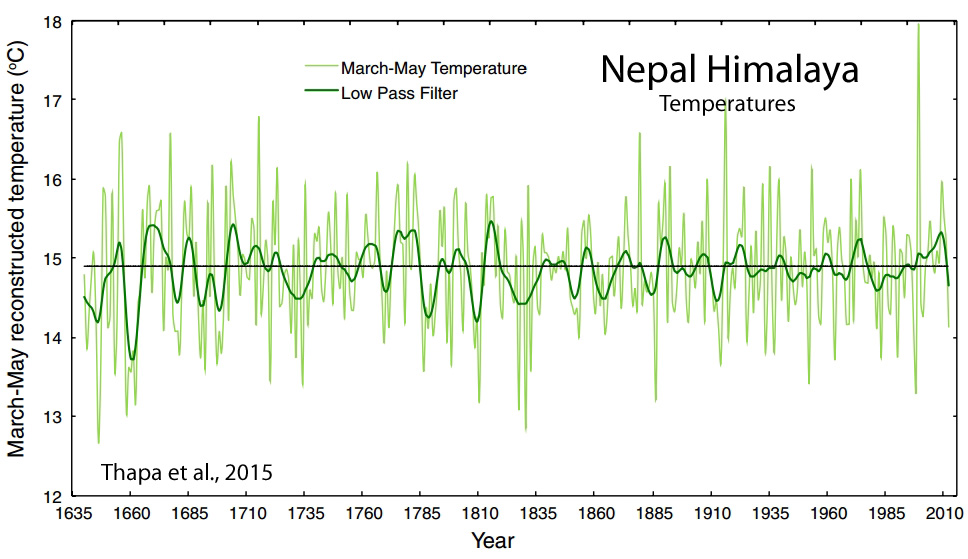
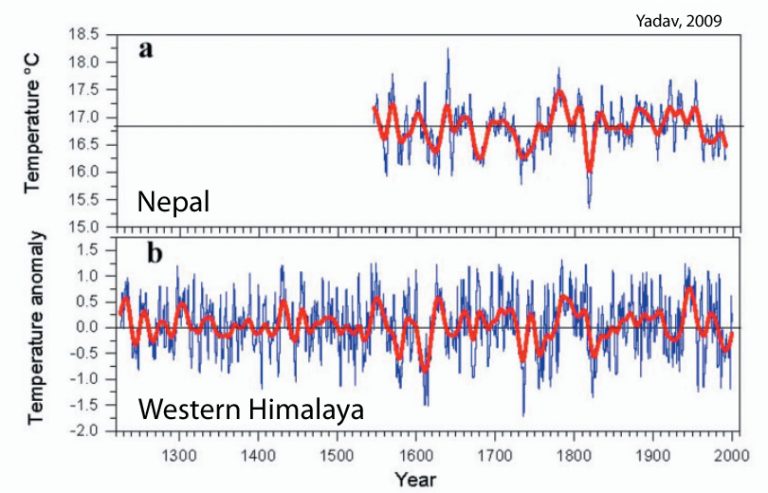
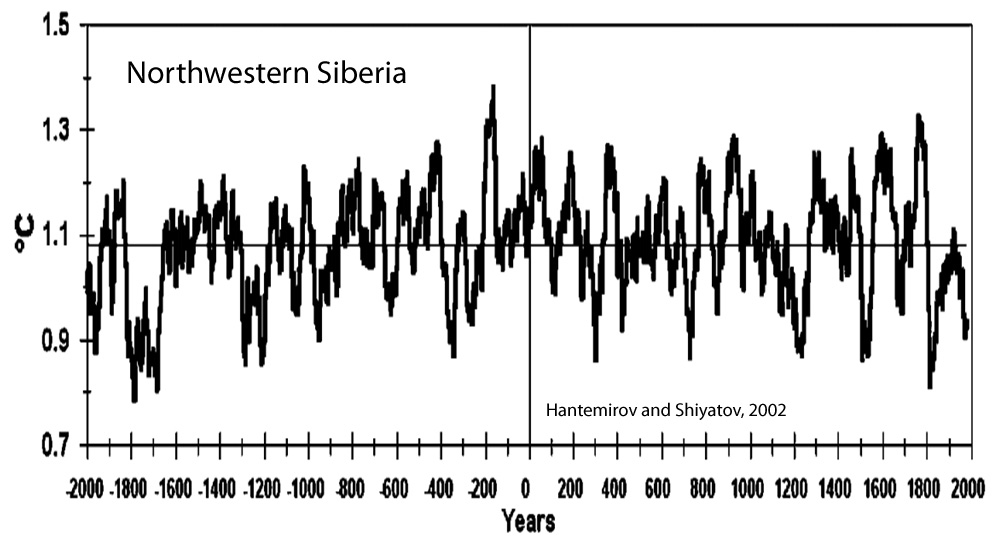
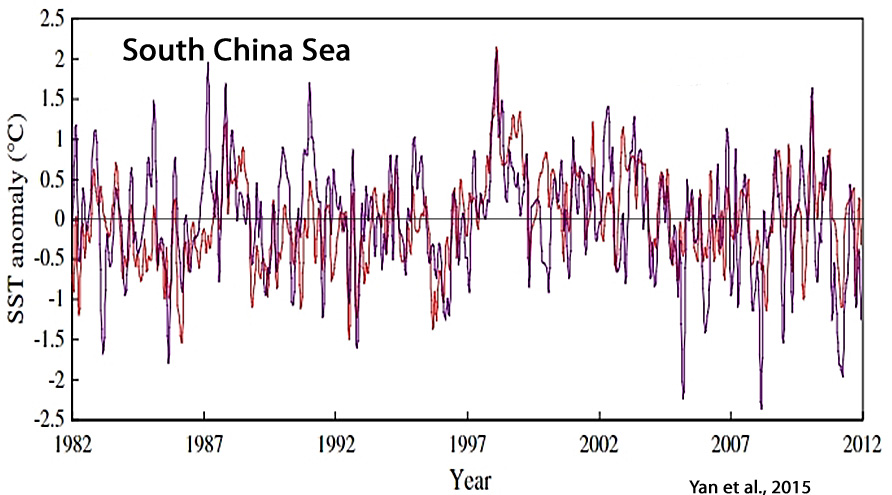
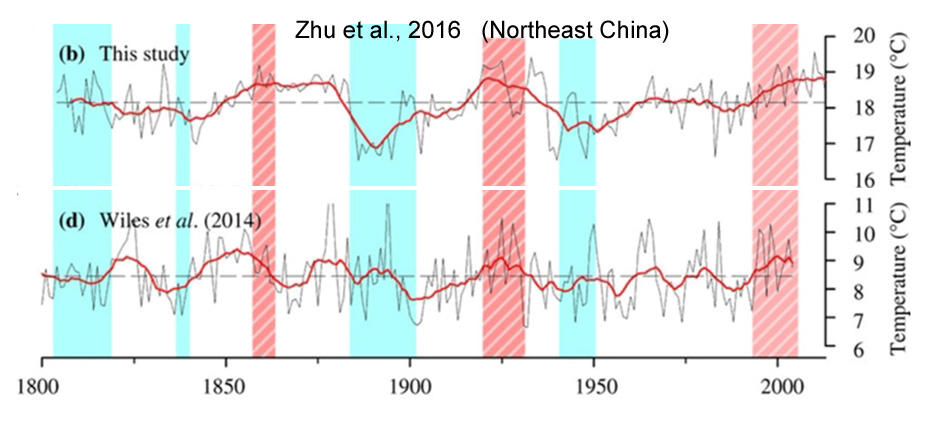
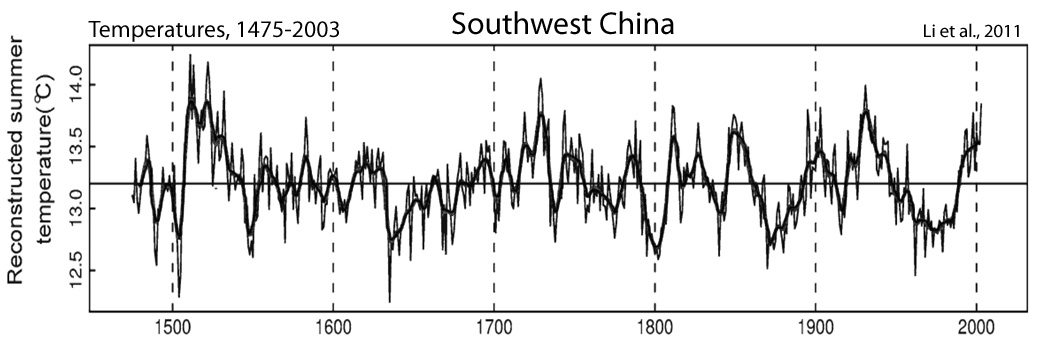
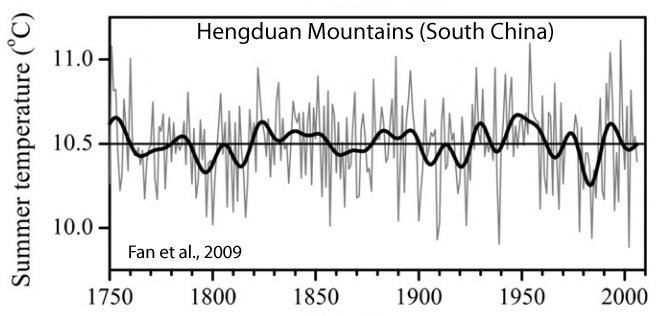
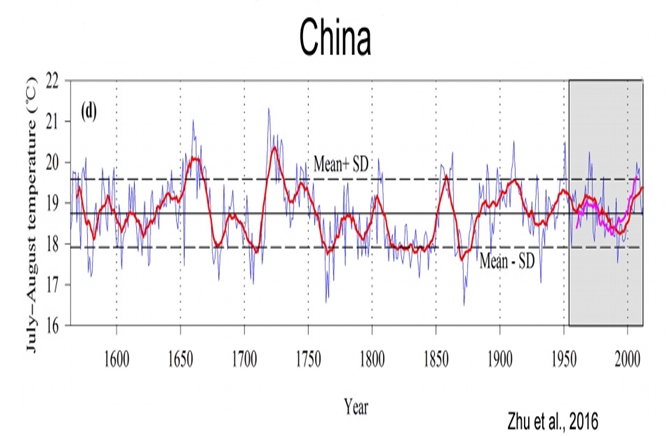
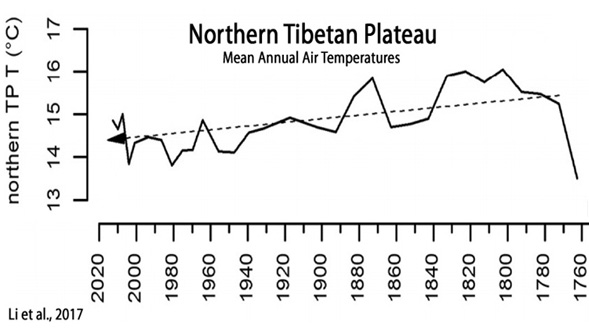
Asia – No Net Warming Since 19th Century
Sunkara and Tiwari, 2016
Zafar et al., 2016
Köse et al., 2017
Krusic et al., 2015
Thapa et al., 2015
“[T]emperature in Central Asia and northern Hemisphere revert back towards cooling trends in the late twentieth century.”
Yadav, 2009
“The decreasing temperature trend in late 20th century is consistent with trends noted in Nepal (Cook et al. 2003), Tibet (Briffa et al. 2001) and Central Asia (Briffa et al. 2001).”
Hantemirov and Shiyatov, 2002
Yan et al., 2015
Zhu et al., 2016
Li et al., 2011
Fan et al., 2009
Zhu et al., 2016
“[W]e should point out that the rapid warming during the 20th century was not especially obvious in our reconstructed RLST [surface temperatures].”
Li et al., 2017
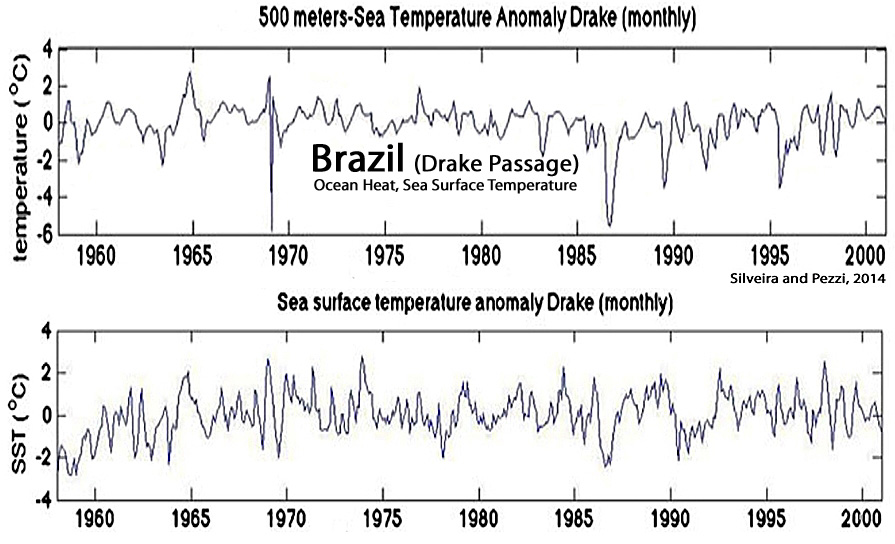
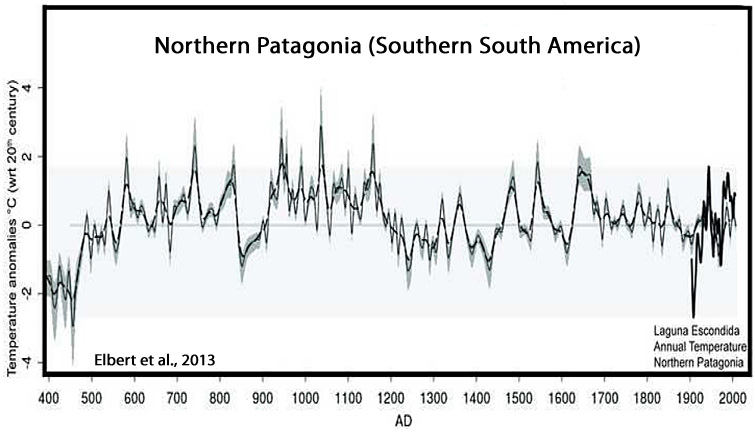
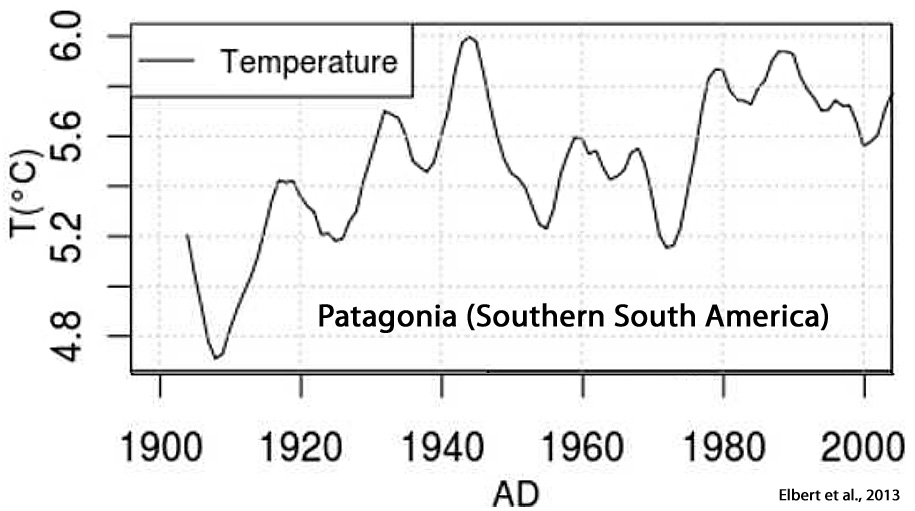
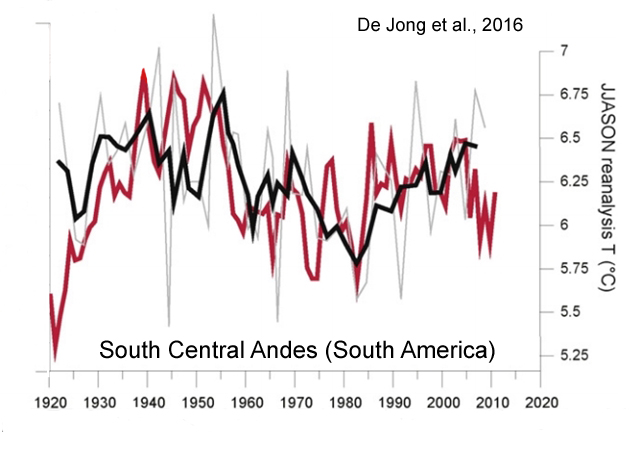
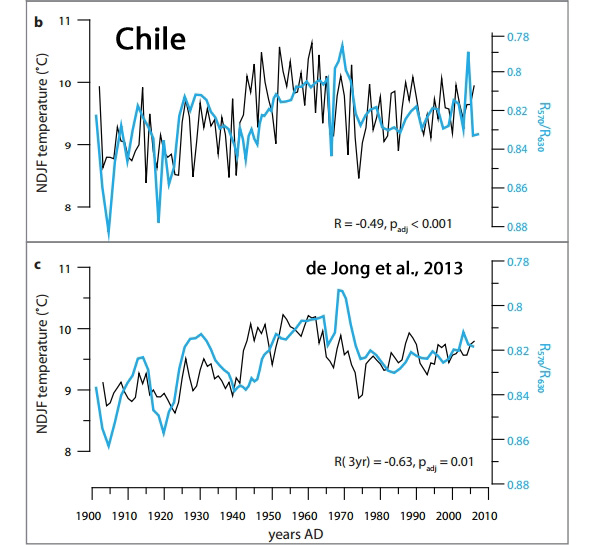
South America – No Net Warming Since Mid-20th Century
Silveira and Pezzi, 2014
Elbert et al., 2013
De Jong et al., 2016
“…the period just before AD 1950 was substantially warmer than more recent decades.”
de Jong et al., 2013
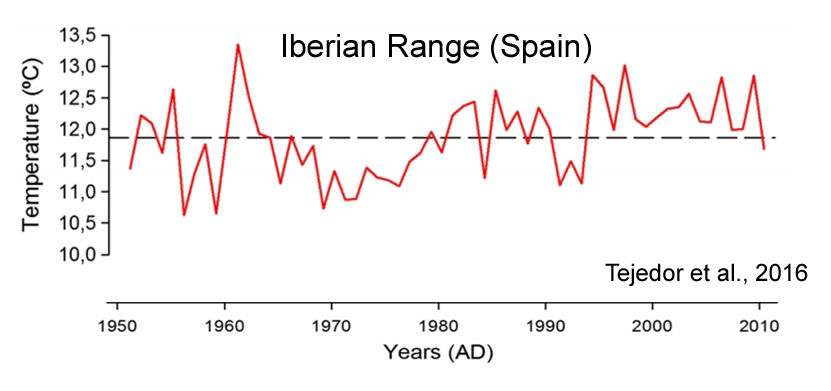
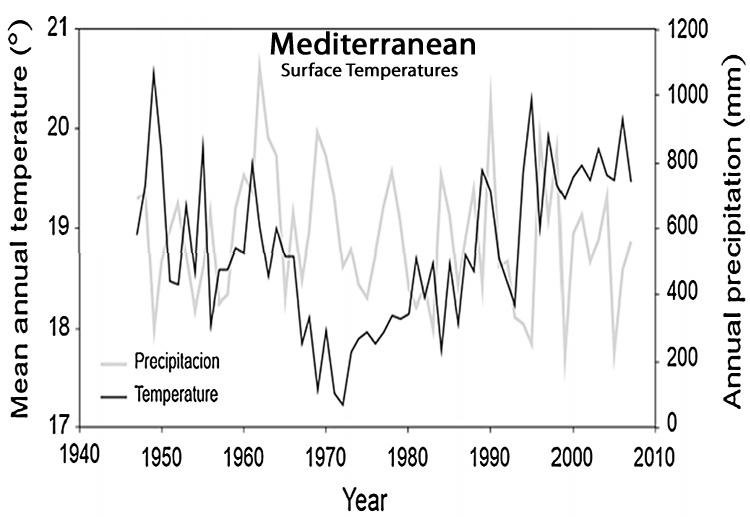
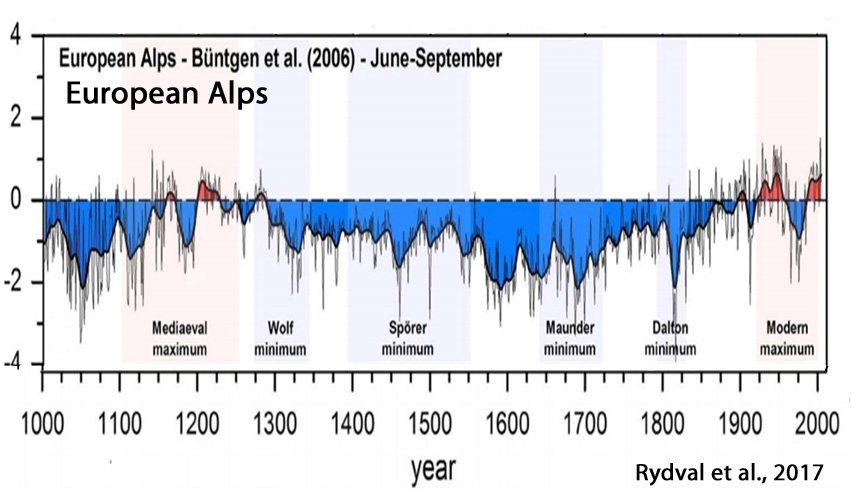
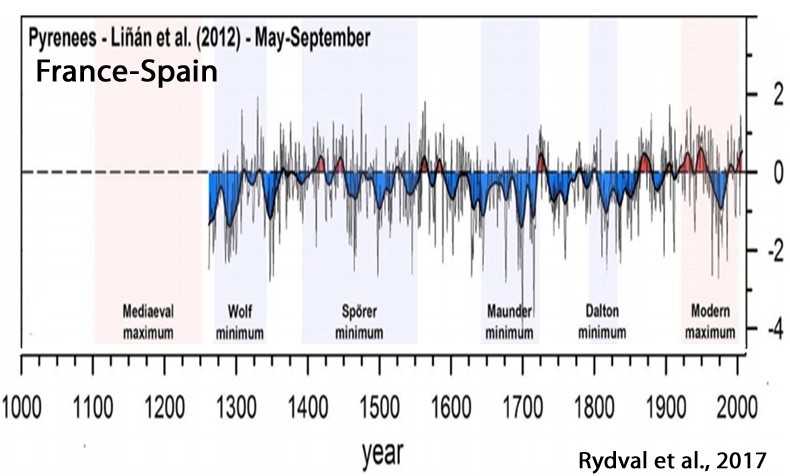
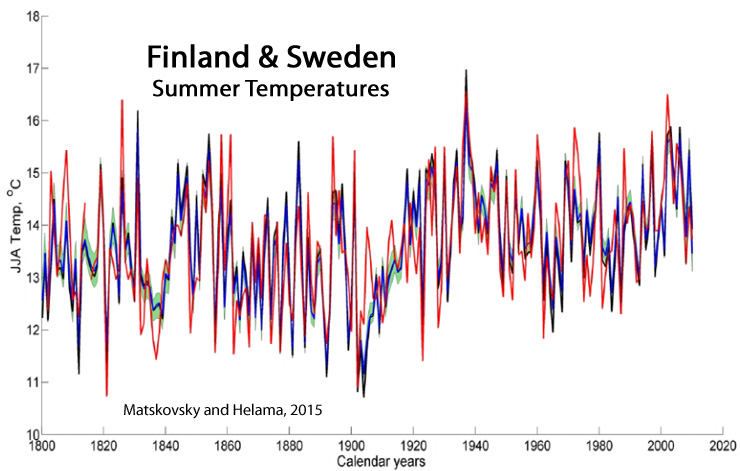
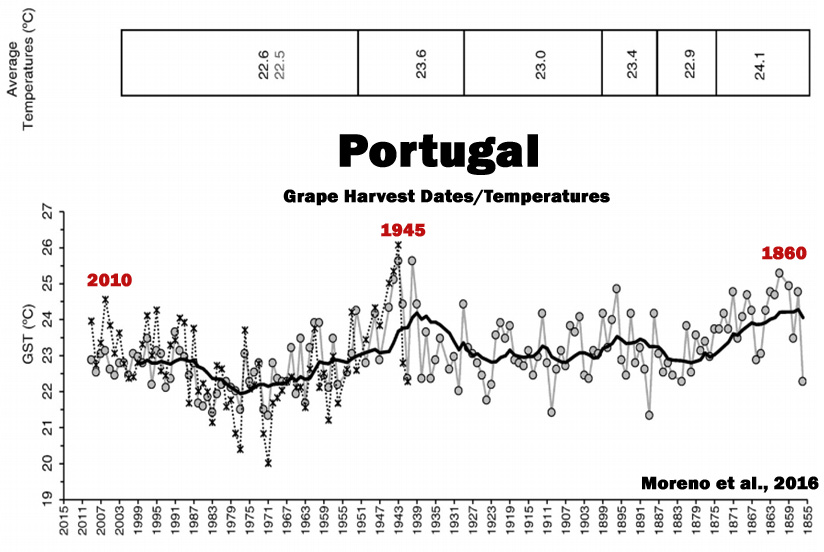
Europe – No Net Warming Since Mid-20th Century
Esper et al., 2014
Tejedor et al., 2016
Büntgen et al., 2017
Zywiec et al., 2017
Rydval et al., 2017
Matskovsky and Helama, 2015
Moreno et al., 2016
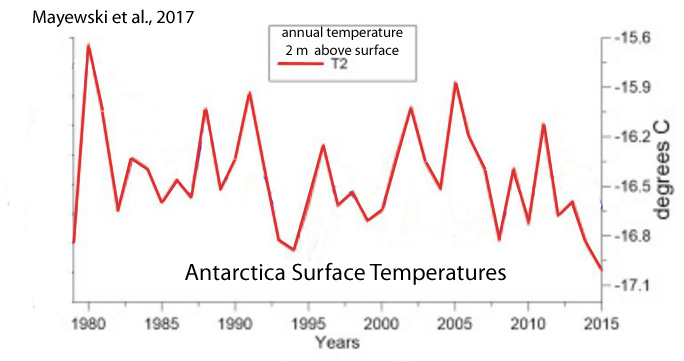
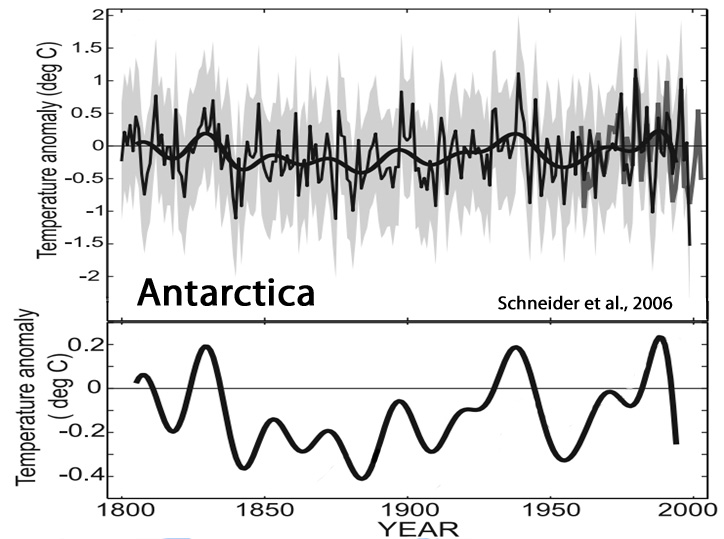
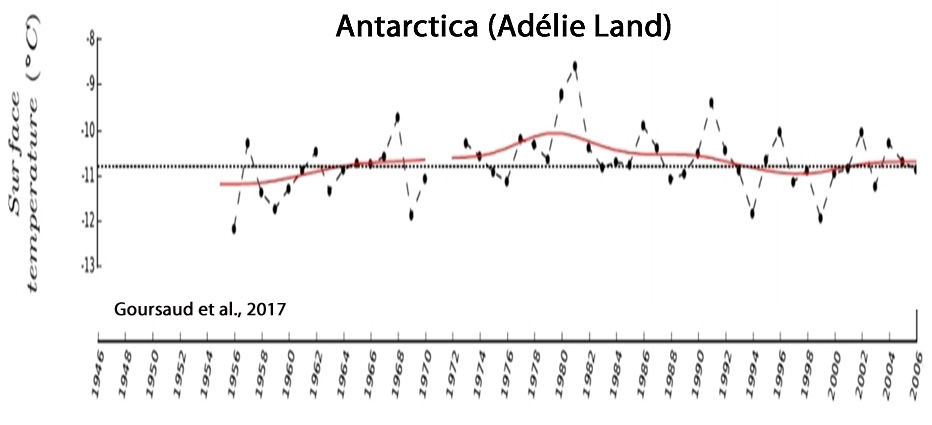
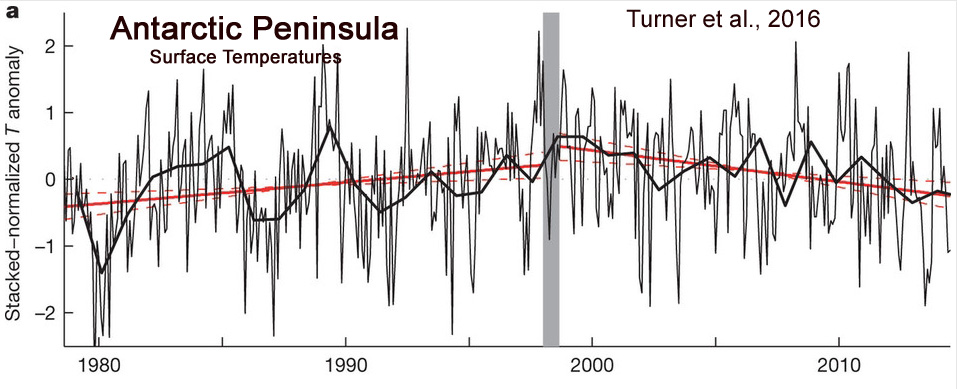
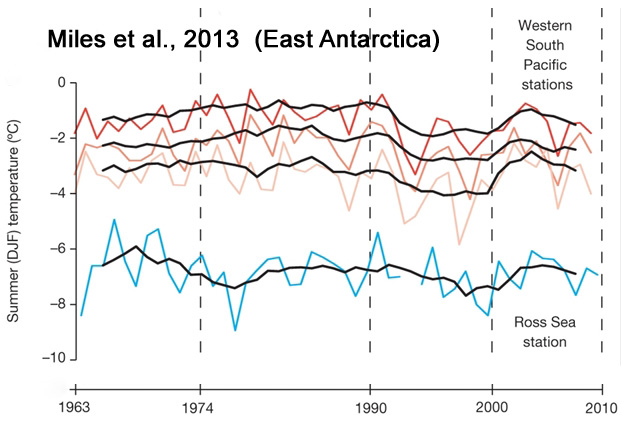
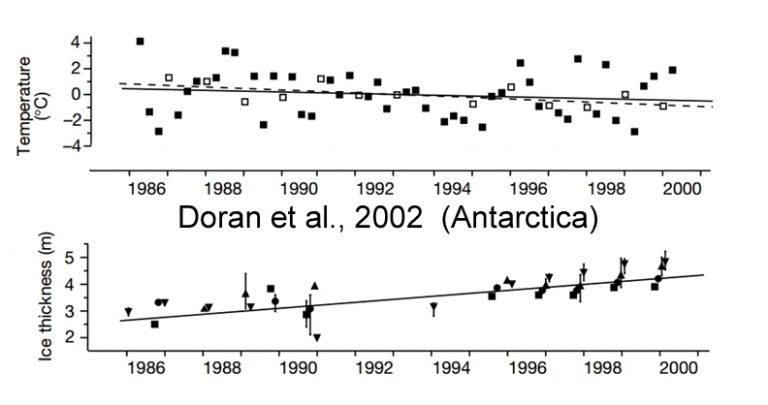
Antarctica – Cooling Since 1960s-1980s
Mayewski et al., 2017
Schneider et al., 2006
Goursaud et al., 2017
Turner et al., 2016
Miles et al., 2013
Doran et al., 2002
“[O]ur spatial analysis of Antarctic meteorological data demonstrates a net cooling on the Antarctic continent between 1966 and 2000, particularly during summer and autumn.”
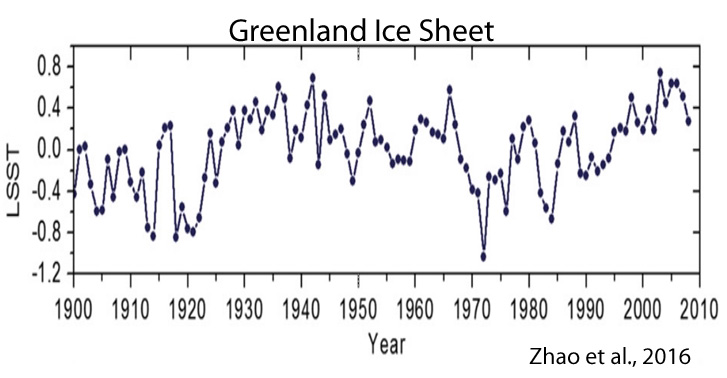
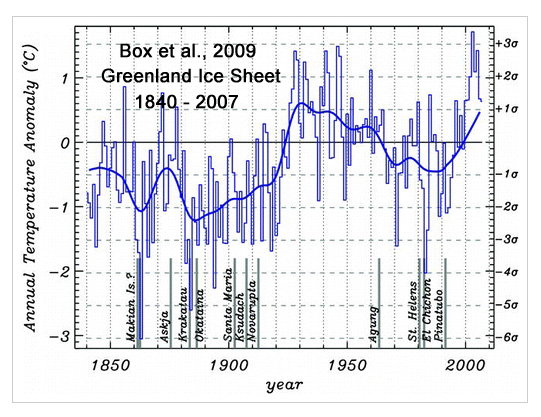
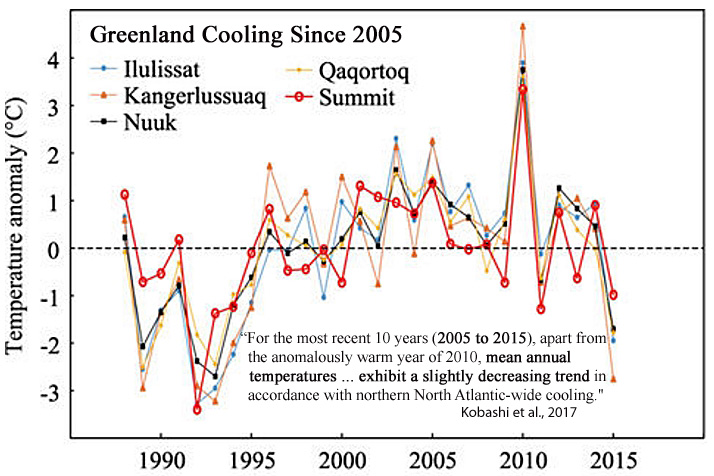
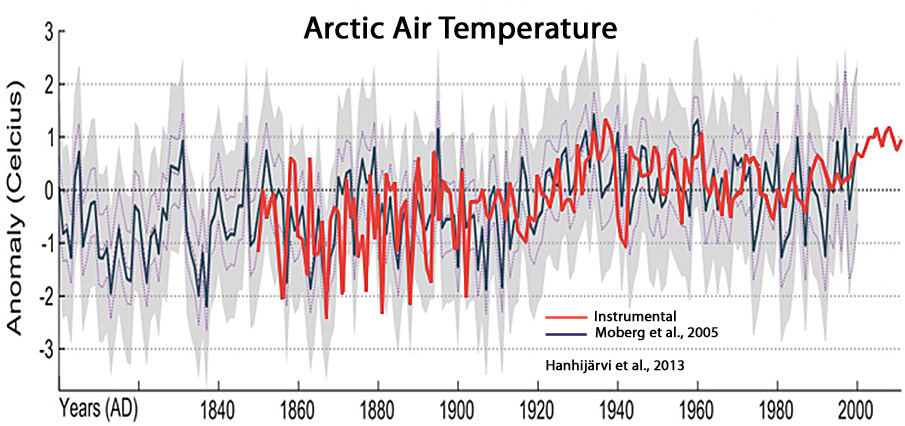
Greenland, Arctic – No Net Warming Since 1930s, Cooling Since 2005
Zhao et al., 2016
Box et al., 2009
“The annual whole ice sheet 1919–32 warming trend is 33% greater in magnitude than the 1994–2007 warming.”
Kobashi et al., 2017
“For the most recent 10 years (2005 to 2015), apart from the anomalously warm year of 2010, mean annual temperatures at the Summit exhibit a slightly decreasing trend in accordance with northern North Atlantic-wide cooling.”
Hanhijärvi et al., 2013
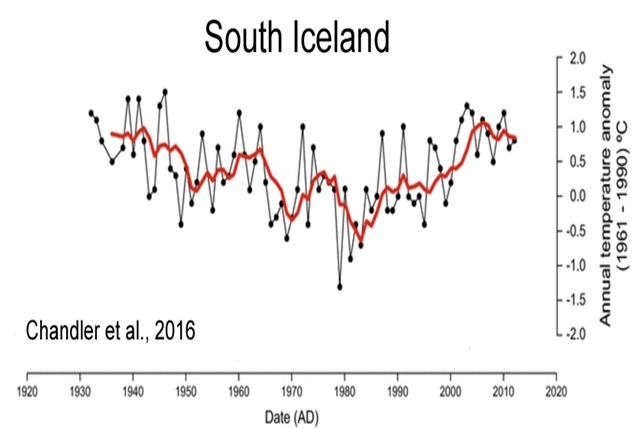
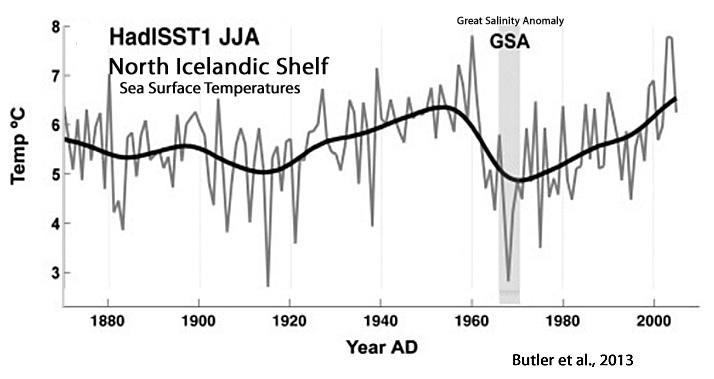
Iceland – No Net Warming Since 1930s-1940s
Chandler et al., 2016
Fernández-Fernández et al., 2017

Butler et al., 2013
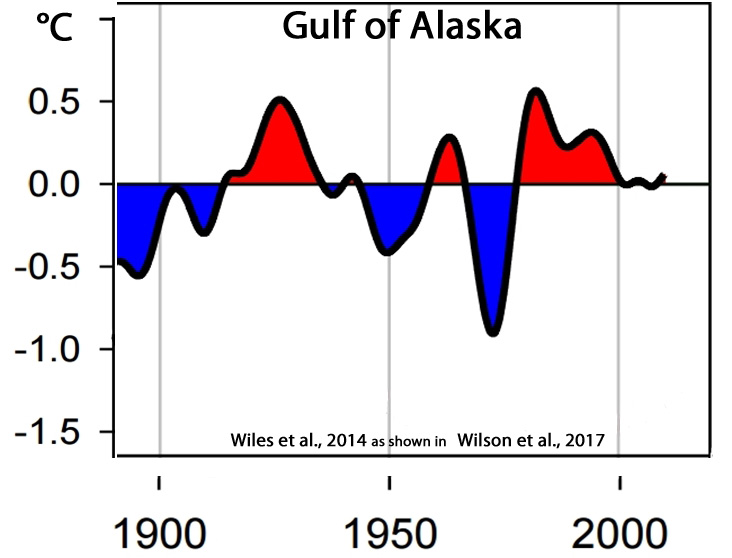
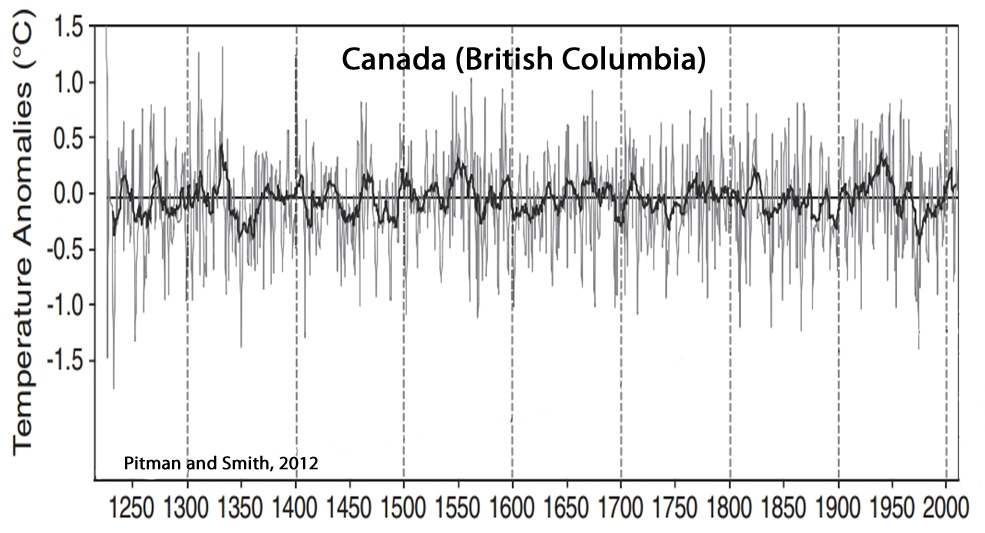
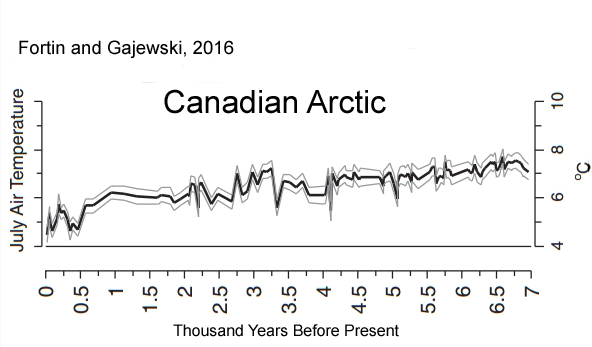
Northern North America – No Net Warming Since 1930s
Wilson et al., 2017
Pitman and Smith, 2012
Fortin and Gajewski, 2016
“…in the last 150 yr, the reconstructed temperatures do not indicate a warming during this time.”
Viau and Gajewski, 2009

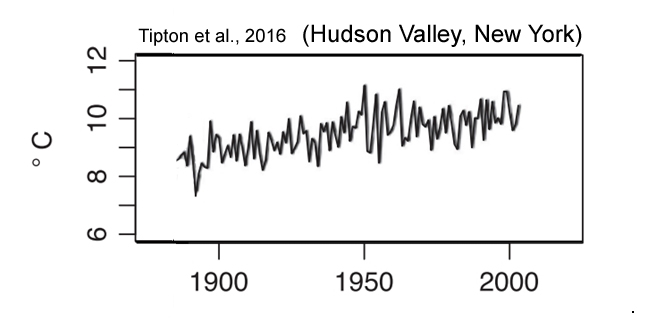
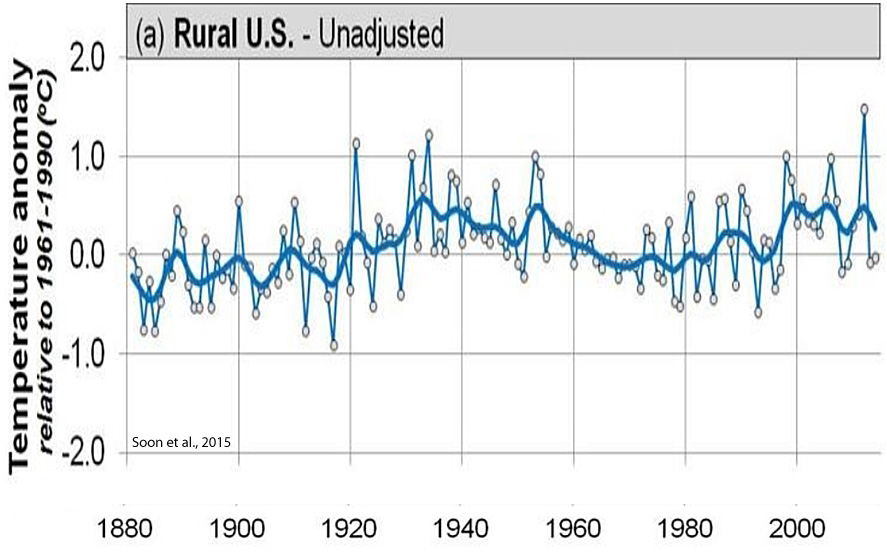
Eastern U.S. – No Net Warming Since Mid-20th Century
Tipton et al., 2016
Ellenburg et al., 2016
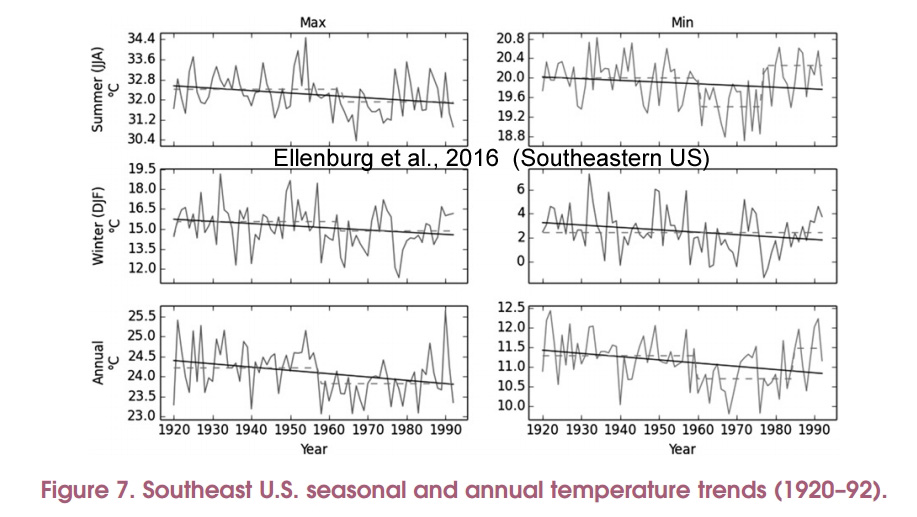
Christy and McNider, 2016

Soon et al., 2015
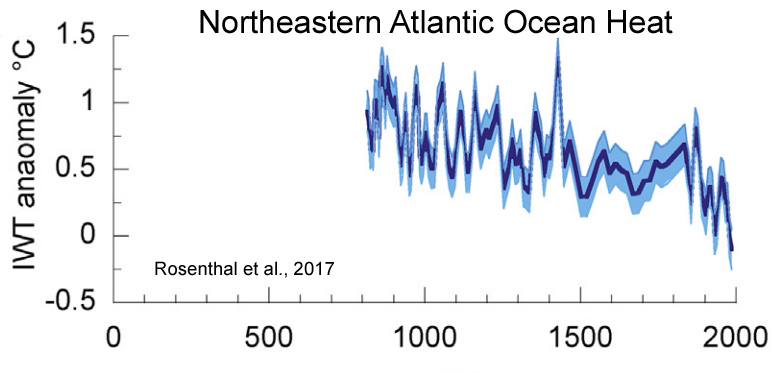
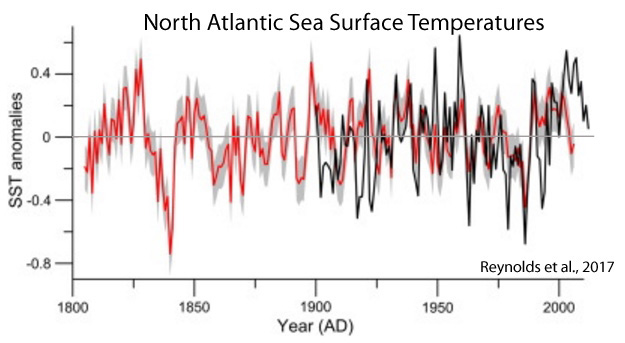
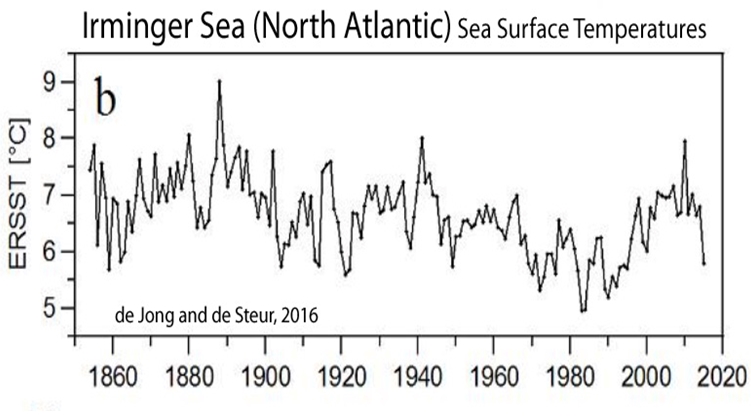
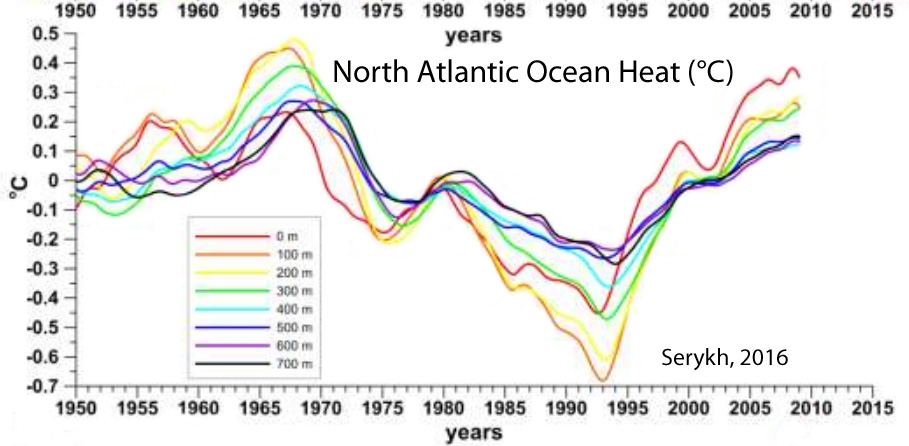
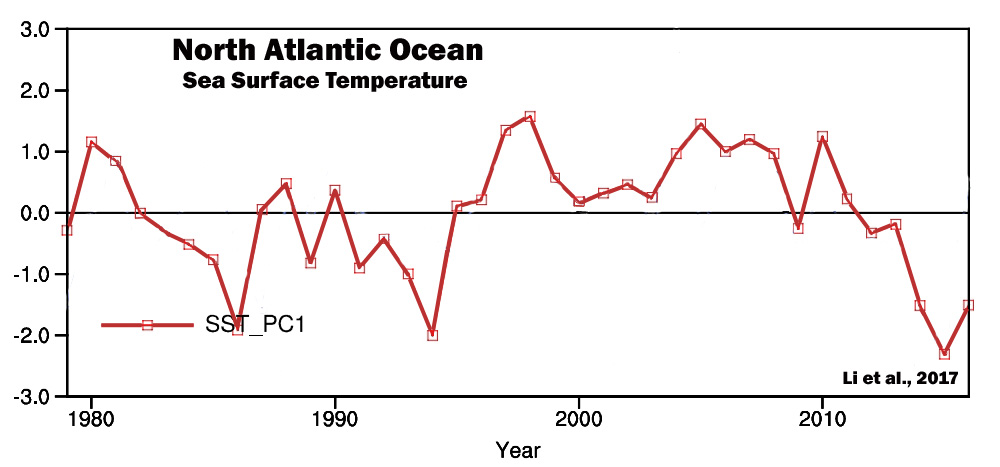
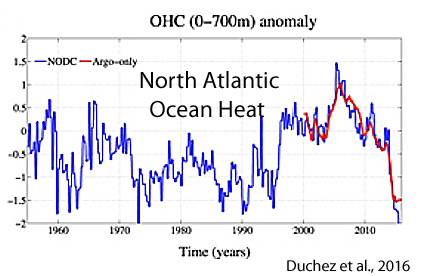
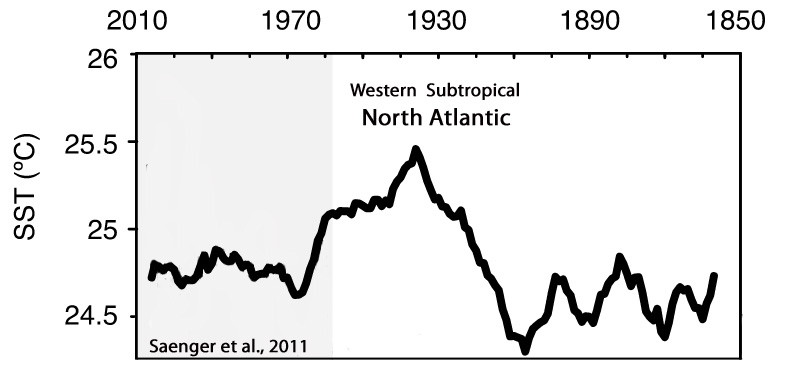
North Atlantic – No Net Warming Since 1800s…Cooling Since 2005
Rosenthal et al., 2017
Reynolds et al., 2017
de Jong and de Steur, 2016
Serykh, 2016
Li et al., 2017
Duchez et al., 2016
“The SST anomaly field for June 2015 shows temperatures up to 2 °C colder than normal over much of the sub-polar gyre with values that are the coldest observed for this month of the year in the period 1948–2015 indicated by stippling.
Saenger et al., 2011
“A prominent feature of this record is the ∼1°C warm anomaly that occurred between 1930 and 1950. …Carolina Slope SST does not exhibit the warming trend seen in the AMO since the 1970s suggesting that other factors also impact SST variability at our site.”
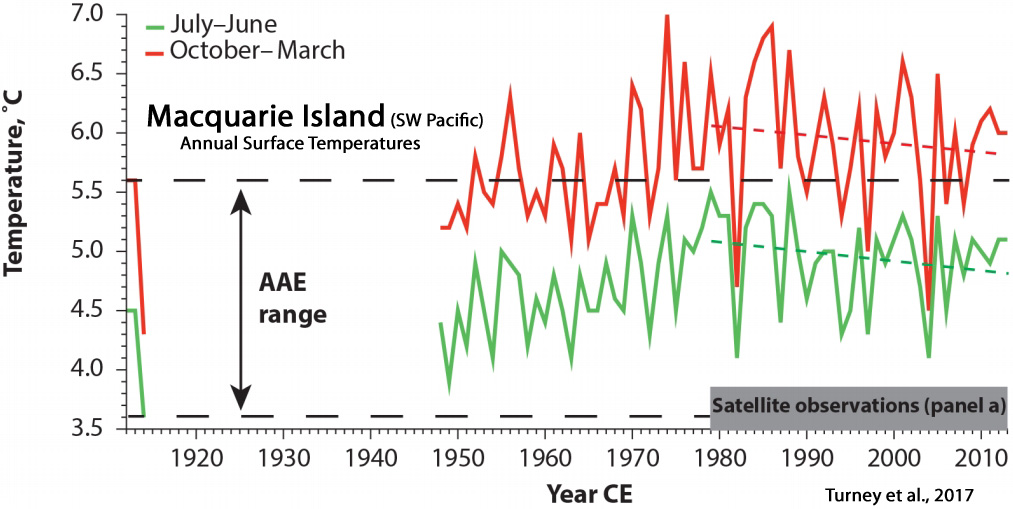
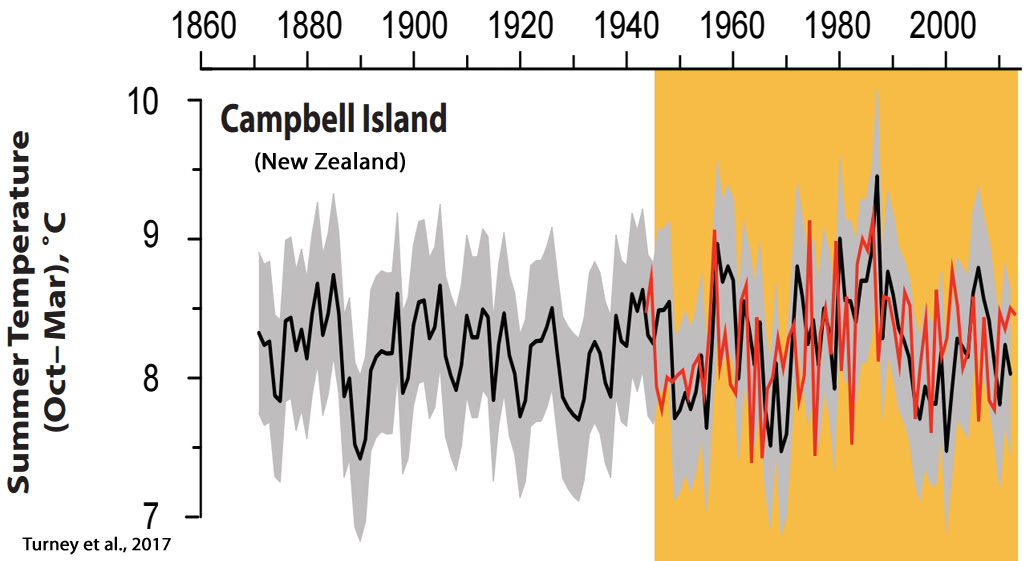
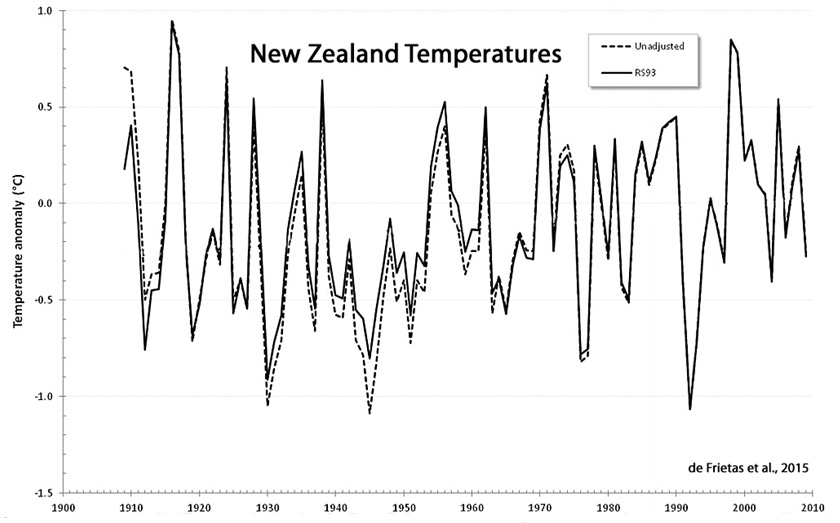
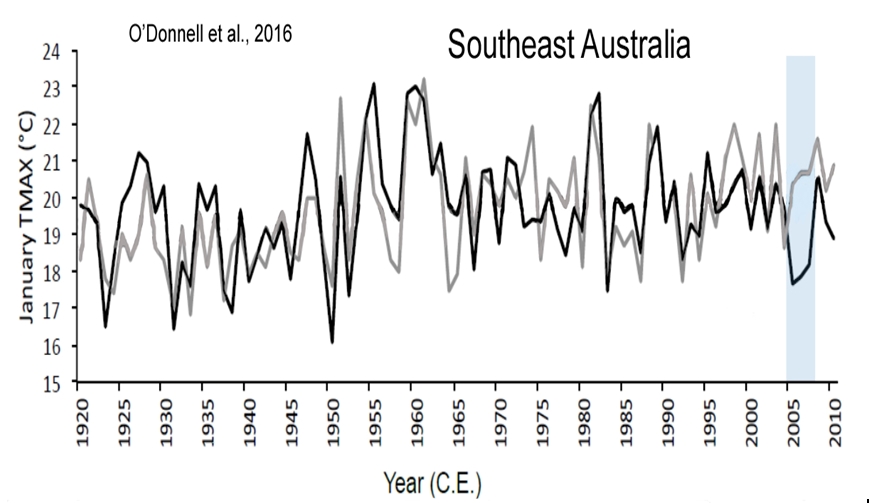
New Zealand, Australia – No Warming Trend Since 1950s
de Frietas et al., 2015
O’Donnell et al., 2016


If – like me – you weren’t sure how ice cores are used to give data on past temperatures and CO2 levels, then here’s a simple explanation:
https://www.scientificamerican.com/article/how-are-past-temperatures/#
Outstanding compilation, Ken. No wonder so many scientists have been sweating lately.
Of note: Most of the “cherry picked” charts and willful misrepresentations of published papers don’t include recent sharp warming.
Most of the world’s glaciers, including Greenland and Antarctica, are melting/shrinking at accelerating rates. The rate of sea level rise has more than quintupled in the last 100 years. There is only one reason why this could be happening – global warming.
World Glacier Monitoring Service (Located in Switzerland)
http://wgms.ch/latest-glacier-mass-balance-data/
NASA Global Climate Change
https://climate.nasa.gov/vital-signs/land-ice/
Sea Level – Columbia University
http://www.columbia.edu/~mhs119/SeaLevel/
Again we see on your part confusion between trend warming and weather caused by ocean cycles. Sorry, but CO2 did not cause the recent two years of warm temperatures. That was caused by the oceans, ENSO cycles. And forget the nonsense that puny CO2 has warmed the vast oceans. Utter silliness. Like I wrote yesterday; blaming puny CO2 is like blaming the Jews for all the world’s ills. It’s stupid, stupid, stupid.
@Bill Butler
“Most of the world’s glaciers, including Greenland and Antarctica, are melting/shrinking at accelerating rates. The rate of sea level rise has more than quintupled in the last 100 years….”
Good!
It means that the world is still coming out of the LIA just as NATURE intends. No CO2 signature in this (or any other effects) just good old NATURE doing what comes NATURALLY, whether humans like it or not.
PS
I note you say most of the world’s glaciers are melting, that’s BAD.
ALL of them should be melting!
Anything other than all are melting is an indication than we’re not quite out of the LIA yet, and on our way to another ‘Goldilocks’ warm period.
Can we assume you prefer the NASA charts with filled-in (made-up) temperatures, then? https://notrickszone.com/2017/02/13/more-data-manipulation-by-noaa-nasa-hadcrut-cooling-the-past-warming-the-present/
Actually, glaciers melted more rapidly and contributed more to sea level rise during the 1920-1950 period than in recent decades.
https://notrickszone.com/wp-content/uploads/2017/04/Holocene-Cooling-Glacier-Melt-Contribution-Sea-Level-Gregory-2013.jpg
Sea levels have risen at a rate of about 1.7 mm/yr (7 inches per century) since 1900, with no significant acceleration.
–
http://onlinelibrary.wiley.com/doi/10.1002/2014JC009900/abstract
“Global mean sea level change since 1900 is found to be 1.77 ± 0.38 mm year on average. [T]he acceleration found for the global mean, +0.0042 ± 0.0092 mm year, is not significant”
–
http://tidesandcurrents.noaa.gov/sltrends/globalregional.htm
“…the absolute global sea level rise is believed to be 1.7-1.8 millimeters/year.”
–
And as is commonly known, sea levels rose at rates about 30 times faster than today (multiple meters per century) earlier in the Holocene, and global sea levels were about 1 to 2 meters higher than they are now about 4,000 to 6,000 years ago.
https://notrickszone.com/2017/05/08/10-new-papers-sea-levels-1-6-meters-higher-4000-6000-years-ago/
.
@Kenneth Richard
You may (or may not) be interested in this —
A global multiproxy database for temperature reconstructions of the Common Era
by the PAGES2k Consortium
The webpage https://www.nature.com/articles/sdata201788 contains links to the paper and all Supplementary Tables and spreadsheets.
I find it interesting in not only what is included but also what is left out.
https://climateaudit.org/2017/07/11/pages2017-new-cherry-pie/amp/
Summary…
The PAGES2k people toss out proxy evidence that doesn’t fit their presuppositions (“negative relation to temperature” = a warmer past), and they retain evidence that does fit their presuppositions. When we selectively toss out data that we don’t like or that doesn’t fit our presuppositions, we get the reconstruction shape we want (i.e., hockey sticks).
Indeed Kenneth, that was my immediate feelings about this.
It reads and looks exactly like a project designed to confirm what has been said by those who follow the bias. I.E. a project which is, by design, confirming the bias in the reviewed papers.
@Bill Butler:
Either you have been duped by Warmist propaganda, or you are a purveyor of such drivel. In addition to the clear observation by Gregory, White, Church et al. which I mentioned below, here is a summary of glacial activity in Switzerland over the past century and a bit:
http://glaciology.ethz.ch/messnetz/lengthvariation.html
Anyone with half an open mind will conclude that Swiss glaciers grew between 1900 and 1920 as well as between 1950 and 1980, despite human CO2 emissions growing over the entire period, particularly post 1950, when human CO2 emissions began increasing at so-called “alarming rates”:
https://www.epa.gov/ghgemissions/global-greenhouse-gas-emissions-data
Swiss glaciers seem to be closely linked to the AMO.
https://s19.postimg.org/xxtc8onhv/swiss_glaciers.png
AndyG55,
Yes, I would agree with the correlation to AMO, with a lag.
Glacial growth would appear to lag significant mid- to long-term temperature decline by about a decade. Likewise, glacial recession would appear to lag significant mid- to long-term temperature rise by about a decade.
Bill Butler appears to be a ‘rant and run’ troll.
“recent sharp warming”
When would that be, Billy-boy?
Out of the LIA, the coldest period in 10,000 years ???
Be very thankful for that small amount of warming !!!
How about I give you a piece of info not mentioned here, and you respond?
This comes from the Bible (which I am sure you know nothing about, as it is from God and not these evil atheist government shill “scientists”…)
I quote from Genesis 8:22, “while the earth remaineth, seed time and harvest, and cold and heat, and summer and winter, and day and night shall not cease.”
You cannot argue with, nor disprove, the Creator of the universe. You may not believe in God, nor the Bible, but you would be in error in doing so. I believe that verse was written for this exact time in history, because everything “normal” is under attack these days. Global warming is a sham, and has been proven to be many times over. Anyone that wants to believe otherwise is merely brainwashed by the propaganda machine…..
Perhaps this is why sea level experts such as Gregory, White and Church had the following to say just a few years ago (submitted in 2012, published in 2013):
“The reconstructions account for the observation that the rate of GMSLR was not much larger during the last 50 years than during the twentieth century as a whole, despite the increasing anthropogenic forcing. Semiempirical methods for projecting GMSLR depend on the existence of a relationship between global climate change and the rate of GMSLR, but the implication of the authors’ closure of the budget is that such a relationship is weak or absent during the twentieth century.”
http://journals.ametsoc.org/doi/abs/10.1175/JCLI-D-12-00319.1
[…] Read more at No Tricks Zone […]
So, in English for the non-scientists, there is no credible evidence of warming due to man-made CO2 emissions.
None, NADA… ZIP !!!!!
Kenneth – more excellent compilations. A possible typo. In your top paragraph you quote Turney et al 2017 saying the southern ocean is 14% of the earth, whereas in the 3rd paragraph you say the Indian Ocean is 14% of the earth. What is the definition of southern ocean? I’ve seen other estimates put “southern ocean” as 4%, but that is given as different to Pacific (30.5%), Atlantic (20.8%) and Indian (14.4%) oceans. Given 71% of the planet is ocean, southern hemisphere ocean is likely near 40%.
Thanks Keith. I was quoting from the abstract (and introduction) of Turney et al. (2017) for the 14% figure (Southern Ocean). The Southern Ocean for these authors includes the South Pacific, which is not consistently demarcated from one accounting to the next.
“Occupying about 14% of the world’s surface, the Southern Ocean plays a fundamental role in ocean and atmosphere circulation, carbon cycling and Antarctic ice-sheet dynamics.”
I estimated from Belda et al 2014 that 8% of cells in their study had changed climate category. Mostly desert, steppe and savanna had become wetter.
Then the Climate Research Unit at the UEA revised the precipitation dataset to correct “wet bias” that affected possibly half of the changed zones.
(I do not know if Belda et al have recalculated.)
So yes there has been a little warming. But climate change?
Belda M, Holtanová E, Halenka T, Kalvová J (2014) Climate classification revisited: from Köppen to Trewartha. Clim Res 59:1-13. https://doi.org/10.3354/cr01204
@Kenneth Richard: Many thanks for the wonderful presentation of such diverse sources – this work should become a basis for all interested is our world and history.
I see the imbedded references to “Minimums”, but I don’t see a direct overlay of SSN to any of the mega-regional temp data sets presented. (SSN= Smoothed Sunspot Numbers) From memory alone, not always reliable at my age, I can note close/reasonable correlation with “some regions”; but, also note deviations when comparing “deep continental data locations” vs more “maritime/shore/near shore” locations. The presence of “oscillations” just prior (or, leading) these minimums in these temp data sets give cause for attention being paid to our most recent records. I, personally, see great interest focused on the coming 2025-2038 window approaching. Food production follows temp’s and we have a full magnitude increase in mouths to feed this time around. Check-6.
An extensive and interesting collection of graphs and data. I suspect that if you took a look at temperature readings in large and enlarging urban areas over the last 100-150 years, you will see a warming trend to these areas. Removing plants and covering a large area with heat retaining asphalt, concrete, dark roofs should show a warming trend. The majority of urban areas cover previously forest or agricultural land. Add deforestation and failure to replant large areas of trees (CO2 absorbed, O2 generated), and I would expect certain areas to be warmer and drier.
The trend is your friend. Long term trend is DOWN. Looks like the reversal was YEARS ago.
Yes, long-term, it’s difficult to tell that there has been a difference at all. For example:
https://notrickszone.com/wp-content/uploads/2016/10/Holocene-Cooling-Global-Temps-1940-1970-2000-Gerhard-04-copy.jpg
[…] are being attacked every day’: violence at small town festival reignites migration debate Scientists Find At Least 75% Of The Earth Has Not Warmed In Recent Decades US ‘to ban Americans from travelling to North Korea’ | Daily Mail Online Plot to […]
[…] NoTricksZone, Kenneth Richard on 20. July 2017 : The ‘Real Proxy’ Temperature Record Hints Near-Global Cooling Has Begun Scientists Find At Least 75% Of The Earth Has Not Warmed In Recent Decades […]