Global Temperature Data Manipulation
Thousands Of Non-Urban Thermometers Removed
0.3°C Of Pause-Busting Warmth Added Since 1998
0.5°C Of Warming Removed From 1880-1950 Trend
Over the course of the last few decades, overseers of the 3 main 19th century-to-present global temperature data sets — NOAA, NASA, and HadCRUT — have been successfully transforming the temperature record to the shape dictated by climate models. Namely, there has been a concerted effort to cool down the past — especially the 1920s to 1940s warm period — and to warm up the more recent decades, especially after about 1950. In this way, a trend of steep linear warming emerges that looks similar to the linear shape of anthropogenic CO2 emissions for the 20th and 21st centuries. A better fit between anthropogenic CO2 emissions and surface temperature helps to imply causation, and this ostensible correlation-turned-causation can then be used to justify policy decisions aimed at eliminating fossil fuel energies.
75% Of GHCN Temperature Stations Removed Since 1970s
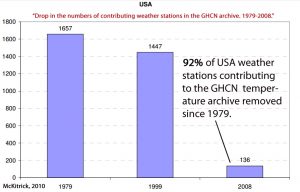
One of the most unheralded means by which this temperature “shaping” occurs has been the tendentious and wholesale removal of thousands of weather station land thermometers from remote, high altitude, and/or non-urban locations since the 1970s. These are stations which do not show the warming trends predicted by models, as they are not affected by proximity to artificial or non-climatic heat sources (pavements, buildings, machinery, industry, etc.) like urban weather stations are. (As detailed below, locating thermometers near urban heat sources can cause warming biases of between 0.1 and 0.4°C per decade.)
If a highly disproportionate number of non-urban weather stations are removed from the global temperature archive, the urban-based thermometers will be weighted much more heavily than they were before the non-urban stations were removed. And therefore, the temperature record will show (much) more warming — even though the additional warmth is not climatic, but artificial.
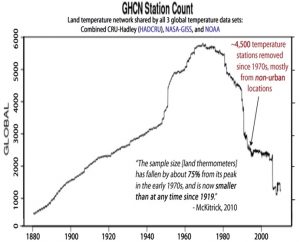
And this is exactly what has happened. The Global Historical Climatology Network, or GHCN, is the primary source for temperature data records from all over the world. NOAA, NASA, and HadCRUT heavily rely on GHCN for temperature histories in constructing their global data sets dating back to the 1800s. According to McKitrick (2010), there were still between 5,000 and 6,000 weather stations across the globe contributing to the GHCN temperature archive as recently as the 1970s. Today (or as of 2009), there are only a little over 1,000 left — 75% of the thermometers used in the 1970s have disappeared. There are now fewer weather stations contributing to the GHCN than there were in 1919.
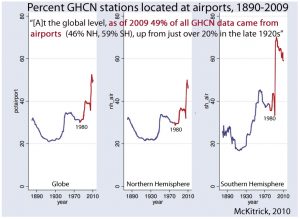
Astonishingly, as many as half (49% as of 2009) of the weather stations across the globe used by the GHCN are now located on the grounds of airports.
McKitrick, 2010
“There are three main global temperature histories: the combined CRU-Hadley record (HADCRU), the NASA-GISS (GISTEMP) record, and the NOAA record. All three global averages depend on the same underlying land data archive, the Global Historical Climatology Network (GHCN). Because of this reliance on GHCN, its quality deficiencies will constrain the quality of all derived products.”
“The number of weather stations providing data to GHCN plunged in 1990 and again in 2005. The sample size has fallen by over 75% from its peak in the early 1970s, and is now smaller than at any time since 1919.”
Growing bias toward airport sources
“The collapse in sample size has increased the relative fraction of data coming from airports to about 50 percent (up from about 30 percent in the 1970s). … The change in the sample was not uniform with respect to source type. For instance it has biased the sample towards airport locations. GHCN had already been heavily-weighted towards airports, which, for many reasons, are not suitable for climatic monitoring. A problem with airports is that they are often in urban or suburban locations that have been built up in the past few decades, and the increase in global air travel has led to increased traffic, pavement, buildings and waste heat, all of which are difficult to remove from the temperature record. … [A]t the global level, as of 2009 49% of all GHCN data came from airports (46% NH, 59% SH), up from just over 20 percent in the late 1920s.” — McKitrick, 2010
NOAA’s Tom Karl Was Once Concerned About Urban/Airport Warm Bias
During the late 1980s, the warm bias of 0.1°C to 0.4°C per decade attributed to the urban (or airport) siting of temperature stations was thought to severely compromise the global temperature data sets, with “a substantial portion of the overall trend of global and regional temperatures” directly reflecting this warm bias. The “artificial warming in the primary station network” never went away. But it is now just ignored.
Karl and Quayle, 1988
“Karl et al., 1988) has shown that at some ‘sun belt’ cities in the West, the rise of temperature that can be attributed to the urban heat island is as much as 0.3 to 0.4°C per decade. In the East, the rise is over 0.1°C per decade. … The artificial warming in the primary station network, relative to the climate division data, is nearly 0.17°C over the past 34 years [since ~1950]. Such trends are at least as large as any of the observed trends over the United States (Karl, 1988) or the globe (Jones and Wigley, 1987).”
Karl and Jones, 1989
“Results indicate that in the United States the two global land-based temperature data sets have an urban bias between +0.1°C and +0.4°C over the twentieth century (1901-84). … At present, only rough estimates of the potential impacts of urbanization can be given. This includes an urban bias in the Hansen and Lebedeff (1987) [NASA] data over the United States between 0.3°C and 0.4°C over the 20th century, which is larger than the overall trend in the United States over this period. … To our knowledge, the United States is the only large area of the globe where the magnitude of this bias has been thoroughly studied.”
“The magnitude of this urban bias in two global, land-based data sets was found to be a substantial portion of the overall trend of global and regional temperatures.”
Kukla, Gavin, and Karl, 1986
“Meteorological stations located in an urban environment in North America warmed between 1941 and 1980, compared to the countryside [cooling], at an average rate of about 0.12°C per decade. Secular trends of surface air temperature computed predominantly from [urban] station data are likely to have a serious warm bias. … [W]e compared trends of the 34 urban/rural station pairs…urban stations show a warming with respect to the countryside throughout most of the year.
The average annual difference of the trends is about +0.11°C per decade [of non-climatic warming due to urban location]. … The average difference between trends [urban siting vs. rural] amounts to an annual warming rate of 0.34°C/decade. … The reason why the warming rate in subset D is considerably higher [may be] that the rate may have increased after the 1950s, commensurate with the large recent growth in and around airports. … Our results and those of others show that the urban growth inhomogeneity is serious and must be taken into account when assessing the reliability of temperature records.”
Growing bias toward lowland sites
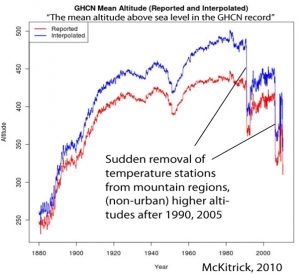
“The steady increase [in the mean altitude of temperature stations above sea level until the 1980s] is consistent with a move inland of the network coverage, and also increased sampling in mountainous locations. The sample collapse in 1990 is clearly visible as a drop not only in numbers but also in altitude, implying the remote high-altitude sites tended to be lost in favour of sites in valley and coastal [urban] locations. This happened a second time in 2005. Since low-altitude sites tend to be more influenced by agriculture, urbanization and other land surface modification, the failure to maintain consistent altitude of the sample detracts from its statistical continuity. … GHCN has progressively lost more and more high latitude sites (e.g. towards the poles) in favour of lower-latitude sites. Other things being equal, this implies less and less data are drawn from remote, cold regions and more from inhabited, warmer regions.” — McKitrick, 2010
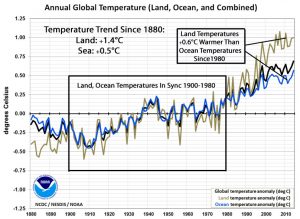
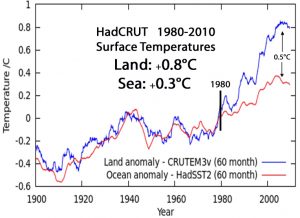
The Results: Artificial Land Warming Since 1980
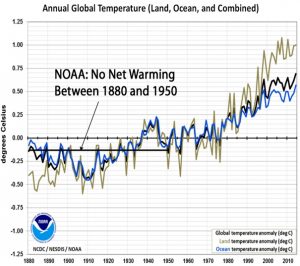
NOAA Global Land vs. Sea
HadCRUT Land vs. Ocean Temperature Anomalies
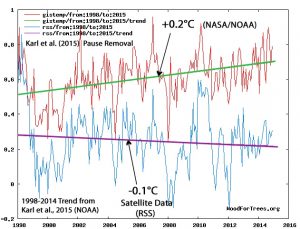
NOAA Adds +0.3°C Of Warming (Relative To Satellites) Since 1998
Earlier this month, the Karl et al. (2015) “pause-buster” paper was once again subjected to significant criticism by another former NOAA scientist (Tom Karl was NOAA’s Director during 2015) due to allegations there were political motivations to rush the paper to press before the (December) 2015 Paris Climate Change Conference without requisite quality checks. The motivation was obvious: If the inconvenient pause in global warming reported by the IPCC in 2013 could be eliminated, it would be a significant development that might encourage government leaders to pledge to reduce CO2 emissions. Unfortunately, the original temperature data used to compute the new trend (“For 1998–2014, our new global trend is 0.106± 0.058°C dec−1“) in the NOAA publication has been “lost” on a faulty computer that had undergone a “complete failure,” leaving little chance for independent replication or verification.
Since then, the New York Times has issued a defense of the NOAA controversy by claiming that the 1998-2014 trend used in the Karl et al. (2015) paper has been independently verified by other scientists, as well as by satellite data, to show that the +0.11°C per decade trend (+0.2°C overall) between 1998-2014 was consistent across all data sets.
This claim is false, of course. Using the raw data available and the WoodForTrees interactive tool, we see that the trend discrepancy for the period under consideration (1998-2014) in the Karl paper is nearly 0.3°C when comparing the recently created NOAA trend to satellites (RSS). There is as much as a 0.5°C difference between the NOAA/NASA GIS and RSS trend line end points (December, 2014). The -0.1°C cooling that emerges in the satellite data has been transformed into a +0.2°C warming by Karl et al. (2015). Almost immediately after its publication, the new warming trend for 1998-2014 was accepted by NASA and HadCRUT as well, allowing all three long-term data sets to now show significant warming when there had previously been a pause, even cooling.
Source: WoodForTrees
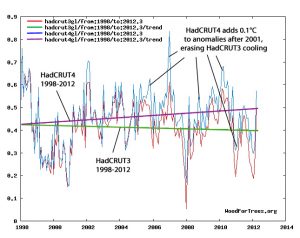
HadCRUT Erases 1998-2012 Slight Cooling Trend By Changing Versions
Changing unpalatable temperature trends in time for an event of intergovernmental and public policy significance has happened before.
The combined Hadley Centre and Climatic Research Unit (HadCRUT) data set — which is featured in the Intergovernmental Panel on Climate Change (IPCC) reports — underwent a revision from version 3 to version 4 in March of 2012. This was about a year before the latest IPCC report was to be released (2013). At the time (early 2012), it was quite inconvenient to the paradigm that HadCRUT3 was highlighting a slight global cooling trend between 1998 and 2012, as shown in the graph below (using HadCRUT3 and HadCRUT4 raw data from WoodForTrees).
Graphs used by the IPCC depicting a slight cooling trend since 1998 would not be acceptable to policymakers wishing to emphasize the urgency of addressing dangerous global warming. So, just in time for the 2013 edition of the IPCC report, about 0.1°C was added to the 1998-2012 HadCRUT trend. The effect was to transform the slight cooling into what the IPCC called a “hiatus” from warming. To achieve the removal of the slight cooling trend found in HadCRUT3, the more recent anomalies in HadCRUT4 were warmed up (by 0.1 to 0.2°C), whereas the past warmth (especially around 1998) was left intact. The effect was to warm the present and cool the past.
Source: WoodForTrees
IPCC (2013) analysis of the 1998-2012 “hiatus” from warming:
“For the period 1998–2012, 111 of the 114 climate-model simulations show a surface-warming trend larger than the observations.”
“During the 15-year period beginning in 1998, the ensemble of HadCRUT4 GMST trends lies below almost all model-simulated trends.”
“Almost all CMIP5 historical simulations do not reproduce the observed recent warming hiatus.”
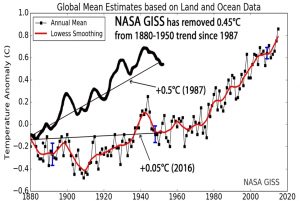
NASA Has Removed Almost 0.5°C From 1880-1950 Warming Since The 1990s
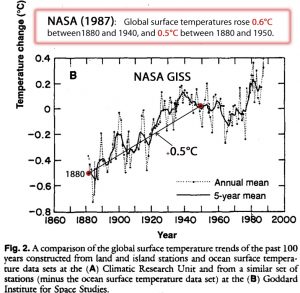
As recently as 1990, it was widely accepted that the global temperature trend, as reported by NASA (Hansen and Lebedeff, 1987), showed a “0.5°C rise between 1880 and 1950.”
This 0.5°C rise in global temperatures between 1880-1950 (and 0.6°C between 1880 and 1940) can clearly be seen in the NASA GISS graph from 1987:
Schneider, S. H. 1989. The greenhouse effect: Science and policy. Science 243: 771-81.
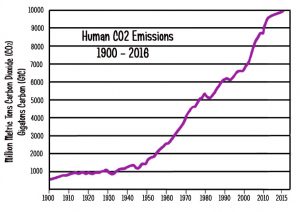
Today, it is no longer acceptable for the HadCRUT, NASA, and NOAA global temperature data sets to graphically depict a strong warming trend during the first half of the 20th century. This is because anthropogenic CO2 emissions were flat and negligible relative to today during this abrupt warming period, as shown here:
So as to eliminate the inconvenience of a non-anthropogenic warming trend in modern times, NASA and NOAA have removed all or nearly all the 0.5°C of warming between 1880 and 1950. If past raw temperature data do not fit the narrative that human CO2 emissions drive climate change, the raw data must be changed. In this way, the paradigm is kept alive.
NASA GISS graph



[…] More Data Manipulation By NOAA, NASA, HadCRUT… Cooling The Past, Warming the Present […]
Kenneth – do you ever sleep? Many of us have seen much of this before, and know some of the arguments and counterarguments by heart, but to see it all assembled in such a clear way is impressive indeed.
Pierre – Germany is reported to remain a bastion of the CAGW cause, and Germans seem more thoroughly indoctrinated than most. If you are not already doing so, would you consider to translate this post, and others, for the benefit of our German friends? I’m guessing they don’t get exposed to very much of this CONTRA stuff..
Kenneth told me he only needs a couple of hours of sleep per night. I have no idea any one can do that. The only other person I know that seems to do this is Trump.
Germany is quite stuck in the AGW religion. Perhaps someone at EIKE would do it. Will check.
I’ve known a few, including the CEO of an insomnia drug development company. He used to get on email at 3am and deluge us with data and links. That gig exposed me to a wealth of research on sleep. There are largely genetic determinants of sleep requirements, so much so, that people fall onto three distinct groups: average sleepers (7-9 hours/night), long sleepers, who need more than 9 hrs/nt to function, and short sleepers, who thrive on 4-6 hours a night. Kenneth and Pres Trump are in that group.
Dear Pierre (and mothcatcher),
the EIKE-translator Chris Frey got notice of this and will do it during the weekend.
Indeed I appreciate as well this condensed documentation of the NASA’s fraud.
Chris Frey
I have a similar problem, if you want to call it that. Looking back at the past decade, I cannot believe how much I work I performed – also due to being an insomniac workaholic (if I made a detailed list, most people would find it hard to believe). In fact, I’m still at it, but I’m beginning to pay a price. Partly because I’m getting older I guess, but I think this workaholic lifestyle and the continual sleep deficit it involves also costs a lot of substance over time. And still I cannot stop…
mothcatcher,
Yes, this was meant to be an overview, but the wholesale station removal and bias towards airport station sitings since the 1970s is not as commonly known, I assume.
Pierre is correct. I have come to the conclusion that sleep is a waste of valuable time during my productive, lucid years. So I’ve made the conscious decision to sleep about 2 to 3 hours per day. Most people don’t agree that the amount of sleep one gets is a choice, but it’s as much of a choice as choosing our attitude, or choosing how we feel.
The data of McKitrick only show totals. More informative is a bookkeeping display as I made for the 13486 stations in the GHCN base for different regions during several centuries till 2010. Compare the way demographers deal with population figures. Because a table will not survive my comment, some figures in text format. At the start of 1970 there were 9644 stations in use. During 1970-1999 there were 2918 new stations included and 9434 dropped. So at the beginning of 2000 there were 3128 left. During 2000-2010 there were 14 new stations included and 1539 dropped, making the total 1603 in 2011. Because I employed an interval of 30 years we cannot see that from the new stations some were dropped within the same period (a kind of child mortality) but my figures show that almost all older stations disappeared within a few decades. Therefore, we have the situation that long-term temperature trends are based on an almost completely changed station population.
I also did a study into the most important factors behind the drop-out rate. Because of overrepresentation on NH we may expect that region is a factor besides the aspects mentioned in this post. The most important factor, however, is the correlation between the time series of a station and the time series of regional means. The lower this correlation the more a station is a dissenter and the higher its drop-out risk. This can only be achieved by an inspection of the history of each station: the stations were dropped on the basis of their past behavior. Try to imagine that this would be done in a medical survey.
Agree with those above. Excellent work.
There are multiple lines of evidence that suggest (at any rate as far as the Northern Hemisphere is concerned) that the temperatures today are no warmer than those seen and observed in 1940, notwithstanding that some 95% of all manmade CO2 emissions has taken place subsequent to 1940.
We have no worthwhile data on the Southern Hemisphere (mainly ocean and too sparsely sampled even today, the problems going back 70 years ago is far worse), and since we have no worthwhile data on the Southern Hemisphere it follows that we do not know the position on a global basis.
We can only work with the Northern Hemisphere and it appears from that it is probable that there has been no or very little warming these past 75 years.
[…] Global Temperature Data Manipulation […]
About the accuracy of satellite data (interview with the scientist who compiled the RSS data set):
https://www.youtube.com/watch?v=8BnkI5vqr_0
And I strongly suggest to read this FAQ if you want to know how temperature data gets adjusted and why a lot of the stations that were added between the 50s and 90s aren’t considered anymore.
https://www.ncdc.noaa.gov/monitoring-references/faq/temperature-monitoring.php
Hmm … you can delete my comments down below. There is a weird caching (?) issue going on here.
About the accuracy of satellite data (interview with the scientist who compiled the RSS data set):
https://www.youtube.com/watch?v=8BnkI5vqr_0
And I strongly suggest to read this FAQ if you want to know how temperature data gets adjusted and why a lot of the stations that were added between the 50s and 90s aren’t considered anymore.
https://www.ncdc.noaa.gov/monitoring-references/faq/temperature-monitoring.php
The comment system is eating my comment again …
About the accuracy of satellite data (interview with the scientist who compiled the RSS data set):
http://www.youtube.com/watch?v=8BnkI5vqr_0
And I strongly suggest to read this FAQ if you want to know how temperature data gets adjusted and why a lot of the stations that were added between the 50s and 90s aren’t considered anymore.
https://www.ncdc.noaa.gov/monitoring-references/faq/temperature-monitoring.php
The comment system is eating my comment again …
About the accuracy of satellite data (interview with the scientist who compiled the RSS data set):
https://www.youtube.com/watch?v=8BnkI5vqr_0
Aha, it works when I only post part of the comment? Here is the second part:
And I strongly suggest to read this FAQ if you want to know how temperature data gets adjusted and why a lot of the stations that were added between the 50s and 90s aren’t considered anymore.
https://www.ncdc.noaa.gov/monitoring-references/faq/temperature-monitoring.php
Aha, it works when I only post part of the comment? Here is the second part:
And I strongly suggest to read this FAQ if you want to know how temperature data gets adjusted and why a lot of the stations that were added between the 50s and 90s aren’t considered anymore.
Aha, it works when I only post part of the comment? Here is the second part:
And I strongly suggest to read this FAQ if you want to know how temperature data gets adjusted (and the number of stations).
https://www.ncdc.noaa.gov/monitoring-references/faq/temperature-monitoring.php
Loss of stations was a problem recognised by Phil Jones in this e-mail from 2004:
Mon Dec 20 17:55:56 2004
from: Phil Jones
subject: Re: [Fwd: Re: [Fwd: Re: “Model Mean Climate” for AR4]]
to: Kevin Trenberth
As to change of base period – this seems like a decision for the whole of WGI. To redo the global temperature average, I can just move the series up/down, but this isn’t the correct way to do it. I should talk out a new base period from all the individual stations and recalculate anomalies for the oceans. For the oceans this isn’t a problem, but the land it is a serious problem.
Many stations have good (i.e. near complete base periods for 1961-90) but I’ll lose hundreds, maybe over a thousand, stations if I went to 1981-2000.
For both surface temperature and precipitation we don’t have spatially complete datasets (like models) so it will be quite difficult.
I would like to stick with 1961-90. I don’t want to change this until 1981-2010 is complete, for 3 reasons : 1) We need 30 years and 81-10 will get all the MSU in nicely, and 2) I will be near retirement !! 3) is one of perception.
As climatologists we are often changing base periods and have done for years. I remember getting a number of comments when I changed from 1951-80 to 1961-90.
If we go to a more recent one the anomalies will seem less warm – I know this makes no sense scientifically, but it gives the skeptics something to go on about ! If we do the simple way, they will say we aren’t doing it properly.”
Thanks a lot to Kenneth Richards for this very valuable overview. One thing is to read about the single cases of such adjustments, but the effect is so much stronger seeing them together like this.
Modern urban warming is only part of the story, it exists also in many 50-100 year old records. In Australia for example, many early weather stations were placed next to the Post Office, but of course towns usually grow around their POs, then when aviation took off after WW2 the weather stations moved to airports, with the airport data getting spliced onto the urban-warmed Post Office data.
This can be seen in warming hot-spots, which can only be caused by urban warming.
[…] Changes to the GISS Land Surface Air Temperature-Based Dataset Have Increased Reported Long-Term Global Warming. Robust Evidence NOAA Temperature Data Hopelessly Corrupted By Warming Bias, Manipulation. Homogenised temperatures, and planning for bushfires – On Line Opinion – 1/9/2016. NASA’s Gavin Schmidt Says He Can’t Be Held Responsible For The Fraudulent Data He Publishes. Watts Up With That? More Data Manipulation By NOAA, NASA, HadCRUT…Cooling The Past, Warming the Present. […]
[…] measurements did just the opposite, they dropped the non-urban thermometers, thousands of them. Unfortunately, that isn’t a joke. How this is not criminal data tampering is beyond […]
Climate “Science” on Trial; Cherry Picking Locations to Manufacture Warming
https://co2islife.wordpress.com/2017/02/18/a-tale-of-two-cities-cherry-picking-locations-to-manufacture-warming/
[…] Link: https://notrickszone.com/2017/02/13/more-data-manipulation-by-noaa-nasa-hadcrut-cooling-the-past-warm… […]
“Astonishingly, as many as half (49% as of 2009) of the weather stations across the globe used by the GHCN are now located on the (paved) grounds of airports.”
Weather stations on ariports are located on paved ground? At least not here in Germany.
[…] Übernommen aus EIKE, Übersetzung von Chris Frey aus dem Englischen hier: https://notrickszone.com/2017/02/13/more-data-manipulation-by-noaa-nasa-hadcrut-cooling-the-past-warm… […]
[…] measurements did just the opposite, they dropped the non-urban thermometers, thousands of them. Unfortunately, that isn’t a joke. How this is not criminal data tampering is beyond […]
[…] Another way NOAA influences the official temperature is by removal of thousands of weather station land thermometers from remote, high altitude, and/or non-urban locations since the 1970s. These are stations which do not show the warming trends predicted by models, as they are not affected by proximity to artificial or non-climatic heat sources (pavements, buildings, machinery, industry, etc.) like urban weather stations are. (Thermometers near urban heat sources can cause warming biases of between 0.1 and 0.4°C per decade.) This inflates the average temperature reported. Read more […]
[…] While I’ve written about this is the past, I’m not the only one that has documented this fraudulent data manipulation. […]
[…] Übernommen aus EIKE, Übersetzung von Chris Frey aus dem Englischen hier. […]