The Arctic is defying the alarmist melting predictions made by global warming activists and scientists. An Embarrassment!
First, Vencore Weather here writes that Greenland Summit Station “will experience high temperatures around -40°F which continues the very cold and well-below normal trend for the month of November“.
Moreover Vencore presents 2 NASA/MODIS satellite photos of Greenland’s Petermann Glacier during the past five years, which revealed growth of the glacier over the past 5 years: from a low point in August 2012 (left) to August 2017 (right):

NASA-MODIS satellite photos.
Vencore Weather reports:
In addition to the bitter cold, snow and ice accumulation throughout Greenland has been running at the high end of normal since the fall of 2016 – at times at or near record levels.”
This tells us the the dire warnings issued years ago of a melting Arctic have been in fact been met with contradictory developments.
Polar bear expert: one of the earliest Hudson Bay freezings
Meanwhile at Twitter here polar bear expert Dr. Susan Crockford recently tweeted:
CIS Hudson Bay and Eastern Arctic
#seaice for week of November 20: still way more shore-bound ice than average for this point in the season, with an unusual patch of new ice in NW Hudson Bay (dark blue).”
Also at her Polar Bear Science site here, Crockford wrote that the West Hudson Bay freeze-up was “one of earliest since 1979.”
Crockford next cited polar bear guide Kelsey Eliasson, “on the ground near Churchill“, who “noted yesterday (12 November) that virtually all bears had already left for the ice (see first comment)“.
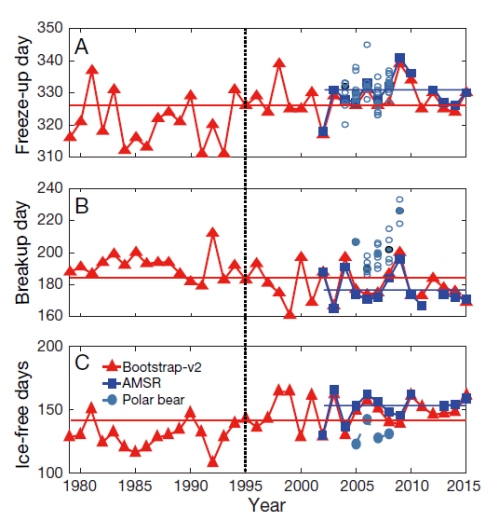
The following charts provided by Crockford show that the “freeze up day” has been at a constant level so far this century. The “ice break-up day” in the spring has also been consistent over the past two decades. Finally, the number of ice-free days has not been trending up over the past 20 years:
According to Crockford at Twitter here:
The average date
#polarbears left the ice in the 1980s (± 5 days) vs. 2004-2008, when they left 24 November ± 8 days. Virtually all bears on the ice now, which means freeze-up this year was one of the earliest since 1979.
Arctic warming and melting? Hasn’t been any over the past 10 years!


According ‘Masie’ there is 561.4 thousand Km2 ice in Hudson Bay. Almost twice the amount for the same day last year.
http://masie_web.apps.nsidc.org/pub/DATASETS/NOAA/G02186/png/4km/2016/masie_all_r10_v01_2016327_4km.png
http://masie_web.apps.nsidc.org/pub/DATASETS/NOAA/G02186/latest/4km/masie_all_r10_4km.png
As the HadCRUT4 data show (belowlink), there has been no warming in the Arctic since 2005…
http://www.climate4you.com/images/70-90N%20MonthlyAnomaly%20Since2000.gif
…and yet the advocates of dangerous anthropogenic global warming claim that the pause was eliminated by adding more Arctic data.
Curiously, Antarctica hasn’t been warming either:
https://notrickszone.com/wp-content/uploads/2017/03/Antarctica-UAH-1979-2016.jpg
Ice mass and gravity combine to push ice out and down from the accumulation zones of snow. The leading ice edge at low-altitude becomes vulnerable to ablation. More or less snow in the accumulation zone will cause advance or “retreat” of the ice front.
One can see many processes at work in the ablation zone: melting and calving are just two of these.
Don’t be surprised when another large section breaks loose from the Petermann Glacier, or some other floating ice. The tragedy of the death of glaciers will fuel the news for a few days. The newly active warmists will have to be educated as to how glaciers work — then we can all move on to the next crisis.
Can the “coldists” learn that too? Or how do you explain the constant mentioning of a higher than normal SMB and their conclusion from that Greenland is gaining mass and the next ice age will be upon us? 🙂
Which is worse: global cooling or global warming? Assuming you think global warming is worse, as the world’s ice sheets and glaciers are contributing a few centimeters per century to sea level rise (Egad!) as the planets’ land mass area grows and greens, by how much would you prefer the Earth cool? What’s the optimum temperature, since apparently the current one is so undesirable?
Whataboutism …
Could you answer the question, or are you dodging this one too?
I asked first.
You asked John a question. I asked you a question about why you prefer global cooling to warming, the latter resulting in a few centimeters of ice melt contribution to sea level rise in the last 100+ years. You’ve dodged this question, of course.
Not long ago, you described warming as “bad”. Why is warmth bad, SebastianH?
Do you think dodging questions like these fortifies your standing here?
“Can the “coldists” learn that too? Or how do you explain the constant mentioning of a higher than normal SMB”
I don’t know if the SMB is “higher than normal”. What I do know is that it is growing and that is exactly the opposite of what the alarmists told us would happen time and time and time again!
What follows is probably the highest profile of dozens of examples I could give.
In 1988 James Hanson declared that the West Side Hwy in Manhattan would be underwater by 2028 due to SLR caused by the melting of the Greenland and Antarctic ice sheets. (That 40 year period is giving Hanson the maximum benefit of the doubt because it was originally reported he said it would be underwater in 20 years and then when the 20 years were up Hanson came out and said that the report was wrong and declared he has said it would be underwater in 40 years.) Well 2018 will make it 30 years.
Here is the data for the nearest tide gauge to the West Side Hwy. http://www.psmsl.org/data/obtaining/stations/12.php
Are you disappointed SebastianH? Has your faith in people like Hanson who is one of the most prominent figure heads that started the catastrophic global warming scare been shaken even a little bit?
A growing SMB doesn’t mean the ice mass is increasing … The SMB has been positive every year and yet the Greenland ice mass decreased. If people understood how that works, they wouldn’t be dancing around an crying “new ice age upon us” now …
The rest, I don’t know ow what you are even talking about?
So when scientists point out that the Greenland Ice Sheet had a positive SMB for the 3 decades from 1961-1990 (+40 Gt/yr-1), what did that mean to you?
Fettweis et al ., 2017
http://www.the-cryosphere.net/11/1015/2017/tc-11-1015-2017.pdf
“Results from all MAR simulations indicate that (i) the period 1961–1990, commonly chosen as a stable reference period for Greenland SMB and ice dynamics, is actually a period of anomalously positive SMB (∼ +40 Gt yr−1 ) compared to 1900–2010 … [T]he ERA-20C forced simulation suggests that SMB during the 1920–1930 warm period over Greenland was comparable to the SMB of the 2000s, due to both higher melt and lower precipitation than normal.”
Why do you think it is, SebastianH, that the Greenland SMB was positive and removing water from sea levels during those 30 years since human CO2 emissions grew explosively during that same period? What was the mechanism causing the positive SMB?
Kenneth, the SMB is one part of the sum that is the ice loss/gain … It is not the ice loss/gain.
It’s the same with your cloud forcings or recently TSI forcing claims, you are ignoring the other parts. I don’t know why … either you just don’t know or you want to troll people on purpose.
Interesting. So explain why it is that a positive SMB results in a removal of water from sea levels, and a negative SMB results in a meltwater addition to sea levels. How does that work, exactly? Please be specific so we can all learn how SMB operates in your reality.
https://www.nasa.gov/feature/goddard/nasa-study-mass-gains-of-antarctic-ice-sheet-greater-than-losses
the Antarctic ice sheet showed a net gain of 112 billion tons of ice a year from 1992 to 2001. That net gain slowed to 82 billion tons of ice per year between 2003 and 2008. “…Antarctica is not currently contributing to sea level rise, but is taking 0.23 millimeters per year away,” Zwally said.
—
Thomas et al., 2017
https://www.clim-past.net/13/1491/2017/cp-13-1491-2017.pdf
Our results show that SMB [surface mass balance] for the total Antarctic Ice Sheet (including ice shelves) has increased at a rate of 7 ± 0.13 Gt decade−1 since 1800 AD representing a net reduction in sea level of ∼ 0.02 mm decade−1 since 1800 and ∼ 0.04 mm decade−1 since 1900 AD. The largest contribution is from the Antarctic Peninsula (∼ 75 %) where the annual average SMB during the most recent decade (2001–2010) is 123 ± 44 Gt yr−1 higher than the annual average during the first decade of the 19th century.
—
http://onlinelibrary.wiley.com/doi/10.1029/2012GL053316/full
While several studies [e.g.,Rignot et al., 2008; Velicogna, 2009] indicate no significant changes in the East Antarctic ice sheet between 2002 and 2009, GRACE recently observes mass gain along the coast (Figure S1). A spatial average over the region where this mass gain is observed (30 W–60 E, 65 S–80 S) shows a relatively stable mass budget from 2003–2008, followed by a strong increase that began in 2009 (Figure 2). The cumulative mass gain observed by GRACE between early 2009 and 2011 is approximately +350 Gt, which is equivalent to about -0.32 mm/yr global sea level decrease.
“A growing SMB doesn’t mean the ice mass is increasing”
Really? A growing mass of ice does not mean that ice mass is increasing?
What metric does indicate a growing ice sheet? Can’t be calving because alarmists have time and again made it clear that they believe that glacial calving is a sign of melting due to warming.
“The rest, I don’t know ow what you are even talking about?”
Now I understand why you’re still a true believer.
RAH,
See: https://www.dmi.dk/en/groenland/maalinger/greenland-ice-sheet-surface-mass-budget/
“Note that the accumulated curve does not end at 0 at the end of the year. Over the year, it snows more than it melts, but calving of icebergs also adds to the total mass budget of the ice sheet. Satellite observations over the last decade show that the ice sheet is not in balance. The calving loss is greater than the gain from surface mass balance, and Greenland is losing mass at about 200 Gt/yr.”
SebastianH: “Greenland is losing mass at about 200 Gt/yr”
Apparently SebastianH doesn’t understand that the 200 Gt/yr he cites is an averaged rate for the first 10-12 years of the 21st century, heavily skewed by the -367 Gt/yr average during the 2008-2012 period. In individual years since then, for example, the ice sheet lost just -6 Gt/yr (2013-’14). In 2017, the ice sheet gained mass — just as it did from 1961-2002 (Fettweis et al., 2017, Zwally et al., 2005).
SebastianH claims that “a growing SMB doesn’t mean the ice mass is increasing” because he is unable/unwilling to acknowledge that the Greenland ice sheet cooled and gained mass and lowered sea levels for several decades during the same period of time that anthropogenic CO2 emissions were exploding. He is also unable/unwilling to name the mechanism that caused the Greenland ice sheet to gain mass from 1961-2002, as doing so would not be compatible with his beliefs.
It’s when it doesn’t calve and keeps growing that we need to start asking where is the climate heading?
They’re having a regular heat wave at summit station.
Conditions
-32 C -26 F
12.0 knots
212 degrees SSW
As of 11/25 05:42
That is much warmer than it was earlier this week. On the 19th it got down to -60 F.
As for the polar bears? Cold or warm, sea ice or no sea ice, it’s pretty darn clear that the bears have been doing just fine.
Sebastian would prefer the climate of 12,000 years ago.
Not many people back then, either, so little chance of global warming.
Oh wait, what happened?
I’d prefer you not mentioning me below every post on this blog … are you some kind of stalker/fanboy? Should I worry?
If you are as stupid as your comment makes you sound, sure.
Classy reply …
Excellent comment ClimateOtter, exactly as deserved for the anti-science brigade.
Currently, according to DMI, Arctic sea ice volume is above 2015 and 2016 levels and well within 2 standard deviations of the mean.
http://ocean.dmi.dk/arctic/icethickness/thk.uk.php
The Greenland Ice Sheet SMB is right at 2 standard deviations above the mean.
http://www.dmi.dk/en/groenland/maalinger/greenland-ice-sheet-surface-mass-budget/
Nothing unusual one way or another about any of that based on the modern norms.
Are the people who run these blogs aware there are other ice caps besides Greenland?
Or that one cold winter (in a specific geographic region on top of that) does not make a trend (or invalidates a 100 year long trend).
The question is: fools or knaves?
Well, there’s also the much larger Antarctic ice sheet…which has been gaining mass and lowering sea levels for over 200 years (since 1800). Or is that not what you meant?
Thomas et al., 2017
https://www.clim-past.net/13/1491/2017/cp-13-1491-2017.pdf
“Our results show that SMB [surface mass balance] for the total Antarctic Ice Sheet (including ice shelves) has increased at a rate of 7 ± 0.13 Gt decade−1 since 1800 AD representing a net reduction in sea level of ∼ 0.02 mm decade−1 since 1800 and ∼ 0.04 mm decade−1 since 1900 AD. The largest contribution is from the Antarctic Peninsula (∼ 75 %) where the annual average SMB during the most recent decade (2001–2010) is 123 ± 44 Gt yr−1 higher than the annual average during the first decade of the 19th century.”
Do you even read the paper you post or do you just post the first thing that comes on google that (you think) sits well with you after quickly going through the abstract? Do you realize the scientists who contributed to this research believe global warming is occurring? So what is even the point of posting this? Are you trying to catch them up in a faux pas? You think you’re going to uncover a worldwide conspiracy?
From your own paper
“An increase in Antarctic SMB is expected in a warmer climate
as a result of increased precipitation when atmospheric
moisture content increases (Krinner et al., 2007; Agosta et
al., 2012; Ligtenberg et al., 2013; Frieler et al., 2015), with
climate models on average predicting a 7.4 % precipitation
increase per degree of atmospheric warming (Palerme et al.,
2017). This potentially results in a mitigation of sea level
rise in the future (Krinner et al., 2007; Agosta et al., 2012)
ranging from 25 to 85 mm during the 21st century, depending
on the climate scenario (Palerme et al., 2017)”
Um, yes, the Antarctic ice sheet has been gaining mass and removing water from sea levels since 1800. And no, this is not what we read from the advocates of AGW alarm. There was quite the controversy two years ago when it was reported that the Antarctic ice sheet was gaining mass and lowering sea levels.
https://www.nasa.gov/feature/goddard/nasa-study-mass-gains-of-antarctic-ice-sheet-greater-than-losses
They instead claim that the Antarctic ice sheet is going to melt so rapidly that we’ll get 10 feet of sea level rise in the next 50 years. So what, exactly, did you intend to point out here?
http://www.slate.com/blogs/the_slatest/2015/07/20/sea_level_study_james_hansen_issues_dire_climate_warning.html
The study—written by James Hansen, NASA’s former lead climate scientist, and 16 co-authors, many of whom are considered among the top in their fields—concludes that glaciers in Greenland and Antarctica will melt 10 times faster than previous consensus estimates, resulting in sea level rise of at least 10 feet in as little as 50 years.
“And no, this is not what we read from the advocates of AGW alarm.”
I don’t know who you mean by “advocates of AGW alarm” but you can read the very paper you posted to see the explanation is a “warmer climate”.
“slate article”
I don’t care what tabloid articles say. Post the paper.
But what if Antarctica hasn’t been warming?
Stenni et al., 2017
https://notrickszone.com/2017/03/27/20-scientists-no-continent-scale-warming-of-antarctic-temperature-is-evident-in-the-last-century/
Why does an ice sheet recede with warming in the Arctic, but grow with warming in Antarctica? Can you explain that?
It’s Hansen et al., 2016. I will now stop doing your homework for you.
If only you did your homework … maybe you’d know.
I do know the explanation offered by your side, actually. But it’s a rather inconsistent explanation because your side believes that Antarctica is losing mass and contributing to sea level rise…and this is due to warming. When your side is presented with data that show Antarctica is gaining mass and lowering sea level, they claim this is also due to warming. So warming causes net mass gains and net mass losses…at the same time.
For the Arctic, this logical inconsistency is also apparent. The Greenland ice sheet gained mass, +40 Gt/yr, during the 30 years between 1961 and 1990 (Fettweis et al., 2017). This occurred while the Arctic was supposedly warming. Between 1992 and 2002, Greenland also gained mass, but at a slower rate (+11 Gt/yr). So while anthropogenic CO2 emissions were exploding, and the Greenland ice sheet was alleged to be warming, the ice sheet was gaining mass and removing sea level. And then, after 2002, the same warming that caused mass gains for 40 years suddenly began causing mass losses.
So, in other words, because your side refuses to acknowledge that the Antarctic and Arctic have cooled for decades at a time, they have to claim that warming causes both mass gains and mass losses at the same time.
I am so glad I’m not in the position of having to repeatedly defend this circular illogic.
Huybrechts and Oerlemans, 1990
http://epic.awi.de/1461/1/Huy1990c.pdf
According to this mass balance model, the amount of accumulation over the entire ice sheet is presently 24.06 x 10¹¹ m3 of ice, and no runoff takes place. A 1°C uniform warming is then calculated to increase the overall mass balance by an amount of 1.43 1011 m3 of ice, corresponding to a lowering of sea level with 0.36 mm/yr. A temperature increase of 5.3° C is needed for the increase in ablation to become more important than the increase in accumulation and the temperature would have to rise by 11.4°C to produce a zero surface mass balance. Imposing the Bellagio-scenario and accumulating changes in mass balance forward in time (static response) would then lower global sea level by 9 cm by 2100 AD.
—
Huybrechts et al., 2004
http://www.sciencedirect.com/science/article/pii/S0921818104000360
As a general result, it is found that the effect of increased precipitation on Antarctica dominates over the effect of increased melting on Greenland for the entire range of predictions, so that both polar ice sheets combined would gain mass in the 21st century. The results are very similar for both time-slice patterns driven by the underlying time evolution series with most of the scatter in the results caused by the variability in the lower-resolution AOGCMs. Combining these results with the long-term background trend yields a 20th and 21st century sea-level trend from polar ice sheets that is however not significantly different from zero.
“If only you did your homework … maybe you’d know.” – SebH
If only YOU did YOUR homework, you might be able to explain what you think you understand, or, better yet, realize what nonsense it is that you want us to take on faith, and that you don’t understand it at all.
I asked you for the paper and you redirect me to another blog post + unsourced image. You post this research and you draw the conclusion that global warming isn’t real, just like you did earlier except the authors of that paper never drew that conclusion. So I’m left wondering if that might be the case again, that’s why I want the paper and not your or the blogmaster’s take on it.
“Why does an ice sheet recede with warming in the Arctic, but grow with warming in Antarctica?”
Why would the behave the same way? Just because they’re both made of ice? You’re ignoring that besides that they little in common, starting from the obvious geographical and geological considerations.
“I will now stop doing your homework for you.”
I’m sorry but when you cite a paper I assume you have read said paper or at least have it at hand, I didn’t think you had only read an article about. If I have to go by what’s said in the article this paper is not peer-reviewed, so straight into the trash.
What does this accusation mean? That I have claimed that there has not been an overall warming since the depths of the Little Ice Age? Because I have not thought or written that.
So, just to be clear, you are in agreement that the Antarctic ice sheet has been advancing rather than receding for decades, and therefore it is removing water equivalent from sea levels rather than contributing to global sea level rise? You do realize that this is not a position endorsed by advocates of the AGW cause, right? They argue that the Antarctic ice sheet is melting and adding to sea levls due to warming, not advancing and removing water from sea levels due to warming. Why the inconsistency, Dave?
I’m curious if you agree that the reason why Antarctic sea ice has been growing since 1979 is because the Southern Ocean has been cooling since 1979. Do cooling and ice concentration advances work in tandem the Antarctic but not the Arctic because of “obvious geographical and geological considerations”? Or does the warming-causes-ice-to-grow concept only work with the ice sheet and not sea ice and in the Southern Hemisphere but not the Northern Hemisphere…for “obvious” considerations?
Fan et al., 2014
http://www.cgd.ucar.edu/staff/cdeser/docs/fan.antarctic_seaice_trends.grl14.pdf
“[A]ll of these studies reported a close relationship between [sea ice extent] and sea surface temperature (SST) whereby sea ice gain is associated with lower SSTs and vice versa.”
“Cooling is evident over most of the Southern Ocean in all seasons and the annual mean, with magnitudes approximately 0.2–0.4°C per decade or 0.7–1.3°C over the 33 year period [1979-2011].”
“Sea ice concentration (SIC) trends are generally consistent with the SST trends: that is, regions of increasing SIC are nearly always found in an environment of decreasing SST, and vice versa [warmer SSTs cause less SIC].”
I did read the paper in its entirety…more than once. I am fully aware of the position that a warming atmosphere may produce ice sheet advance and a decrease in sea levels. I am also fully aware of the position that a warming atmosphere may cause an ice sheet to melt and add to sea levels. Which viewpoint do you think is more popular with people like Dr. James Hansen, who believes sea levels will rise by several meters within as little as 50 years?
Hansen’s paper was indeed peer-reviewed and published in 2016. It originally appeared in 2015 in its non-peer-reviewed form, and a few adjustments were made after peer review. So do you agree that, due to warming, Antarctica will dramatically add to sea levels, or do you believe that, due to warming, Antarctica’s ice will grow and lower sea levels? Which one do you believe?
Of course they are aware but according to the alarmists the Arctic was the pole where signs of warming would show up first and most prominently.
Who are you referring to when you say “alarmists”? Arctic temperatures are increasing and ice is receding as far I know
Not since ~2005. There’s been a pause.
http://www.climate4you.com/images/70-90N%20MonthlyAnomaly%20Since2000.gif
During what span of years?
“There’s been a pause.”
Post the paper, don’t just give me unsourced images.
“During what span of years?”
Over the last few decades.
That’s raw HadCRUT4 data for the Arctic, graphed by Dr. Humlum at his website (Climate4you).
Greenland has also been slightly cooling since 2005
Kobashi et al., 2017
“For the most recent 10 years (2005 to 2015), apart from the anomalously warm year of 2010, mean annual temperatures at the Summit exhibit a slightly decreasing trend in accordance with northern North Atlantic-wide cooling. The Summit temperatures are well correlated with southwest coastal records (Ilulissat, Kangerlussuaq, Nuuk, and Qaqortoq).”
“During what span of years?”
Correct. And in the 4 decades before the last few decades, the Arctic was cooling and the Greenland Ice Sheet was gaining mass (lowering sea level).
Overall, there has been no significant net change in the temperatures for the Arctic or for the Greenland Ice Sheet in the last 80-90 years.
Kenneth it appears that not only do you have to do seb and Dave’s homework for them but also wipe the a***s when they exude more antiscience defecation.
Keep up the good work, however it is lost on those who can not, or are paid not to think.
“That’s raw HadCRUT4 data for the Arctic, graphed by Dr. Humlum at his website (Climate4you).”
And…?
“Greenland has also been slightly cooling since 2005. Unsourced image.”
“And in the 4 decades before the last few decades, the Arctic was cooling and the Greenland Ice Sheet was gaining mass. Unsourced images.”
I don’t think I have to repeat myself here.
The image and quote was not “unsourced”. It comes from Kobashi et al. (2017), and a link to the paper with the quote and image was provided. Did you bother to click on them?
It would probably be more persuasive if you had a more substantive “rebuttal” than claiming HadCRUT4 temperature data are “unsourced images”. In the meantime, here is Fettweis et al. (2017) and Zwally et al. (2005), who found that the Greenland ice sheet grew between 1961-1990 (+40 Gt/yr, -0.11 mm/yr removed from sea levels) and between 1992-2002 (+11 Gt/yr, -0.03 mm/yr removed from sea levels). These papers support the statement that in “the 4 decades before the last few decades, the Arctic was cooling and the Greenland Ice Sheet was gaining mass.” See if you can explain why Greenland was gaining mass and removing water from sea levels from 1961 to 2002, Dave. Why did that happen? What was the cooling mechanism?
Fettweis et al., 2017
http://www.the-cryosphere.net/11/1015/2017/tc-11-1015-2017.pdf
“Results from all MAR simulations indicate that the period 1961–1990, commonly chosen as a stable reference period for Greenland SMB [surface mass balance] and ice dynamics, is actually a period of anomalously positive SMB (∼ +40 Gt yr−1 ) compared to 1900–2010. … [T]he ERA-20C forced simulation suggests that SMB [surface mass balance] during the 1920–1930 warm period over Greenland was comparable to the SMB of the 2000s, due to both higher melt and lower precipitation than normal.”
—
Zwally et al., 2005
http://icesat.gsfc.nasa.gov/icesat/publications/IGS/mass_changes_2005.pdf
“The Greenland ice sheet is thinning at the margins (–42 Gt a–1 below the equilibrium-line altitude (ELA)) and growing inland (+53 Gt a–1 above the ELA) with a small overall mass gain (+11 Gt a–1; –0.03 mm a–1 SLE (sea-level equivalent)).”