The Warming ‘Hole’ Myth
Non-Warming Regions Are More Rule Than Exception
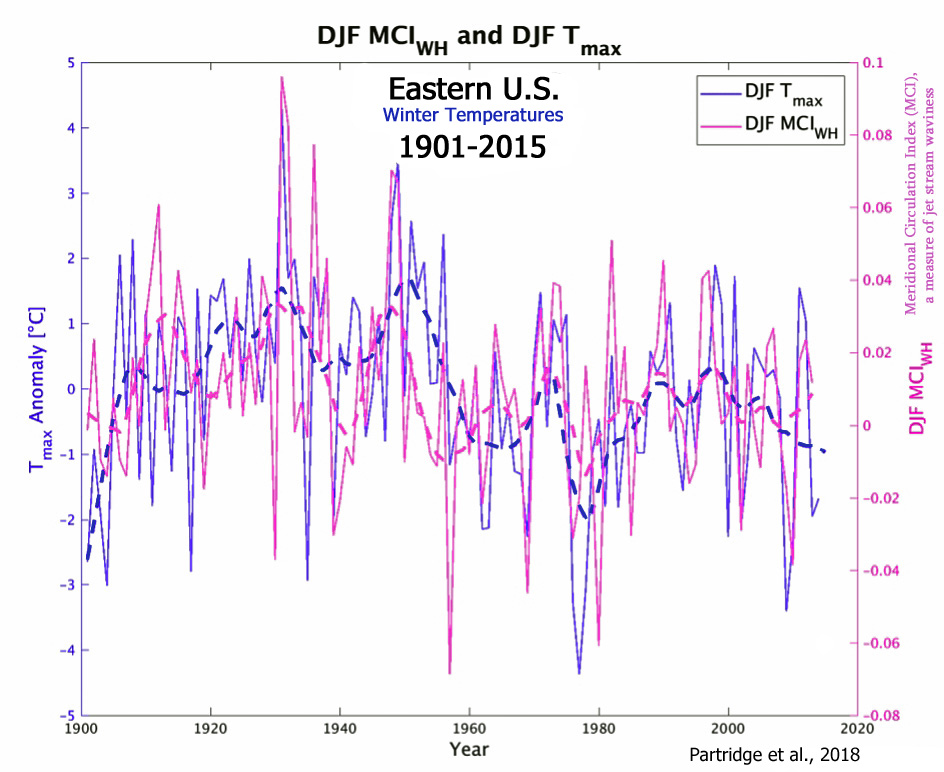
Earlier this month, the authors of a new paper (Partridge et al., 2018) published in Geophysical Research Letters promulgated the term “warming hole” to describe the cooling temperatures gripping most of the Eastern half of the United States from the late 1950s through 2015.
“We present a novel approach to characterize the spatiotemporal evolution of regional cooling across the eastern U.S. (commonly called the U.S. warming hole), by defining a spatially explicit boundary around the region of most persistent cooling. The warming hole emerges after a regime shift in 1958 where annual maximum (Tmax) and minimum (Tmin) temperatures decreased by 0.46°C and 0.83°C respectively. … [T]he seasonal modes also vary in causation. Winter temperatures in the warming hole are significantly correlated with the Meridional Circulation Index (MCI), North Atlantic Oscillation (NAO), and Pacific Decadal Oscillation (PDO). … We select only stations in the contiguous U.S. that have an 80% complete record from 1901-2015, resulting in 1407 temperature stations.”

Of course, by characterizing it as merely a “hole” in the global-scale warming over this period, this cooling has been portrayed as highly anomalous, an isolated exception to the trends that have encompassed the rest of the Earth.
But is this particular Eastern U.S. cooling trend truly an exception for this period? From all appearances, no. Large regions of the Earth have also cooled, or at least not warmed, in the last several decades.
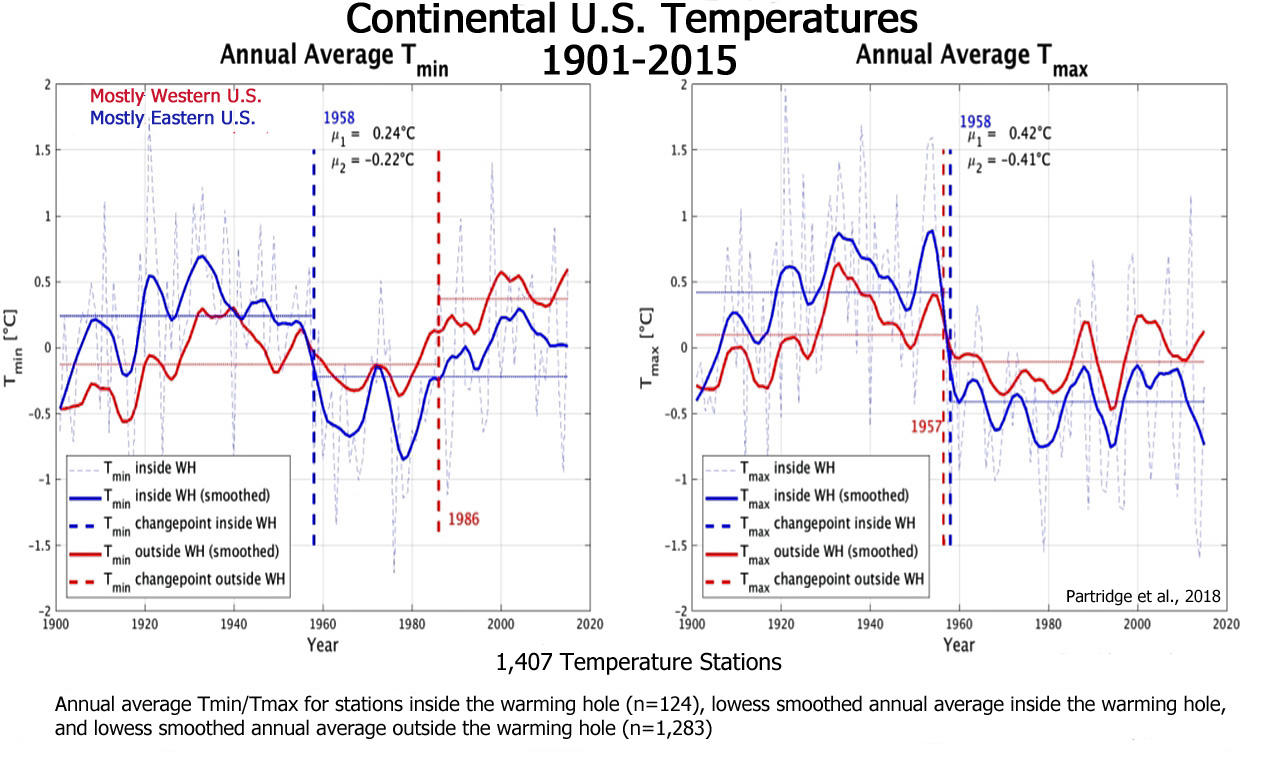
Even a closer inspection of this “warming hole” paper (Partridge et al., 2018) reveals that not only did 124 temperature stations from the Eastern U.S. “warming hole” region show a cooling trend since the 1950s, but another 1,283 stations from the rest of the continental U.S. (mostly the Western half ) also did not collectively show a clear warming trend throughout the entire 115-year period.
In other words, 1,407 temperature stations from across the contiguous U.S. do not show any warming trend during 1901 to 2015.
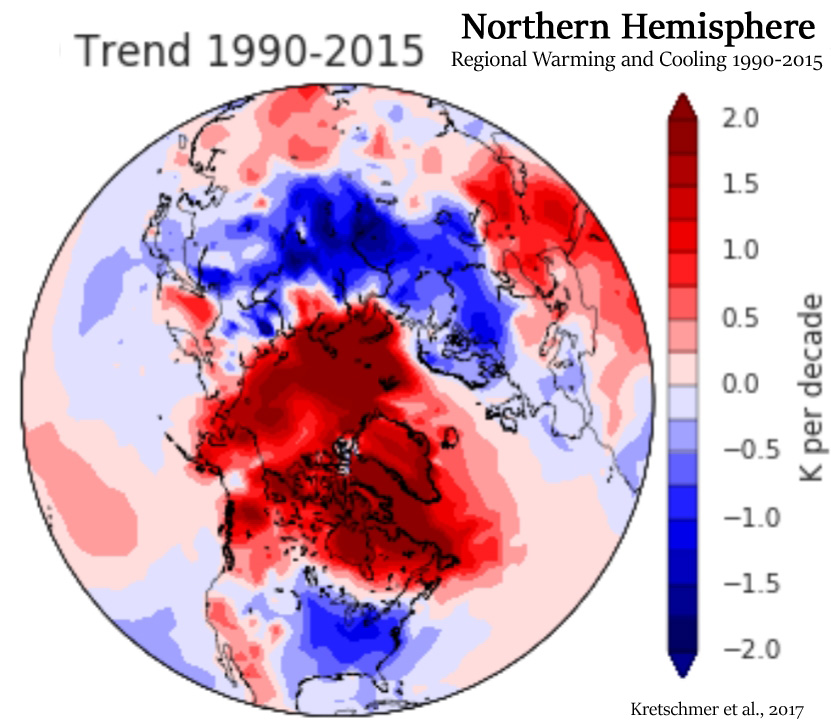
About 1/3rd Of The Northern Hemisphere Cooled During 1990-2015
According to the IPCC, modern warming has a “global signature“, whereas past warming and cooling events such as the Medieval Climate Anomaly and Little Ice Age were not “globally synchronous”.
But if modern warming truly is both global and synchronous, why are large regions of the Earth experiencing cooling — or at least non-warming — trends in recent decades?
In the Northern Hemisphere, for example, scientists (Kretschmer et al., 2018) have identified other “warming holes” in the temperature data for the 1990-2015 period. About 80% of the contiguous U.S., Europe and much of Asia, including parts of the Arctic (Eastern Siberia), cooled during the 1990-2015 period. These cooling regions may encompass approximately one-third of the top half of the globe.
“Despite global warming, recent winters in the Northeastern United States (US), Europe and especially in Asia were anomalously cold. Some mid-latitude regions like Central Asia and eastern Siberia even show a downward temperature trend in winter over the past decades (Cohen et al. 2014a; McCusker et al. 2016).”
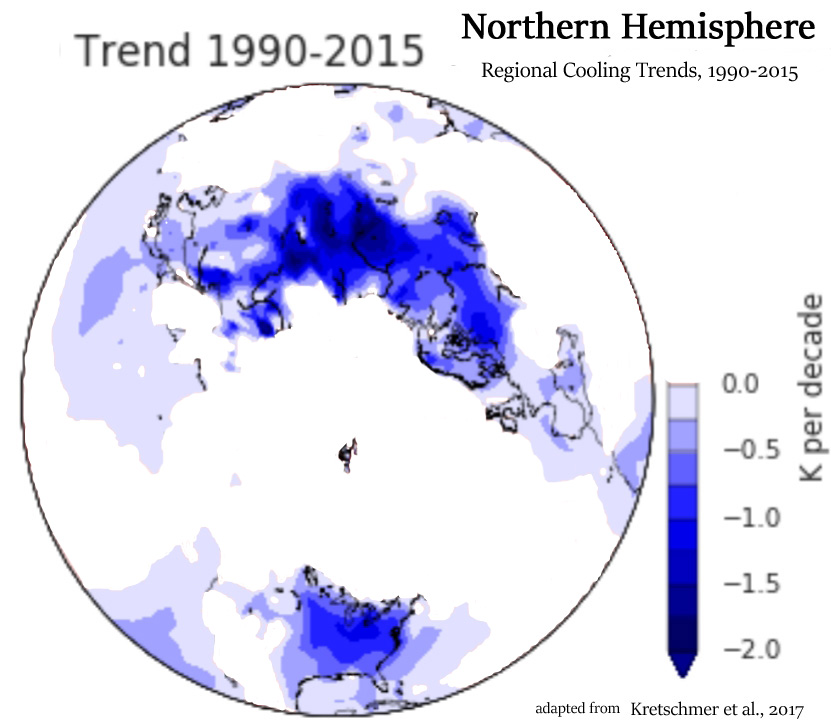
In some regions that were depicted as warming overall during 1990-2015 in the graph above, there has been a cooling trend since the mid-2000s.
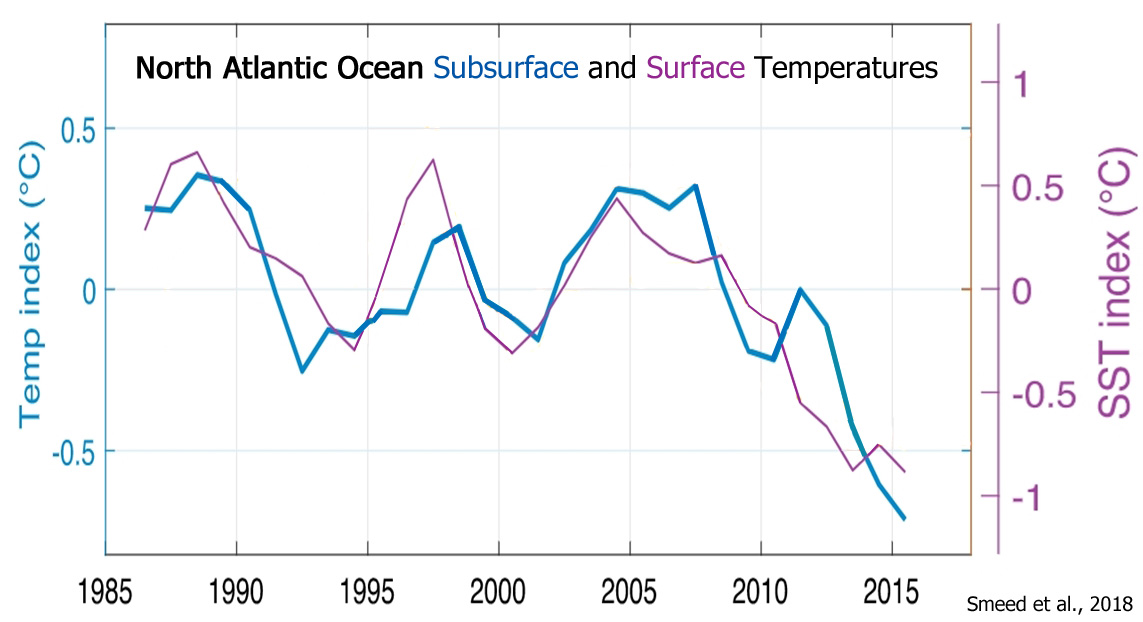
Image Source: Smeed et al., 2018
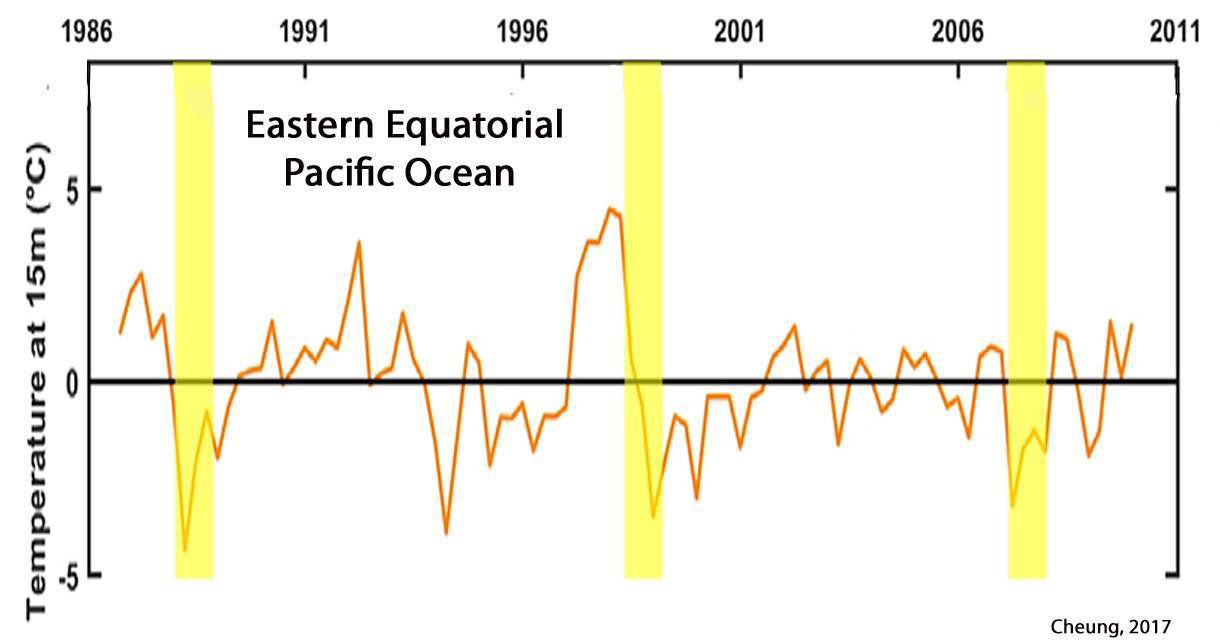
Image Source: Cheung, 2017
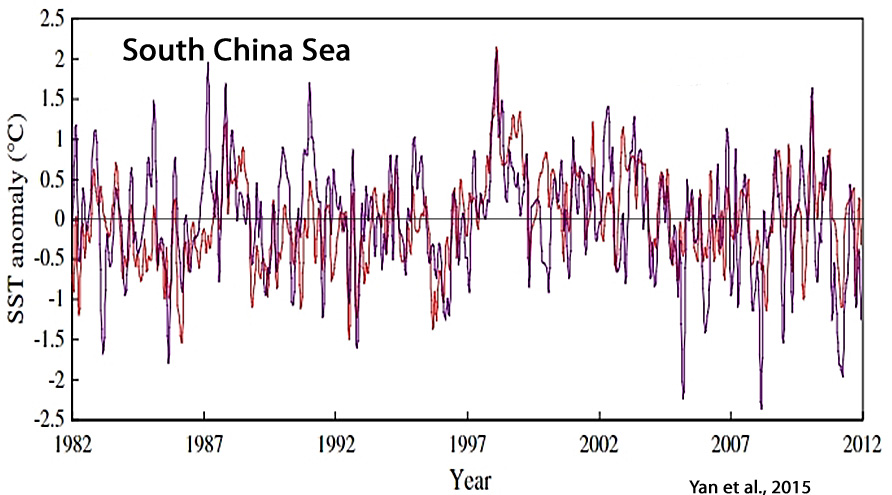
Image Source: Yan et al., 2015
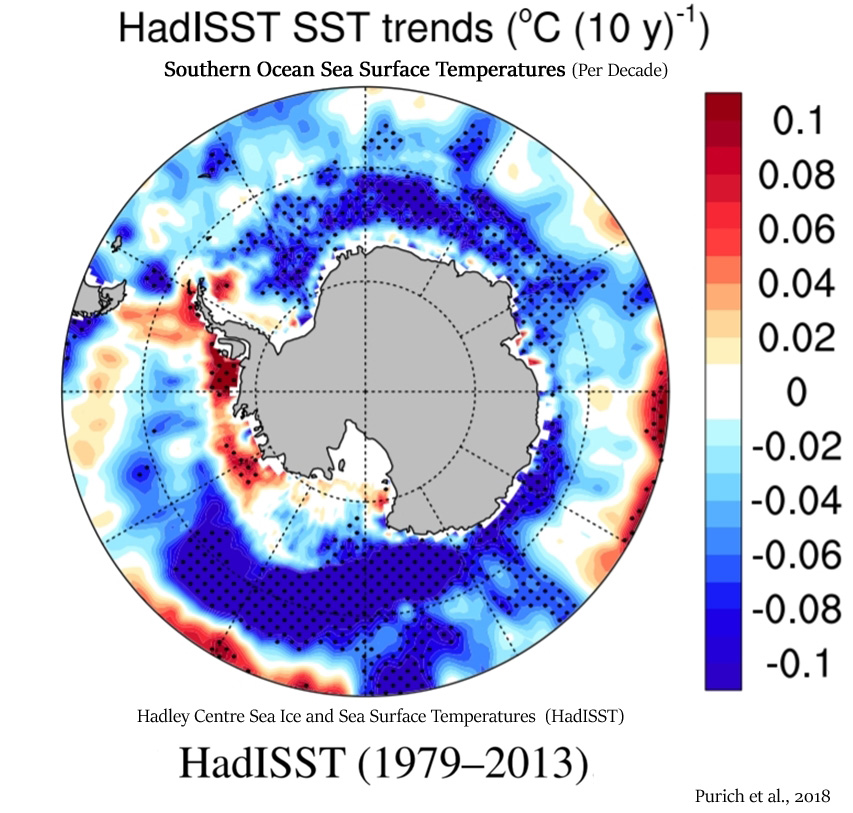
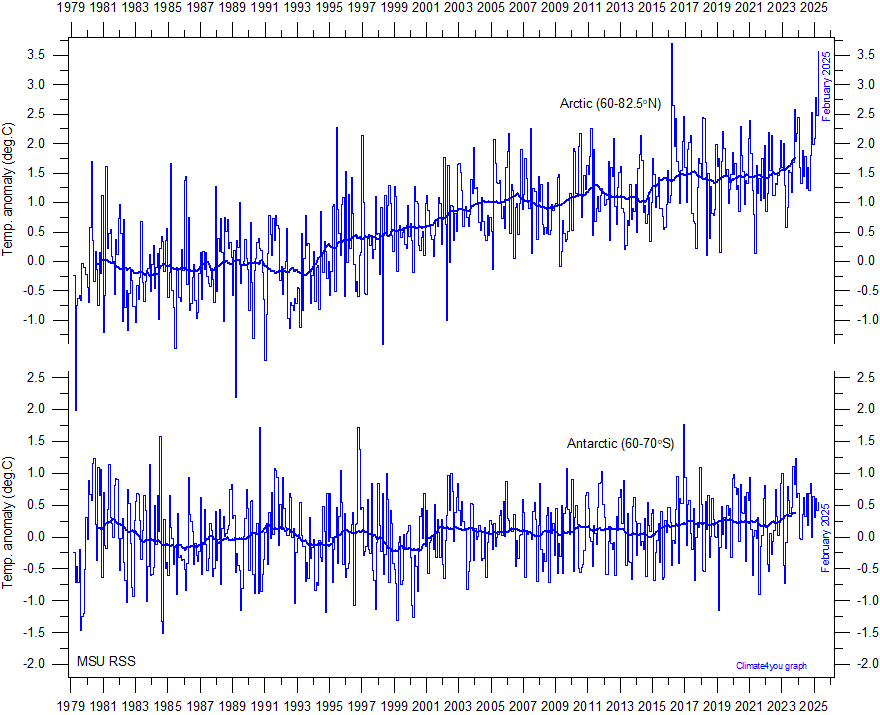
Much Of The Southern Hemisphere Has Been Cooling Since 1979
In the Southern Hemisphere, Antarctica has not warmed in the last 38 years.
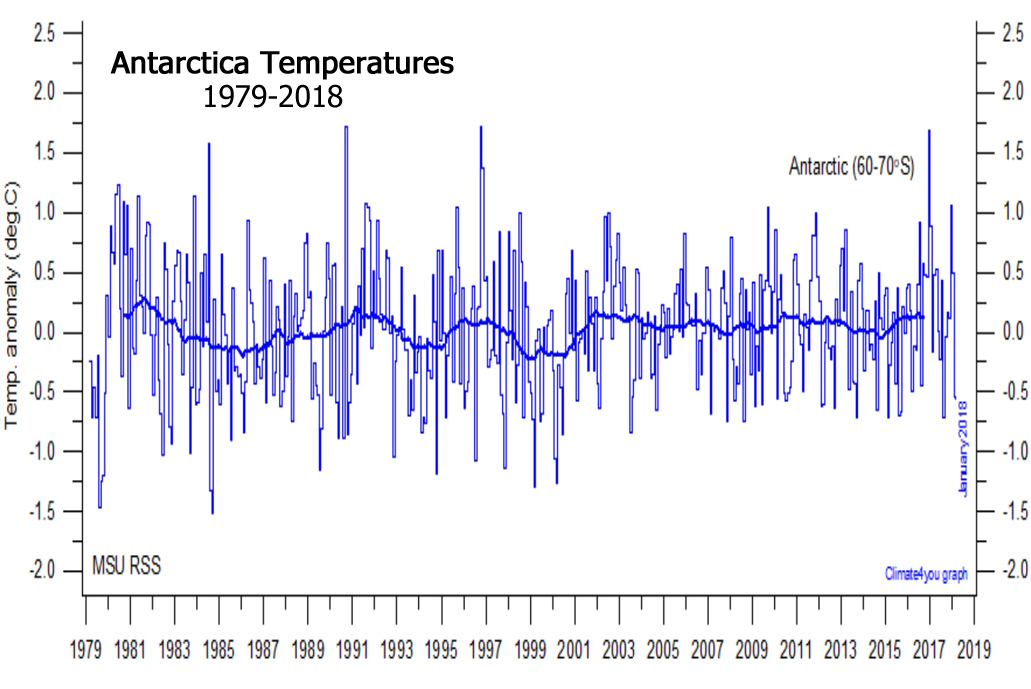
Image Source: Climate4You
The Southern Ocean surrounding Antarctica and extending into the South Pacific has been cooling since 1979 (Purich et al., 2018) .
“Observed Southern Ocean changes over recent decades include a surface freshening (Durack and Wijffels 2010; Durack et al. 2012; de Lavergne et al. 2014), surface cooling (Fan et al. 2014; Marshall et al. 2014; Armour et al. 2016; Purich et al. 2016a) and circumpolar increase in Antarctic sea ice (Cavalieri and Parkinson 2008; Comiso and Nishio 2008; Parkinson and Cavalieri 2012). … The majority of CMIP5 models do not simulate a surface cooling and increase in sea ice, as seen in observations.”
So Why Do The Global Temperature Graphs Show Such Strong Warming In Recent Decades?
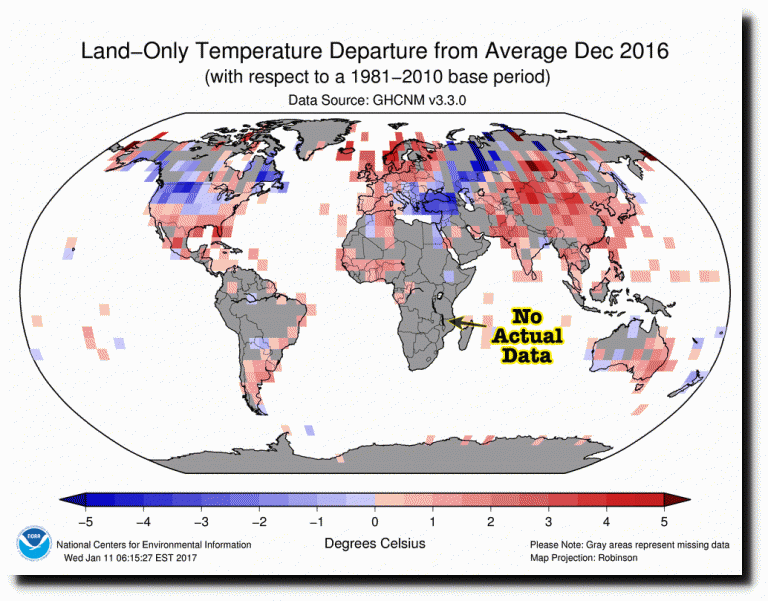
Global temperature graphs are made to look like they are burning hot all across the globe.
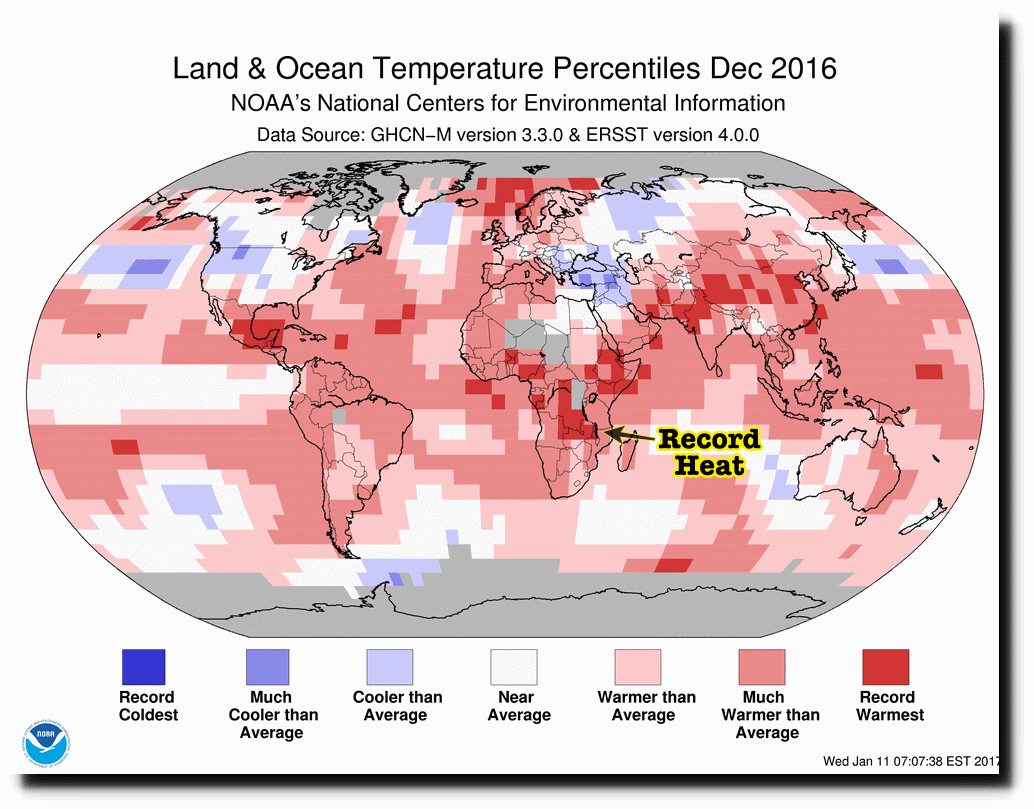
But the “data” that adds varying shades of red coloration to graphs of global temperature are largely just in-filled by computer models. That’s a nice way of saying they’re mostly concocted, as there is no actual temperature data available in the regions of the globe (gray) where much of the Earth is allegedly sweltering.
Image(s) Source: RealClimateScience.com
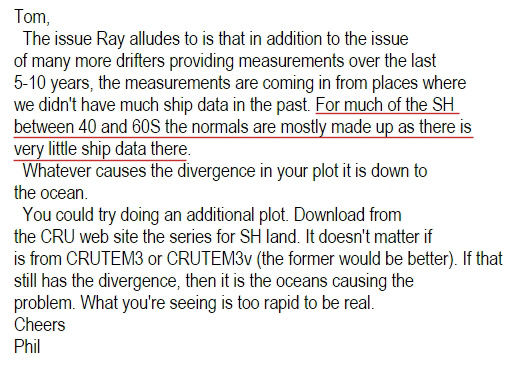
Southern Hemisphere Sea Surface Temperatures ‘Mostly Made Up’
Dr. Phil Jones, overseer of the Climate Research Unit temperature data, even admitted in an intercepted e-mail that the sea surface temperature data in the Southern Hemisphere temperature record are “mostly made up”.
The Leaked Hide the Decline Conversations With Dataset Overseers
“…you really ought to replace the values from 1961 onwards with observed [instrumental] temperatures due to the decline.”
“I’ve just completed Mike’s Nature trick of adding in the real temps to each series for the last 20 years (ie from 1981 onwards) amd from 1961 for Keith’s to hide the decline.”
“Also we have applied a completely artificial adjustment to the data after 1960, so they look closer to observed temperatures than the tree-ring data actually were” …. “Also, we set all post-1960 values to missing in the MXD data set (due to decline), and the method will infill these, estimating them from the real temperatures – another way of ‘correcting’ for the decline, though may be not defensible!”
Dataset Overseers ‘Hide The Decline’ In Temperatures By Changing Data
It is likely that the reason why today’s global temperature reconstructions show such strong warming in recent decades (and rather unremarkable rise in the early 20th century) is that they have been heavily adjusted to match climate model expectations. The adjustments cool the past and warm the present to fit with the explosive linear trend in anthropogenic CO2 emissions.
For example, the combined Hadley Centre and Climatic Research Unit (HadCRUT) data set — which is featured in the Intergovernmental Panel on Climate Change (IPCC) reports — underwent a revision from version 3 to version 4 in March of 2012. This was about a year before the latest IPCC report was to be released (2013). At the time (early 2012), it was quite inconvenient to the paradigm that HadCRUT3 was highlighting a slight global cooling trend between 1998 and 2012, as shown in the graph below (using HadCRUT3 and HadCRUT4 raw data from WoodForTrees).
Graphs used by the IPCC depicting a slight cooling trend since 1998 would not be acceptable to policymakers wishing to emphasize the urgency of addressing dangerous global warming. So, just in time for the 2013 edition of the IPCC report, about 0.1°C was added to the 1998-2012 HadCRUT trend. The effect was to transform the slight cooling into what the IPCC called a “hiatus” from warming. To achieve the removal of the slight cooling trend found in HadCRUT3, the more recent anomalies in HadCRUT4 were warmed up (by 0.1 to 0.2°C), whereas the past warmth (especially around 1998) was left intact. The effect was to warm the present and cool the past.
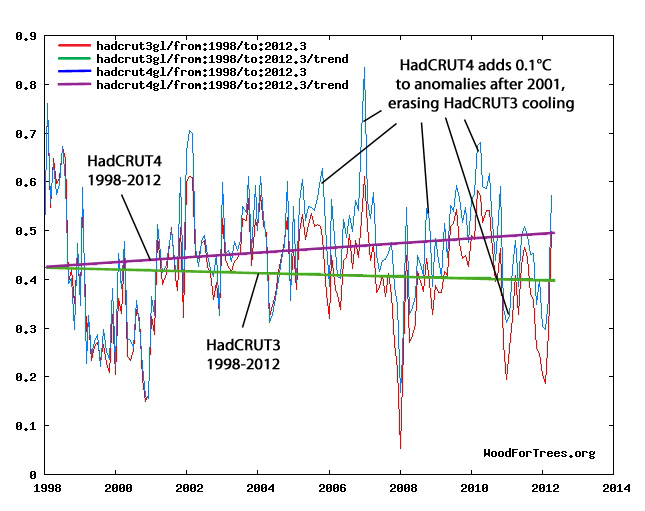
Source: WoodForTrees
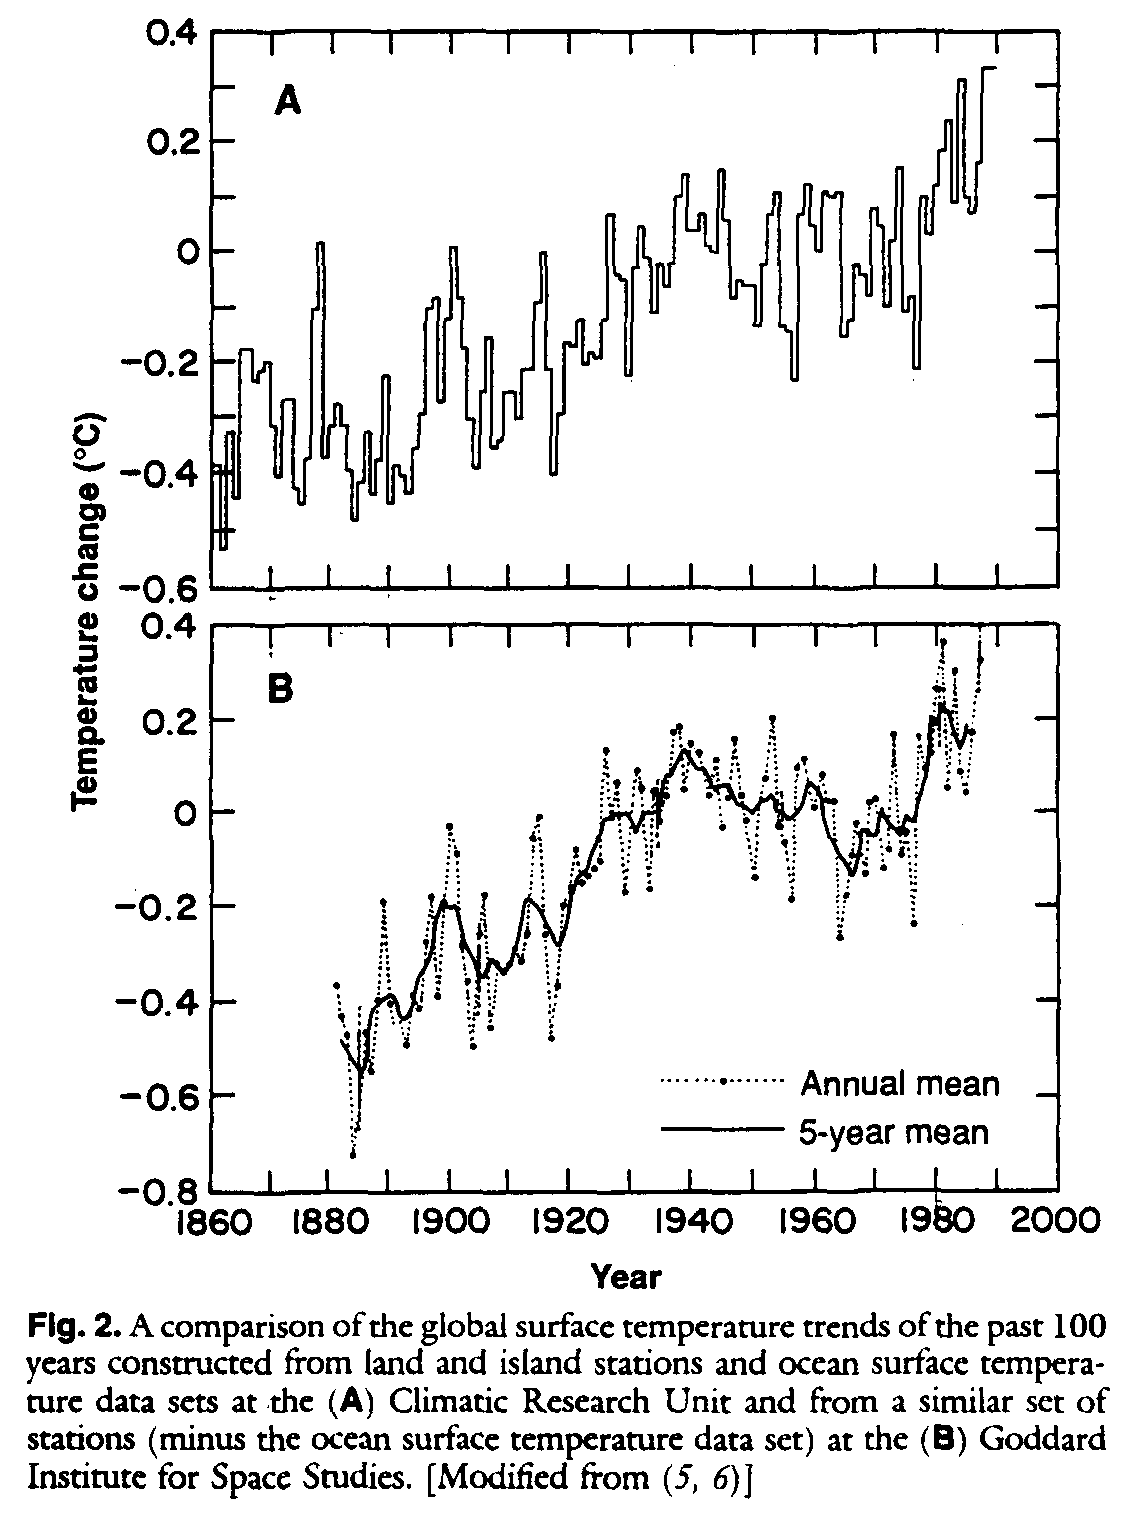
Artificially Removing 0.5°C From The 1880-1950 Warming
As recently as 1990, it was commonly accepted that there was pronounced warming of about 0.5°C between the data points 1880 and 1950.
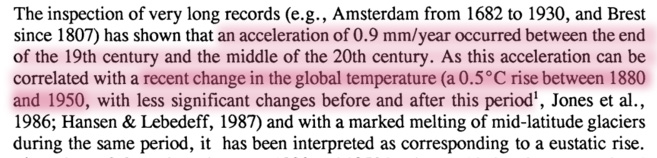
Image Source: Pirazzoli, 1990
This 0.5°C rise in global temperatures between 1880-1950 (and 0.6°C between 1880 and 1940) can clearly be seen in the NASA GISS graph from 1987:
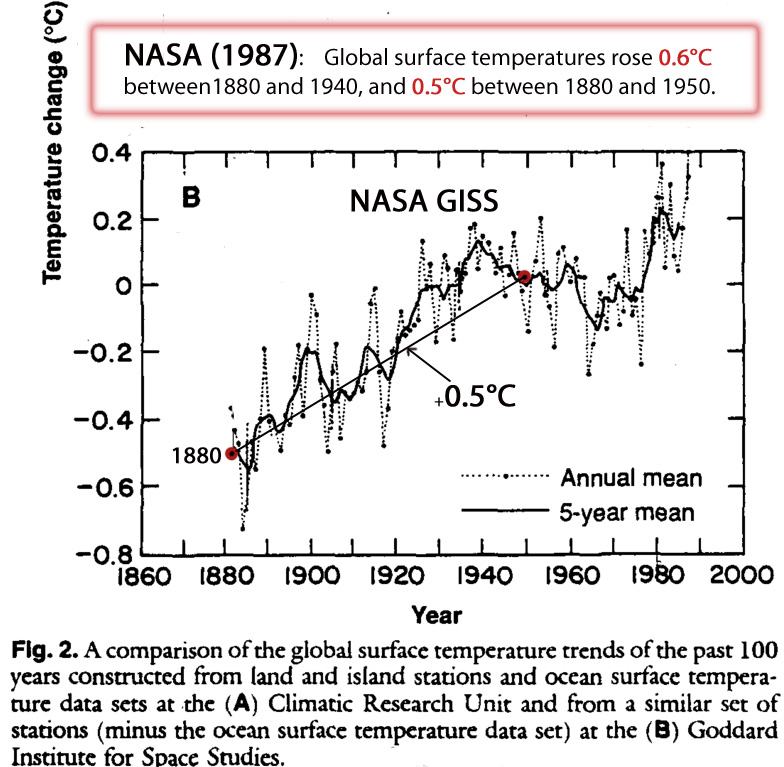
Schneider, S. H. 1989 Science 243: 771-81.
By 2014, the 0.5°C of warming between the years 1880 and 1950 had been completely eliminated. There is now no trend between those two data points.
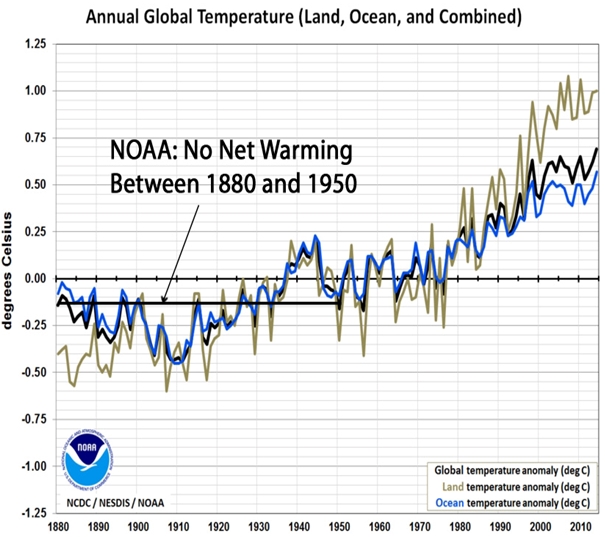
Image Source: NOAA (2014)
What Warming Hole?
The portrayal of a globally-synchronous warming of the Earth with only small pockets of “warming hole” anomalies is not supported by local and regional data reported in scientific papers.
There are not tiny, isolated holes of cooling in an otherwise uniformly-warming world. These are gaping expanses of cooling…or non-warming.
Yes, some regions of the globe have been warming. Some regions have been cooling. And some regions remain trendless.
But in recent decades, the warming has not been global in scope.


So you’ve gone full Tony Heller today. Noted 😉
Have fun in conspiracy bubble land with all these made up claims.
This is what no warming looks like?
https://pbs.twimg.com/media/DWJhsQaX4AAd0y7.jpg:large
Before you ask, no you won’t get “counter points” from me (most of what is posted here isn’t new and has been discussed before, look it up). The expectation that skeptics can come up with anything and others have to spend time fact checking everything they say, is a bit ridiculous. A form of denial of service attack if you will.
So long.
More cognitive dissonance from our resident troll.
Berkeley is EASY to refute.
They use as much JUNK DATA as they can get then use every trick under the sun to FABRICATE a warming trend
That was their INTENT from the very start.
To out-adjust the NCDC/NOAA/GISS troup.
I just do not get you SebH.
Somebody has to be paying you to refute every article and comment that gets posted on NTZ.
“Somebody has to be paying you to refute…. “
Then they are paying him for ABJECT FAILURE. !!
With his IGNORANCE, and constant EVASION of BASIC QUESTIONS, seb has converted more people to “non-believers” in the AGW scam than any other mindless troll could possibly have done.
His GROSS INCOMPETENCE and BRAIN-HOSED EMPTYMESS makes him a total laughing stock to anyone that wastes their time reading his ranting, incoherent, anti-science garbage.
Who is paying the authors and commentators posting here? I do that because duty calls, when I have time between more important stuff than jousting with skeptics: https://xkcd.com/386/
“Going full Tony Heller….”. Translated: I can’t refute Tony Heller.
Tony Heller is easily refuted. The translation is more like “the conspiracy theorist in you won”.
Steve Mosher and Nick tried to take on Tony, only to get whacked so bad that they slink away. You never saw the refutations Tony made when I told him what they were saying about him at WUWT.
You have not seen where I took down Nick Stokes in a thread last year where I could call him a liar to his face in the thread and not be stopped by mods. I gave overwhelming evidence that the USHCN data base was active and updated every day, while he kept saying it was obsolete and not updated.
He was lying like hell.
You have no idea how far off the mark YOU are on this since you have yet to acknowledge the obvious IPCC failure for PER DECADE trend, for their less snow forecast of 17 years ago. For increased severe storms predictions, etc…..
You like Steve, Nick and yourself are too cowardly to visit Tony’s site to challenge him. Tony who has TWO College degrees, a long record of environmental advocacy and a former Forest ranger, is up to the challenge for debate.
Again, the idea that any nonsense that someone comes up with needs to be challenged or otherwise it’s true is ridiculous.
But please, be non skeptical about anything he writes. If that makes you feel better 😉
Ha ha ha,
YOU, Nick and Steve among others NEVER visit Tony’s site to challenge him. You are too scared to challenge him there.
You have never been there, you have no idea how he destroyed Nick’s bull crap. I was the go between two websites to help take down his lies and disinformation.
I was the one who told Tony, what Nick over at WUWT was saying over Tony’s charts being adjusted presentations. Tony then over FIVE blog postings destroyed Nick, using Nick’s own convoluted words and the NOAA database. You speak from ignorance over this because you are uncritical and not skeptical about anything.
Nick stopped his bullcrap when many others were noticing Tony destroying his arguments so well. Ever since then there have been a lot more people challenging Nick, since he pushes a lot of misleading baloney.
He stopped suddenly when I gave him the “coup de grace” by PROVING that he is a flat out liar over something he kept saying was obsolete and out of date.
The EMPTY squirming non-entity that is seb.
Cannot put up a rational scientific counter, because he doesn’t know what either “rational” or “scientific” even mean. !!
I have regular checked all the data and calculations TH has done. He gives links to everything. He is rarely wrong, and will correct himself if he does make an error.
Its called HONESTY.
Again, another word that can never be used to describe you, seb.
@Andy
Let’s have some fun.
Maybe SebH would like to “easily refute” this Tony Heller?
https://m.youtube.com/watch?feature=youtu.be&v=BoaLEDgeR1c
Courtesy of pmc47025.
You have been a good boy. Here is a treat for you <o))–(–(c-<
BTW: I have no idea who Nick and Steve are that you are talking about. But I doubt that this Tony Heller figure could "destroy" anyone. I mean look at what he posts, how he writes, his videos … it's laughable. But it's interesting that someone like that has fanboys like you. Enjoy the fish.
AndyG55:
Really, care to give examples of those instances this happened? I’d love to check them out …
So seb ,
EMPTY of all refutation.
Just EMPTY.
You could find any check them for yourself, ..
.. but you don’t have that ability, do you. !
Go over to his site and take him on. He’s engaging and always up for a challenge.
Heller, 2016
https://www.sciencedirect.com/science/article/pii/B9780128045886000033
It is widely accepted that there has been about 1.5°C surface temperature warming across the planet since about 1880, and this is causing polar ice to melt and an increase in the frequency of hot days. Multiple data sets from NOAA, NASA, and CRU show approximately the same behavior.
However, earlier versions of the same data sets from the same organizations showed much less historical warming. Historical data has been systematically altered over the past 15 years to cool past temperatures and increase more recent temperatures. The amount of warming from 1880 to 2000 is now shown by NASA as double what was shown in 2001. Going back further to the 1975 National Academy of Sciences report, we see a completely different story—where all 1900–40 warming was lost by 1970.
Mr. Richard, I doubt he is even aware of the brutal take down of Nick Stokes baloney he had posted at WUWT.
Tony Heller, over FIVE postings deal with Mr. Stokes obvious red herring and disinformation with a few lies, showed that NICK was being dishonest.
There were many others commenting there who were exposing Nicks baloney as well.
You are right, I am not aware. Reading Notrickszone is enough … don’t need to start reading WUWT. I wanted to know what happens outside my bubble, not be contaminated with stupid.
“not be contaminated with stupid.”
roflmao.
You just described your whole pitiful existence, seb.
IGNORANT, EMPTY and STUPID.
And you seem absolutely DESPERATE to remain that way.
“You are right, I am not aware”
You said it, seb
You are WILFULLY and BLISSFULLY UNAWARE Of ANYTHING to do with REALITY.
You are the one who FIRST brought up Tony Heller:
Very first comment in the thread,
“So you’ve gone full Tony Heller today. Noted 😉
Have fun in conspiracy bubble land with all these made up claims.”
and,
“Tony Heller is easily refuted. The translation is more like “the conspiracy theorist in you won”.”
You say this yet somehow you magically know Tony is wrong, despite NEVER being at his blog.
“BTW: I have no idea who Nick and Steve are that you are talking about. But I doubt that this Tony Heller figure could “destroy” anyone. I mean look at what he posts, how he writes, his videos … it’s laughable. But it’s interesting that someone like that has fanboys like you. Enjoy the fish.”
You are making it clear you are a hypocritical world class BIGOT!
Many there thinks Nick Stokes was wrong, that yes he was smashed by Tony in his FIVE blog postings and I smashed him over this comment which he quickly vanished because then it was proven that he was lying his asses off, made a fool out of him with his PHD in Mathematics.
“sunsettommy October 5, 2017 at 1:40 pm
I make a big deal about Nick calling USHCN OBSOLETE,when there is evidence straight from the NOAA that it is not. I just posted a link to the file showing that it is being updated DAILY for Precipitation,Maximum/Minimum temperature and T average. The last update was today for those values,which is OCTOBER FIVE TWO THOUSAND SEVENTEEN. (October 5,2017)
Tony was correct all along when he said it is updated DAILY,you denied it by calling it obsolete. You clearly said it wasn’t being updated either.
Nick writes,
“It’s simple, and just wrong. There were (USHCN has been obsolete for years) 1218 stations in the final set.”
and,
“This gets weirder. The two sections you quote in detail describe USHCN vers 1 and 2. They don’t even get up to 2.5, the most recent version. Doubly obsolete.”
You keep fighting the NOAA on it where they say it is being UPDATED,with Version 2.5 then you missed the current 2.5.5 version which you probably never saw since you think USHCN is he he…. snicker…. obsolete.
USHCN is being updated DAILY,which means it is still being maintained and updated. This means the NOAA doesn’t consider it obsolete,as they spend effort on it daily to keep it updated and make that data available for downloads.
You need to stop here since I have destroyed your stupid Obsolete argument with proof from the NOAA themselves.
Here is current Version 2.5.5 that is updating daily. Here is that link,Nick didn’t bother to bring up since it destroys the stupid Obsolete claim he keeps making against USHCN. I wonder if you didn’t even know this current version exist since you were saying version 2.5 wasn’t even online yet.
ftp://ftp.ncdc.noaa.gov/pub/data/ushcn/v2.5/ ”
Your shot in the foot admission,
“You are right, I am not aware. Reading Notrickszone is enough … don’t need to start reading WUWT. I wanted to know what happens outside my bubble, not be contaminated with stupid.”
You have no standing in saying Tony is wrong when you NEVER see original articles he writes, because according to YOU, you never visited his blog.
No you are a coward to debate there with many accredited scientists and others who have science degrees.
Tony Heller has a GEOLOGY degree, Electrical Engineering Masters and is a world class computer expert who worked for Intel and NCAR.
You have a PHD degree in hypocrisy and intellectual dishonesty.
Sebastian and readers can see the thread about Nick being exposed as a liar, starting with this comment:
https://wattsupwiththat.com/2017/10/04/quote-of-the-week-anonymous-cowards-please-take-note/comment-page-1/#comment-2627924
There is another thread where he was schooled by several people over several OLD temperature charts that Nick fought against. Charts that were well known and real back in the 1970’s.
“Nick Stokes September 26, 2017 at 3:53 pm
Steven Goddard produces these plots, and they seem to circulate endlessly, with no attempt at fact-checking, or even sourcing. I try, but it’s wearing. The first GISS plot is not the usual land/ocean data; it’s a little used Met Stations only, essentially an update of a 1987 paper. I don’t know if it’s right. But the second shows what is claimed to be a NCAR plot, or at least based on NCAR data. That plot isn’t from any NCAR publication, and the data is not available anywhere. Instead it is from the famous Newsweek 1975 article on “global cooling”. And that just said it was a temperature plot; didn’t even say what it was temperature of. From the context, it seemed to be US, which figures. There was very little digidised global data in 1974.”
https://wattsupwiththat.com/2017/09/26/gavins-twitter-trick/#comment-2621310
He was really terrible there.
Honestly sunsettommy,
who cares? What do you expect from me by telling this story? It doesn’t matter. Nothing of this matters. All you can think of is conspiracy here, conspiracy there. Who would want to engage you at that level?
I don’t have to religiously read his blog to know that. You (all) post links to his blog/videos often enough. It’s a joke. Seeing someone like him as an authority and then downplay anything real scientists say as fake.
That’s not the behaviour of skeptics.
And yet NOT ONE SINGLE FACT to repute what TH says.
That is the seb method…
Just yap mindlessly, ZERO CONTENT
seb , you are not even a joke, more like an EMPTY FARCE.
Mindless slapstick is your meme.
You probably think this is peer-reviewed science, do you?
Kenneth writes to you advising,
“Go over to his site and take him on. He’s engaging and always up for a challenge.”
Snicker.
Instead you say this which shows how uninterested you really are about science research:
“You probably think this is peer-reviewed science, do you?”
All I see here is that you have nothing to answer Tony Heller with, NOTHING!
So, Just another mindless science-free yap, from you, seb.
We expect NOTHING more.
I remember when one of Tony’s videos was linked.
You ran around like a headless chook, then, too.
You were asked to quote a time on the video and say why it was incorrect, producing actual science to back up your claim.
YOU FAILED MISERABLY then, seb…
… just as you ALWAYS DO when it comes to ANYTHING to do with real Science or Physics.
You couldn’t refute a wet paper bag, seb !!
Neither can Nick. Nick loves to “play” with numbers, but its easy to see through his dishonesty and twisting.
Come on seb,
The Only graphs from TH above are the NOAA temperature charts.
One shows NO DATA over a point in Africa, the other shows “record” heat on the same point.
Do you DENY that this is the case ?
Are you really that WILFULLY BLIND ?
Is this your sort of “acceptable” science ???????
Don’t worry, JL. The resident activist chatbot troll will refute Tony Heller “easily,”
…….any century now.
lololol (but don’t hold your breath waiting)
Present one claim of his
See! he is too scared to visit Tony’s place and challenge him there.
It is easy to find it Sebastian, since he has been exposing it for several years now.
Come on don’t be scared……..
Riiight, sunsettommy, and too bad there’s nothing in the above article for him to analyze, ….oh, wait.
Are you too lazy to find one thing he claims?
There is nothing in the article, correct yonason.
Let’s take this video second by second, shall we?
https://www.youtube.com/watch?v=e4qqZqZbbig
0:55 – Al Gore didn’t predict that, he cited a scientist
1:36 – Hansen used a climate sensitivity value that was higher than the actual one. It’s like those scenarios we use today for the different possible future emissions. If you care, read https://skepticalscience.com/Hansen-1988-prediction-advanced.htm (it’s safe, but be warned, you could actually learn something).
[skipping all the prophet/religion BS]
8:00 – https://www.ncdc.noaa.gov/monitoring-references/faq/temperature-monitoring.php … the data and the algorithms are available. You can do your own calculations on them or you could just call it fake because you don’t like it. This paper describes the correction that he calls fake: https://www1.ncdc.noaa.gov/pub/data/ushcn/papers/karl-etal1986.pdf … so please, tell us what is fake exactly? But then again, it is Tony Heller, who seems to be convinced that there is a conspiracy faking all the data 😉
[skipping more prophet/religion/global cooling BS]
Well I probably missed a few things, but I had to skip around … can’t stand the voice of Mr. Heller.
Let’s look at his website, shall we?
Science : UHI And El Nino Caused by CO2
He tries to refute a study that says mega cities experience an increase in short-term highest temperatures. “Hottest-day-of-the-year measurements for major cities such as Paris, Moscow and Tokyo climbed precipitously by as much as 0.60 degrees per decade during the period studied.” is a sentence from the study. Notice the names of the cities brought up?
What does he present? The “frequency of hot days” which is quite different from the claim made and on top of that it’s from the U.S. only. Not even reduced to U.S. mega cities …
It’s completely missing the point.
Well, since it is ok for this guy to use US only data, here is some China only data as “rebuttal” 😉
http://onlinelibrary.wiley.com/doi/10.1002/joc.1989/pdf
Australia?
https://journals.ametsoc.org/doi/abs/10.1175/JCLI-D-12-00383.1
He then uses the same argument Kenneth often employs: “it happened in the past in the same or much worse way, so today’s [whatever] isn’t special” …
Does he implicate that he is no climate expert? Because he surely must thing that he is “based in reality”, right? But what do I know, I just see a guy who used the wrong set of data to refute something.
Going further down on the first page of his blog I see the Acc. SMB graph for Greenland Kenneth so often uses to claim that Greenland’s ice mass is not decreasing. Apparently Tony Heller also ignores the other side of the equation:
Yeah, how could it possible “accelerate” (let’s put it in quotation marks, makes it sound less true, doesn’t it)?
Well, for one ice mass is decreasing, they aren’t gaining ice: https://climate.nasa.gov/vital-signs/land-ice/ … and then there is the thing called thermal expansion and even he should know that the OHC is increasing … or is that fake too?
He references this article. It tells a different story than the GRACE data from the same organisation and then there is this:
https://www.carbonbrief.org/qa-is-antarctica-gaining-or-losing-ice (contains lots of paper links to studies with more recent data)
and https://www.mediamatters.org/research/2015/11/04/nasa-scientist-warned-deniers-would-distort-his/206612
That study ends with the year 2008, and we have more recent data indicating Antarctica lost way over 100 bn tonnes of ice per year between 2010 and 2013.
Sea level rise is accelerating:
https://www.nasa.gov/feature/goddard/2018/new-study-finds-sea-level-rise-accelerating
Now go and comment about the emptiness of what I have written, how wrong I am just because and whatever you usually reply. Or begin see Tony Heller as what he is, fraud and kind of an attention whore. Someone who believes that because all radiation is already absorbed by greenhouse gases in the atmosphere and increase of those gases can not possibly cause a change in the radiative balance. Someone who is very US-centric despite it being called global warming for a reason.
Why are you writing this here, SebastianH? You know that nobody here is persuaded by your links to smear sites and blogs like SkepticalScience and mediamatters and carbonbrief. Why not take your “challenges” over to Tony Heller’s blog yourself? What are you concerned about? I could easily take apart each and every one of your “arguments” above. But it’s just not worth the time it would take to do so. Speaking of…
Didn’t you just write this about 15 hours ago:
Since then, you’ve posted dozens of times and apparently spent at least a half an hour trying to smear (and “rebut”) Tony Heller…to no avail. Why? What is this doing for you?
So much junk in one mindless seb ranting
Hilarious
0.55.. Gore said it, he was wrong, that comes from citing idiot AGW non-scientists.
1:36..Stop citing SkS , it is a puppet site. Meaningless.
8:00 “found no evidence that the U.S. temperature trend is inflated by poor siting of stations” found no evidence that the U.S. temperature trend is inflated by poor siting of stations”
Of course they didn’t.. they didn’t look very hard. Surface stations are a MESS and everybody knows it..
China’s long term temperatures make a mess of any of your blank links.
https://s19.postimg.org/lz3vfut83/China_long_term_temp.png
Australian temperatures are subjected to the same “process” that was invented to “adjust data.
Late 1800’s was the WARMEST time in Australia’s history.
TOBs adjustment in the USA has been shown to be one of the biggest frauds perpetrated
https://realclimatescience.com/2017/05/the-wildly-fraudulent-tobs-temperature-adjustment/
REAL data not some modelled garbage from NCDC.
You really should be skeptical of ANYTHING NCDC put out, they are the very start of the AGW farce when it comes to temperature adjustments.
Do you have any data for ice loss from Greenland, to balance the SMB GAIN.? Nope??
You do know that Greenland’s ice area is only just a TINY amount down from its greatest extent in 8000+ years, don’t you..
or are you wilfully IGNORANT there as well?
https://s19.postimg.org/ceo16fi7n/Greenland-Ice-Sheet-Briner.jpg
GRACE data has been shown to be wildly inaccurate of volcanic regions, of which Antarctica, Greenland. etc are two main ones.
Antarctica has been COOLING over any time period, so any measured or fabricated loss is NOTHING to do with global warming or CO2, could it be that it covers a highly active volcanic region ;-).
https://s19.postimg.org/yubej7oyr/ant-ta-monthly-1979-2016-11-01.gif
https://s19.postimg.org/nn6qmzrb7/antarcticacooling.gif
Here is a graph of the Antarctic Total Ice mass since 1900, any changes are tiny as your mind.
https://s19.postimg.org/nqmm3ck8j/Antarctic_Ice_Mass.png
Sea level is DECELERATING. It is true ANTI-SCIENCE to splice fabricated satellite data onto real tide data, you KNOW that, why do you keep up with the mathematic deceit?
https://s19.postimg.org/e6i9l8lxf/IB-5yr-all.png
Then you follow your ANTI-FACTS with a slimy hit-piece full of LIES written by some total moron unable to counter anything with actual science.. (a mate of yours no doubt)
And as shown before, there is ABSOLUTELY NO REASON to call anything “GLOBAL WARMING” because for large parts of the globe.. IT ISN’T WARMING
Only places that have some warming in the satellite era are those directly affected by ocean cycles and events.
Only FRAUD around here is YOU, seb,
All you do is PARROT, like a Norwegian Blue, presenting ALL the erroneous AGW crap you can find.
You cannot even support the very basis of your brain-numbed AGW belief.
All in you MINDLESS EVASION of the very central point.
THERE IS NO CO2 WARMING IN THE WHOLE OF THE SATELLITE DATA
THERE IS NO EVIDENCE OF CO2 WARMING oceans, atmosphere or anything.
“[skipping more prophet/religion/global cooling BS]”
ie…. Evidence is TOO STRONG for even seb’s hallucinogenic fantasies. !!
He has ZERO COUNTER for the facts.
““Hottest-day-of-the-year measurements for major cities such as Paris, Moscow and Tokyo climbed precipitously by as much as 0.60 degrees per decade during the period studied.” ”
The IDIOT here is Tim Radford (a mindless far-left journalist with basically ZERO EDUCATION in any hard science… just like seb) for pretending not to know anything about the LARGE Urban Heat Effect in LARGE cities.
“especially in crowded cities that are home to more than 10 million”
there’s a small hint there somewhere 😉
Only 0.6C.. what the heck is keeping those temperatures down like that !!!
Or is seb going to DENY UHI exists and is very strong over LARGE cities?
Is seb going to DENY that the last 2-3 years has been a transient from a very strong EL Nino?
Is seb going to continue to DENY that THERE IS ABSOLUTELY NO EVIDENCE that CO2 warms oceans, atmosphere or anything.?
IGNORANCE and DENIAL are seb’s only attributes.
——-
We already KNOW that there has been ZERO warming Japan since 1998
https://s19.postimg.org/s9bwikr0z/Japan_post_1998.png
And apart from a slight step around 1990-1998, no warming from 1950-1990
https://s19.postimg.org/6kzq5cxdf/japan1950-1990.png
So heat in Tokyo is NOT due to “global” anything.
—–
Let’s look at some real data from around Russia.
https://www.john-daly.com/ges/surftmp/stations/korf.gif
https://www.john-daly.com/stations/murmansk.gif
https://www.john-daly.com/stations/kirensk.gif
https://i1.wp.com/www.trionfopublishing.com/images/vytegra.gif
OK, so NO SIGN Of any “warming”, let alone “global” there.
Could it be that Moscow has a growing population of over 12 million ??
@sunsettommy
The activist chatbot troll wrote…
BUT, from the above article we have…
…insert NOAA MAP OF WORLD ON FIRE…
…followed by ANOTHER MAP WITH ACTUAL TEMPERATURE MEASUREMENTS…,
after which we read…
What it proves is…
1. that the extraordinary heat NOAA shows for the area in the first image is based on…NO DATA. IT WAS MADE UP OUT OF WHOLE CLOTH. It isn’t real.
2. there is nothing in the chatbot’s empty little head.
@Kenneth Richard 20. February 2018 at 3:13 AM
Note that some of my “quotes” of him are paraphrased, but nothing is lost in so doing, since he never ends up saying anything worth remembering.
Many of SebH’s arguments are boiler plate distraction. They go something like this… “A skeptic said such-and-such, but NOAA said the opposite, so why do you believe the skeptic?” No logic, just toxic smoke and broken mirrors. You can’t answer something like that with logic, or facts, because it is so deliberately vague. So that gives the naive ones the impression he’s made a point you can’t answer. But of course you can’t answer, because there is NO clear answer, and that’s the point of his arguments: to give the impression he’s said something important, when he’s said nothing at all.
Then there’s his “NOAA has equations, and you can solve them for yourself.” Well, fine, but what he leaves out is that their models are equations that are always wrong, so why should any of their other equations help? He employs a pseudo-logic that always breaks down on close inspection. Never anything substantial.
Oh, and here’s a real beauty – “0:55 – Al Gore didn’t predict that, he cited a scientist” LOL, so Al Gore AND “a scientist” were BOTH wrong. Now if that’s not getting to the heart of the problem, I don’t know what is. (rolls eyes)
Nope, never anything substantial – just bluff, bluster and b.s.
You end that comment by asking SebH “What is this doing for you?”
I’m guessing he’s one of those people who just likes to be annoying (most activists seem to share that pathology). He is very good at THAT. He might be getting paid to, as well. After all, Soros is paying anti-Trump protestors, so why not anti-AGW trolls, as well? Or, he may just want to impress someone. Who knows? WHO CARES?!
“Hansen used a climate sensitivity value that was higher than the actual one”
Obviously..
That is because the real sensitivity is indistinguishable from ZERO.
There is NO EMPIRICAL EVIDENCE that temperature sensitivity to doubling atmospheric CO2 is ANYTHING BUT ZERO.
“Or, he may just want to impress someone.”
I suspect that the ONLY person he is trying to impress IS HIMSELF.
And he keeps FAILING MISERABLY.
ALWAYS coming up EMPTY or worse than EMPTY, like that parrot-like rant above.
He is desperate that he cannot even produce evidence of CO2 warming.
NONE, NADA.. EMPTY
Predictable replies …
Kenneth:
I know and that doesn’t invalidate the information provided there. Otherwise, what should we think of information presented on blogs like from that Tony Heller figure or notrickszone itself?
You couldn’t and as AndyG55 demonstrates in this thread, it’s easy to miss the point. You are missing the point a lot, so I have no confidence in that. You’ll likely bring up some weird reconstructions or derail the conversation towards gravity causing warmer surface temperatures, not the GHE (one of Tony Heller’s other main talking points).
I sometimes have free time between making great software. And who could resist a sunsettommy/yonason challenge. They definetly succeed in trolling me nearly every time 😉
@AndyG55:
Nice try … but you are missing the point on nearly everything I have written and you don’t even recognize it. I definetly love how you keep bringing up the past Greenland ice mass reconstructions. Whatever that has to do with what is happening today. Things like these demonstrate that you don’t really have a clue. You are just a pretender (as should be obvious when debates are about physics). Go back surfing or whatever it is you do. You are likely better at that than posting about climate science.
You wrote that sea level is decelerating and posted an outdated graph made by “The inconvenient skeptic”. See if you can find any deceleration in the actual data of satellite measured sea level. Also, the recent finding of accelerating sea level rise includes the tide gauges …
That is simply not true, no matter how often you and Kenneth and others repeat it here.
And why do you keep mixing in that foul language and sentences in CAPS all the time? Do you think that makes what you say less incorrect?
There is no “evidence”. Evidence of what anyway? What this video contains is a person trying to depict climate science as religions with prophets and stuff. What exactly does he think he is? Looking at the replies here, he is definetly the Messias for some here …
Sure, no warming in Japan … https://www.env.go.jp/policy/hakusyo/h19/html/hj07010100.html #facepalm
Don’t call that “a step” and be done with it. This is how warming looks like, you can’t ignore steps no matter how hard you wish you could.
@yonason:
Same question to you, do you think writing in all caps makes your claim less incorrect?
Those two images represent different interpolation levels of sparse data. You could also claim that we know nothing about temperaturein the area between two stations that are just a few kilometers apart. We really don’t. We interpolate.
Calling that “fake” is really weird. As if someone else had different data that would definetly show a completely different picture from those interpolations. Also, the way these pictures are generated is well described. As with temperature adjustments, I dare you (or him) to make his own maps.
Oh you mean it’s “word against word”? Why do you believe the skeptic? You obviously can’t be bothered to actually check anything he says and believe it blindly? Why? At least the science community is open about how they arrive at there conclusions. It’s not just a bunch of wannabes screaming fake all the time.
That is exactly what Tony Heller does and the commenters here do it too. I am definetly guilty of doing that sometimes too, but the level of “saying nothing” is pretty high in your bubble. That’s one of the things I found out very early when I started reading this blog 😉
You are missing the point again. The process of arriving at the adjusted temperature values is well documented. Examine it, improve it, show what exactly is wrong. Don’t just call it fake. That’s the point!
You know, that one is getting old. You can’t just call everything you dislike “not substantial”.
We actually had a discussion about what Al Gore really said in that instance in the past. He cited a scientist that predicted XY if ABC. It’s not wrong to do that. It’s like you saying that blogger XY says there is no global warming / climate change if everything is fake. Problem is, it’s not fake (no matter how often you repeat that).
https://xkcd.com/386/
Keep your conspiracy theories to yourself. What is your motivation to post what you post? To not question anything that your “prophets” present you as their truth and then pretend on the other hand that you are a skeptic surely needs a motive, doesn’t it? How do you justify this cognitive dissonance? What do you get from it?
P.S.: Until tomorrow. Have fun playing pretend-I-know-more-than-scientists …
I could easily take apart each and every one of your “arguments” above.
———————————————————
There is no such thing as the “actual” climate sensitive value. They are all estimates, ranging anywhere from 0.00 K with doubling to 10 K with doubling, and they are rooted in models and assumptions. Here are 80 papers with very low climate sensitivity estimates.
Can we assume you are also a believer in Hansen’s prediction that we will get 10 feet of sea level rise by 2065 due to the catastrophic melting of the Antarctic and Greenland ice sheets?
Earth’s Most Famous Climate Scientists Issues Bombshell Sea Level Rise Warming
“The study—written by James Hansen, NASA’s former lead climate scientist, and 16 co-authors, many of whom are considered among the top in their fields—concludes that glaciers in Greenland and Antarctica will melt 10 times faster than previous consensus estimates, resulting in sea level rise of at least 10 feet in as little as 50 years.”
According to a new paper, Greenland and Antarctica combined to contribute 0.59 of an inch to sea levels in the 56 years between 1958 and 2014. But according to the very same scientist you are defending here (by linking to the blog of John Cook), we will get about 2.5 inches of sea level rise per year due to catastrophic Greenland and Antarctica melting. Again, can we assume you are a believer?
That’s the effect of urbanization. More roads, asphalt, buildings. Cities warm up a lot more than countrysides do.
According to 1,407 temperature stations from across the contiguous 48, the U.S. has not warmed in the last 115 years.
Here are 15 graphs from 15 peer-reviewed papers from 2017 alone showing no warming in China during the era of AGW.
https://notrickszone.com/wp-content/uploads/2017/01/Holocene-Cooling-North-China-Li-17.jpg
–
https://notrickszone.com/wp-content/uploads/2017/05/Holocene-Cooling-China-East-Yangtze-Region-Li-2017.jpg
–
https://notrickszone.com/wp-content/uploads/2017/01/Holocene-Cooling-China-SW-Sun-17.jpg
–
https://notrickszone.com/wp-content/uploads/2017/03/Holocene-Cooling-Tibet-Dagze-Dong-17.jpg
–
https://notrickszone.com/wp-content/uploads/2017/05/Holocene-Cooling-China-SW-Tiancai-Lake-Zhang-2017.jpg
–
https://notrickszone.com/wp-content/uploads/2017/04/Holocene-Cooling-China-Southwest-Bi-2017.jpg
–
https://notrickszone.com/wp-content/uploads/2017/06/Holocene-Cooling-China-Northeast-Zheng-2017.jpg
–
https://notrickszone.com/wp-content/uploads/2017/05/Holocene-Cooling-Qinghai-Tibetan-Plateau-Chang-2017.jpg
–
https://notrickszone.com/wp-content/uploads/2017/06/Holocene-Cooling-Northern-Yellow-Sea-Nan-2017.jpg
–
https://notrickszone.com/wp-content/uploads/2017/04/Holocene-Cooling-Central-Asia-Tianshan-Mountains-Lan-2017.jpg
–
https://notrickszone.com/wp-content/uploads/2017/06/Holocene-Cooling-China-North-Shihua-Cave-Wang-2017.jpg
–
https://notrickszone.com/wp-content/uploads/2017/04/Holocene-Cooling-South-China-Sea-Deng-17-.jpg
–
https://notrickszone.com/wp-content/uploads/2017/05/Holocene-Cooling-China-East-Chaohu-Li-2017.jpg
–
https://notrickszone.com/wp-content/uploads/2017/06/Holocene-Cooling-Northern-South-China-Sea-Kong-2017.jpg
–
https://notrickszone.com/wp-content/uploads/2017/06/Holocene-Cooling-China-East-Yao-2017.jpg
————————————————————————————-
I do not claim that Greenland’s ice mass did not decrease during the 2000s relative to the 1961-1990 period, when the ice sheet gained mass (+40 Gt/yr) (Fettweiss et al., 2017), or relative to the 1940s to 2000s, when Greenland’s ice sheet contributed nothing (“a null contribution”) to sea level rise (Fettweis et al., 2017). Greenland contributed just as much, if not more meltwater between the 1920s and 1940s as it has this century. Why do you fail to consider the long-term context of today’s GIS meltwater changes? Why do you think there failed to be any meltwater contribution to sea level rise for the 6 decades between the 1940s and 2000s?
Greenland and Antarctica have contributed a staggering 0.59 of an inch to sea levels since 1958. Do you find that alarming, SebastianH?
Oooh. 100 bn tonnes. That’s really scary. Do you know how to convert that into sea level rise meltwater equivalent? If so, what is it?
East Antarctica gained 350 Gt (-0.32 mm/yr sea level reduction) between 2009 and 2011. Why do you think that happened, SebastianH, since you presumably think ice melt changes are caused by anthropogenic CO2 emissions?
http://onlinelibrary.wiley.com/doi/10.1029/2012GL053316/full
“Between 2003 and 2011, GRACE observed mass loss of the West Antarctic Ice Sheet and along the Antarctic Peninsula Trend maps reveal that the mass loss in West Antarctica is primarily located around Pine Island Glacier (PIG) (Figure 1). While several studies [e.g.,Rignot et al., 2008; Velicogna, 2009] indicate no significant changes in the East Antarctic ice sheet between 2002 and 2009, GRACE recently observes mass gain along the coast (Figure S1). A spatial average over the region where this mass gain is observed (30 W–60 E, 65 S–80 S) shows a relatively stable mass budget from 2003–2008, followed by a strong increase that began in 2009 (Figure 2). The cumulative mass gain observed by GRACE between early 2009 and 2011 is approximately 350 Gt, which is equivalent to about -0.32 mm/yr global sea level decrease.”
It’s only accelerating if one uses a starting point from a period of time when sea level rise was much slower. When looking at long-term trends, such as 80-100 years, the modern sea level rise has not been accelerating.
Parker and Ollier, 2017
https://link.springer.com/article/10.1007/s41748-017-0019-5
[L]ocal sea-level forecasts should be based on proven local sea-level data. Their naïve averaging of all the tide gauges included in the PSMSL surveys showed ‘‘relative’’ trends of about + 1.04 mm/year (570 tide gauges of any length). By only considering the 100 tide gauges with more than 80 years of recording, the average trend was only + 0.25 mm/year [2.5 centimeters per century].
The loud divergence between sea-level reality and climate change theory—the climate models predict an accelerated sea-level rise driven by the anthropogenic CO2 emission—has been also evidenced in other works such as Boretti (2012a, b), Boretti and Watson (2012), Douglas (1992), Douglas and Peltier (2002), Fasullo et al. (2016), Jevrejeva et al. (2006), Holgate (2007), Houston and Dean (2011), Mörner 2010a, b, 2016), Mörner and Parker (2013), Scafetta (2014), Wenzel and Schröter (2010) and Wunsch et al. (2007) reporting on the recent lack of any detectable acceleration in the rate of sea-level rise.
[T]he information from the tide gauges of the USA and the rest of the world when considered globally and over time windows of not less than 80 years […] does not support the notion of rapidly changing mass of ice in Greenland and Antarctica as claimed by Davis and Vinogradova (2017). The sea levels have been oscillating about a nearly perfectly linear trend since the start of the twentieth century with no sign of acceleration.
because for large parts of the globe.. IT ISN’T WARMING
The Southern Ocean represents 14% of the planet’s surface area. It’s been cooling since 1979.
Turney et al., 2017
http://www.clim-past.net/13/231/2017/cp-13-231-2017.pdf
Occupying about 14% of the world’s surface, the Southern Ocean plays a fundamental role in ocean and atmosphere circulation, carbon cycling and Antarctic ice-sheet dynamics. … As a result of anomalies in the overlying wind, the surrounding waters are strongly influenced by variations in northward Ekman transport of cold fresh subantarctic surface water and anomalous fluxes of sensible and latent heat at the atmosphere–ocean interface. This has produced a cooling trend since 1979.
About 1/3rd of the Northern Hemisphere has been cooling since 1990…
https://notrickszone.com/wp-content/uploads/2018/02/Northern-Hemisphere-1990-2015-Cooling-Regional-Kretschmer-2017.jpg
Since 1940s/50s – no warming
Northern Hemisphere – no warming
Arctic Region – no warming
Greenland – no warming
South Iceland – no warming
North Iceland – no warming
Alaska – no warming
New York – no warming
Rural U.S. – no warming
Northern Europe – no warming
Western Europe – no warming
Mediterranean Region – no warming
Finland and Sweden – no warming
East Antarctica – no warming
North Atlantic – no warming
Western North Atlantic – no warming
Brazil – no warming
SE Australia – no warming
Southern South America – no warming
Andes Mountains – no warming
Chile – no warming
My reply to this somehow vanished, if a moderator would be so kind …
“because for large parts of the globe.. IT ISN’T WARMING
seb yaps….. That is simply not true,
It simply IS TRUE, no matter how much you DENY the REAL DATA.
All the rest of your mindless bluster is pure yapping garbage. with zero science to back it up.
Greenland is only just a tiny amount down from its maximum in 8000 years
Arctic sea ice extent is above what it has been for 95% of the Holocene.
Tide gauges show deceleration of sea level rise. Get over it.
Why produce an “enviro” page for Japanese temperature when the REAL DATA is available and is shown in the graphs I produced. You fool yourself, no-one else.
NO warming from 1950-190 , slight step (not CO2) then NO warming since 1998.
“Evidence is TOO STRONG for even seb’s hallucinogenic fantasies. !!”
I rest my case.. just bluster in response.
What is also true is that there is absolutely no empirical evidence that enhanced atmospheric CO2 causes any warming of anything, water, atmosphere…. ANYTHING
Your continue juvenile ranting diversions and EVASIONS of the central FALLACY of your mindless religion are getting more and more ridiculous. 🙂
And as for me missing the point..
Sorry, seb… It is YOU that is TOTALLY POINTLESS.
“(as should be obvious when debates are about physics). “
You don’t even PRETEND to know anything about physics.
You just MAKE IT UP as you go along.
Its quite hilarious to see you floundering like a stunned mullet as soon as the level of understanding gets passed junior high level.
You lack any comprehension to understand the Gravity-thermal warming effect, it is an anathema to you.
You are totally oblivious to any sort of structural physics that allows for all design of all large structures.
You really need to realise JUST HOW LIMITED and TOTALLY CONFUSED your fantasy phizzics really is.
But your baseless ego and unwarranted arrogance will never allow that, will it, seb..
Just keep looking in the mirror and giggling to yourself.
And it’s derailed …
But according to the very same scientist [James Hansen] you are defending here [for his 1988 prediction], we will get about 2.5 inches of sea level rise per year due to catastrophic Greenland and Antarctica melting [10 feet in 50 years is 2-2.5 inches per year]…
Earth’s Most Famous Climate Scientists Issues Bombshell Sea Level Rise Warming
“The study—written by James Hansen, NASA’s former lead climate scientist, and 16 co-authors, many of whom are considered among the top in their fields—concludes that glaciers in Greenland and Antarctica will melt 10 times faster than previous consensus estimates, resulting in sea level rise of at least 10 feet in as little as 50 years.”
As should have been patently clear, the italicized comment above refers to the 2015 sea level rise prediction (10 feet in 50 years) made by Hansen, not the 1988 prediction made by Hansen. This should have been quite obvious, considering what I wrote. Do you believe in Hansen’s 2015 prediction? Why?
Many people understand that one cannot detect acceleration if one is only using “here and now” data, as there needs to be a long-term baseline to establish trends. Accelerating relative to when? 1993? Yes. That was an especially cold and low SLR year (which is conveniently when the satellite altimetry data start). But is it accelerating relative to 1939, when sea levels rose at a rate of 4.68 mm/yr? No. Sea levels have been decelerating relative to then.
https://notrickszone.com/wp-content/uploads/2018/02/Sea-Level-Rise-and-Rates-1900-2002-Jevrejeva-2008.jpg
http://www.jcronline.org/doi/pdf/10.2112/JCOASTRES-D-10-00157.1
“Our first analysis determined the acceleration, a2, for each of the 57 records [1930-2010] … There is almost a balance with 30 gauge records showing deceleration and 27 showing acceleration, clustering around 0.0 mm/yr. The mean is a slight deceleration of -0.0014 mm/yr ±0.0161 mm/yr (95%).”
“We also analyzed the worldwide data of Church and White (2006) for the period 1930–2001 and obtained a deceleration of -0.0066 mm/yr . … We analyzed the new data set from 1930–2007 [Church and White, 2009] and obtained a deceleration of -0.0130 mm/yr. Therefore, the deceleration that we find in U.S. gauge records for 1930–2010 is consistent with worldwide-gauge data of Church and White (Permanent Service for Mean Sea Level, 2010b)”
During what span of years? During 1958-2014 (the 56 years in which anthropogenic CO2 emissions rose dramatically), Greenland and Antarctica contributed 0.27 mm/yr on average, which means that, combined, they contributed about 1.5 cm (total) to sea levels during those 56 years. Now that is really alarming. No wonder the land area above sea level has expanded during 1985 to 2015. The coasts are expanding! The ice sheets aren’t melting fast enough to even make a difference.
Coastal Land Area Expanding – More Land Area Above Sea Level Now Than During 1980s
“How could sea level rise be “accelerating””
It’s NOT..
Sea level rise is decelerating according to tides.
https://s19.postimg.org/vbe9vvo4z/Sea_level_slows_Puls_1.jpg
Also decelerating in the satellite data
https://s19.postimg.org/qcqrhis3n/Sea_leve_slows_Puls_2.jpg
Only a complete mathematical inebriate would splice the two together and “pretend” acceleration of sea level rise
oops , wrong graph for first link.
https://s19.postimg.org/e6i9l8lxf/IB-5yr-all.png
And getting rid of the GAIA adjustment (GIA)
https://notrickszone.com/wp-content/uploads/2012/06/Caryl_5.gif
Even decelerating around the German coast by tide gauges.
https://notrickszone.com/wp-content/uploads/2012/12/Puls_31-1024×654.jpg
WOW, a WHOPPING 30cm in 170 years. 1.8mm/year !!
Run screaming and panicking like a headless chook, seb …. as is your meme. !!
And now this thread is again completely highjacked by you, Kenneth … have fun talking amongst yourselves. It’s fascinating how you effortlessly switch between the stages of denial.
1. no global warming happening, look at my data
2. it’s not caused by humans
3. it’s not alarming at all
When will the realization that what you believe in is nonsense hit?
So what was this thread about again? Right, Tony Heller.
@AndyG55:
https://climate.nasa.gov/vital-signs/sea-level/
I suspect when you look at the data you’ll imagine up a pause since early 2015. No acceleration at all, it just stopped rising. Right? 😉
The article was about the lack of exceptionality for the non-warming regions of the Earth. It was also about data adjustments to make the globe appear warmer than it is. I didn’t even mention Tony Heller other than to invite you to take your personal animus over to his site, since he’ll likely take you on. But I “highjacked” the comments on an article that I wrote? Your victimization here is just…weird.
WOW, seb nearly got something right. small step forward seb.. don’t go and ruin it. !!
1. needs correcting (seb’s ignorance again displayed)
Only warming from ocean events and cycles.
2. No sign or proof of an CO2 warming or anything other than NATURAL warming.
3. Still rather on the COLD side of normal for the Holocene.
You KNOW satellite sea level data contains several spurious “adjustments”
And as you can see, no acceleration.
I’m so glad that 3mm/year and DECELERATING (in real data) scares you seb. Its HILARIOUS.
Kenneth
Just start using the comment system like the rest of us and you’ll understand. It’s different down here. We have threads that have comments aligned ordered by time and grouped by thread-levels.
This thread was about challenging Tony Heller. You highjacked it, made it about something else.
This happens a lot. Why? Because you only see a comment made by someone, not the whole thread, and then your reply directly to it (the WordPress system allows for that). Result: your new comment often appears in the middle of older comments and is often not related to the discussion in that particular thread.
@AndyG55:
How does your mind work exactly? How do you come up with replies like these? Is there some kind of troll school that teaches these techniques?
“How does your mind work exactly?”
WAY better than yours, that is for sure!!
“How do you come up with replies like these?”
I go with scientifically provable facts
You should try it some time, instead of your mindless, EMPTY attention-seeking yaps. !!
You use the comments as some sort of child-minded attempt to make a man of yourself, for self gratification…. and you FAIL MISERABLY.
ps. It is YET AGAIN noted that you have absolutely ZERO COUNTER for the facts 1,2 and 3
It is also noted that you have ZERO EVIDENCE that CO2 causes warming of any sort, anywhere.
You can’t support even the most basic facet of your brain-hosed AGW religion.
Like a child just learning to walk, you took one tiny step forward, then toppled over and fell on your rear end just like you always do.
“This thread was about challenging Tony Heller. “
No, the Topic was “New Paper: 1,407 Contiguous U.S. Temperature Stations Reveal NO WARMING TREND During 1901-2015”
You tried to change the topic into a TH bashing rant, but you FAILED MISERABLY as always, and turned it into yet another anti-science, anti-thought load of low-knowledge, attention-seeking seb BS.
“Present one claim of his”
Ah , so you don’t even know any of what he discusses,
…yet you think an anti-science, anti-knowledge non-entity, with very limited education, like you, can actually refute him?
So hilarious. 🙂
Heck you still can’t even refute this statement with one skerrick of real science, just mindless yapping:
There is NO EMPIRICAL EVIDENCE that enhanced atmospheric CO2 causes warming of oceans, atmosphere or anything.
@Andy
Above, the activist chatbot troll writes “Just start using the comment system like the rest of us…”
“…like the rest of us…”
lolololol
Oh, Andy, look! FINALLY we have a champion to defend the oppressed among us. SebH, defender of the thread-hijacked masses by striking a blow against … uh, what exactly?
Too amusing.
an Activist Chatbot Comic-Relief Clown Troll’s lament
https://m.youtube.com/watch?v=Edr2FI6b3yI
Pretty soon I’ll need a whole thread just to write an accurate handle to suit him.
” let you feel like you have no opposition. “
That’s how we feel when you are here seb,
You are one of the most INEFFECTUAL AGW trolls I have ever come across.
Just the mindless juvenile tantrum-like attention-seeking.
Its all you have.
Heck, you won’t even try to produce some empirical scientific evidence for the VERY BASIS of the AGW scam.
There is NO EVIDENCE that CO2 causes warming of oceans, atmosphere or anything.
Golly Seb! I think those are actual original graphs from NASA. I bet they would like to disappear some of them.
Do you think it would be a good sign if an organisation couldn’t self correct and improve their data over time? Embrace change and progress, don’t hold on to broken old things that you imagine to have worked better. There are no “good old times”.
You mean where GISS turned a .50 C Cooling trend into zero trend after myriad adjustments over a 25+ years time, from the 1940’s to the 1970’s.
Snicker……
You are as usual ignoring the OBVIOUS statistical fraud GISS is perpetuating on their temperature dataset, since it was well known there was a significant cooling trend from the 1940’s to the 1970’s.
“correct and improve their data” = artificially remove 0.5°C from the 1880 to 1950 data points so as to eliminate the inconvenience of having to explain why the years after the 1940s are no warmer than the 1920s to 1940s period.
paraphrasing, “the direction of the correction/adjustment is suspicious because it help the other camp” … says the conspiracy theorist.
The algorithms are open source, test them, show where they are wrong instead of presenting this conspiracy crap.
You are so comically ignorant, with your stupid arrogance since NICK among other disinformationists were caught red handed over it.
You clearly have no idea about past adjustments, since they are well recorded using GISS own charts and data over the last 25+ years. It has been known for years now, thus your reply indicate that you are way behind on this scam.
You need to open your mind and critically asses Tony’s work in this area. Paul Homewood does similar at his own website as well.
Why the name-calling? And why does it have to be characterized as a “conspiracy”? It’s just data manipulation. They must hide the decline in temperatures in the recent decades.
The decline in measured temperatures in recent decades
126 Northern Hemisphere proxy measurements
The leaked Hide the Decline conversations with temperature data overseers…
“…you really ought to replace the values from 1961 onwards with observed [instrumental] temperatures due to the decline.”
“I’ve just completed Mike’s Nature trick of adding in the real temps to each series for the last 20 years (ie from 1981 onwards) amd from 1961 for Keith’s to hide the decline.”
“Also we have applied a completely artificial adjustment to the data after 1960, so they look closer to observed temperatures than the tree-ring data actually were”
“Also, we set all post-1960 values to missing in the MXD data set (due to decline), and the method will infill these, estimating them from the real temperatures – another way of ‘correcting’ for the decline, though may be not defensible!”
Please provide links to the required input data and algorithms to translate raw temperature data (from ships, bouys, land thermometers etc.?) into the GISTEMP advertised Global Average Mean Surface Air Temperature Change graph.
https://data.giss.nasa.gov/gistemp/graphs/
The relevant papers are all linked to in the FAQ on the NOAA site and I believe someone even implemented a more readable version on Github. I am sure you can find it yourself.
@Kenneth:
Calling someone a conspiracy theorist is not name calling. And you obviously still think “hide the decline” has something to do with faking data. It’s sad that you let your bias take the steering wheel and drive every argument against the wall.
Its sad that you have NO steering wheel, seb,
Its was not conspiracy, the data adjustment is PROVEN COLLUSION… by their own words.
That reminds me,
You do know that there is ABSOLUTELY ZERO EMPIRICAL PROOF that CO2 has any warming effect on the oceans , atmosphere or anything, don’t you.
Seb says:
“The algorithms are open source”
Then says:
“The relevant papers are all linked to in the FAQ on the NOAA site and I believe someone even implemented a more readable version on Github. I am sure you can find it yourself.”
So, open source algorithms are “relevant papers”? “Someone” posted clarifications on Github? Wow, that’s convincing evidence.
I have looked on the NOAA site and emailed with their techs at length trying to discover the complete set of input data and processing algorithms. If they exist they are not step-by-step published, which is required for a “scientific” endeavor.
Once again Seb provides “proof by gesticulation”.
Dear pmc47025,
it doesn’t really matter in what form algorithms get published. Do you need help implementing them?
See question Q6 following this link:
https://www.ncdc.noaa.gov/monitoring-references/faq/temperature-monitoring.php
Here is the relevant paper for the algorithm:
ftp://ftp.ncdc.noaa.gov/pub/data/ushcn/v2/monthly/menne-williams2009.pdf
Here is a benchmark:
ftp://ftp.ncdc.noaa.gov/pub/data/ushcn/v2/monthly/algorithm-uncertainty/williams-menne-thorne-2012.pdf
Here is the FTP link where you can find the software used by them (the data used is also on this FTP):
ftp://ftp.ncdc.noaa.gov/pub/data/ushcn/v2/monthly/
Another example in code form:
https://github.com/darothen/ccf-homogenization
Another implementation:
https://github.com/cran/snht
What more do you need? Why is laziness always an excuse for saying “no convincing evidence” or something like that? What does “proof by gesticulation” even mean? You guys really need a nanny that does everything for you, finding relevant information on your own seems impossible.
Anyway, let me know if you need help with the software (it includes a readme with a manual). If you are not a prick while requesting help, I might actually help you.
Seb,
I downloaded and executed the PHA (several years ago). At that time, it accounted for a portion of the supposed warming from 1880 to 2016 (about half if I recall correctly). The input to the PHA is identified by NOAA as unadjusted. The unadjusted data is not raw data, it has been through a “quality control” step. Is the QC algorithm published?
An issue I have with GHCN is the quality and quantity of global stations in the early part of the 1880-2017 time series. I downloaded the raw daily GHCN data file (2.9GB) and wrote a simple program to do some analysis. First, the program filtered all stations that did not have at least one temperature reading in each summer and winter month from 1925 thru 2017. That step filtered all but 101 of the 100,000+ stations in the file. Of the 101 stations, 79 were in the US, and only 3 were in the southern hemisphere.
An average temperature graph of the 101 stations (which I’m not pretending represents absolute global temperature) showed, 1998 10.9C, 1932 and 1934 tied at 11C, 2012 and 2016 tied at 11.4C. That’s a whopping 0.5C of warming from 1932 to 2016, well within natural variability, and, agrees almost exactly with Tony Heller’s Unhiding The Decline program.
A temperature graph that shows significantly more warming than the 101 station graph I generated implies there was warming where quality temperature stations did not exist. The almost 2C of warming from mid 1930s to 2016 shown by NOAA is pure propaganda:
https://www.ncdc.noaa.gov/cag/time-series/global/globe/land/ytd/6/1880-2016
There’s also the issue of proving all of the supposed 2C warming is due to CO2, and, proving the resulting warming will be catastrophic.
Daily (raw) data can be found in the 2.9GB file here if you are interested:
ftp://ftp.ncdc.noaa.gov/pub/data/ghcn/daily
Your attempt to bully me into not being a prick is hilarious.
The documentation (ftp://ftp.ncdc.noaa.gov/pub/data/ghcn/v4/documentation/) indicates that the data from GHCN daily is being used as input. As you appear to have discovered yourself, adjustments are needed (especially in early days) to arrive at a consistent dataset.
I don’t know, I don’t work for them.
Well, there were some distractions happening in that timeframe and it shows that recording temperature is not something that has been done consistently over time. That’s why adjustments are needed. With the arrival of automated data logging, the quality of the data should have improved dramatically.
No harm done, I hope. You seem to be a reasonable person.
However, this doesn’t seem to be a reasonable conclusion. If most of the stations you used are in a country that covers less than 2% of Earth’s surface … well, you wrote it yourself. This can’t be representative of what global warming between 1932 and 2016 is and definetly can’t support anything Tony Heller claims.
Please tell us the percentage of instrumental coverage for the sea surface temperatures — covering 71% of the Earth’s surface — in 1900 to 1950. Would it be somewhere in the neighborhood of 0.00000001%? Is it more like 0.0000001% now? Does that represent the globe?
https://m.youtube.com/watch?v=8XsD8Q3Jks8
No data = Warming
Cooling = Warming
Warming = More Warming
See how easy it is? Dr Keen fills in some important details.
https://m.youtube.com/watch?v=8XsD8Q3Jks8
Note that Dr. Keen is also “easily refuted.” Just call him names and post a link to some echo chamber nonsense, and move on. But mostly just call him names.
Don’t know why my phone entered that link at that top, when I only hit “paste” once.
Also, it replaced my first sentence.
Just illustrating how NASA/NOAA “self correct.” …and how easy it is to show that the world is indeed warming OUT OF CONTROL!
(Well, SOMETHING is out of control, anyway.)
Something of a ‘Warming Hole’ looks to be about to befall most of Europe starting by the end of the week, and maybe lasting as long as the first week of March (if weather models are to be believed) Here’s a snapshot of Friday 23rd February…
500hPa geopotential hight
http://www.wetterzentrale.de/maps/GFSOPEU12_84_5.png
Temperature at 2m above the ground…
http://www.wetterzentrale.de/maps/GFSOPEU12_84_5.png
And then for a few days it gets colder….quite a bit colder.
Germany will be very glad for all that Solar and Wind power.
Will help keep them warm. 🙂
Maybe “Fire-up the coal burners!” will be the cry before March arrives. 😃
By the way the longer range forecasts from JMA and CFS are forecasting a cooler, and in many areas wetter, than normal Spring for most of Europe.
Apropos the fact that the Antarctic shows no net warming for the entire record since the Geophysical year 1957-8, Prof Humlum @ climate4you-> Polar Temperature makes two points:
# CO2 has greatest absorption of IR at sub-zero temperatures.
# Antarctic is where CO2 would be expected to have the greatest influence due to the extremely dry atmosphere.
The atmospheric CO2 concentration on Antartica is around the same as recorded elsewhere i.e. ~400 ppm.
Nothing much going on this century in the Arctic either .
Just the El Nino transient that is rapidly disappearing.
https://s19.postimg.org/5zbqvlz1f/UAH_NoPol_2000-2017.png
[…] K. Richard, February 19, 2018 in […]
“Warming Hole”
Anything to avoid words like “cold” or even “Cool”
Interesting the way that TH just NAILS the AGW farce with a single graph. 🙂
https://realclimatescience.com/wp-content/uploads/2018/02/2018_02_19_15_17_06.png
@pmc47025 20. February 2018 at 1:39 PM |
Wow! You appear to have some talent there, you’ve managed to get seb off his enormouse lazy complacency and actually post some links. Well done!
Mark this in history — this has been a VERY rare event.
😁
Yes, and bookmark the link, too. It’s proof SebH isn’t stupid, but that he is well aware that everything he’s trying to sell us is as wrong as can be. How so? If it were correct, he wouldn’t be afraid to use the material and risk having it’s many errors exposed. It’s a pretty sad commentary on one’s case, when one’s “best” evidence has to be concealed, because it offers no support.
So, yeah, that’s a keeper.
Wow, you manage to twist and turn everything around so it fits your perception … bravo. Living with that kind of cognitive dissonance can be a problem though, you should let someone check you, yonason.
“Living with that kind of cognitive dissonance can be a problem though,”
You don’t have cognitive….. anything, seb !!
And you obviously have deep-seated issues living with that lack of cognitive function.
Lonely, juvenile attention-seeking… poor sad seb.
Will I find you in the Mensa register then, AndyG55?
yawn. yet another pointless EMPTY seb post. !!
“…proof by gesticulation.” – pmc47025
Good one. I’ll have to “borrow” it, …with attribution, of course.
[…] Read more at No Tricks Zone […]
Evidence of groupthink from Sebastian, who writes hypocritically since he is the same one who brought up Tony in the very first comment.
Now he says lets drop him to pretend he sees it as a conspiracy over what I write when it is obvious that I never said anything about a conspiracy at all:
“SebastianH 20. February 2018 at 12:43 PM | Permalink
Honestly sunsettommy,
who cares? What do you expect from me by telling this story? It doesn’t matter. Nothing of this matters. All you can think of is conspiracy here, conspiracy there. Who would want to engage you at that level?”
This is example of groupthink since Nick and Steve Mosher said similar to what Sebastian said. They make initial attack on Tony, then spew out the defensive replies ever since.
“A group of people come to share a particular view or belief without a proper appraisal of the evidence.”
They like YOU avoid what Tony really says at his blog, which are based on the NOAA database. He used only NOAA temperature data, a reality you avoid like holy water.
I wrote this,
“You say this yet somehow you magically know Tony is wrong, despite NEVER being at his blog.”
Sebastian replies,
“I don’t have to religiously read his blog to know that. You (all) post links to his blog/videos often enough.It’s a joke. Seeing someone like him as an authority and then downplay anything real scientists say as fake.”
Again he make clear he has this groupthink problem as well,
“Because their belief is ultimately only subjective, resting on shaky foundations, they then defend it only by displaying an irrational, dismissive hostility towards anyone daring to question it.”
You end with this howler,
“That’s not the behaviour of skeptics.”
You have ZERO skepticism in you as clearly evident that you made up your mind without ever making a proper assessment on the Nick Stokes/Tony Heller argument, you avoid totally yet somehow by magic you know he is wrong.
You have nothing rational going for you here since you employ groupthink, misdirection, dishonest replies and no willingness to understand why people are skeptical since you go by this groupthink example:
“This leads them to insist that their belief is shared by a ‘consensus’ of all rightminded opinion.”
You are not rational at all.
You do not debate honestly.
You keep adding things I didn’t say.
You are pathetic.
“Nothing of this matters. “
That is correct seb.
None of your mindless rants MEAN ANYTHING.
There is ZERO SCIENTIFIC PROOF that the very basis of the AGW religion is anything but a fabrication
There is zero proof that that the slight warming out of the coldest period in 10,000 years is ANYTHING BUT NATURAL.
The whole stinking AGW edifice is based on EMPTY NOTHINGNESS.
Until you can front up with empirical scientific proof that enhance atmospheric CO2 causes warming of ocean, atmosphere or anything…
… then anything else you rant is just a mindless, meaningless, attention-seeking distraction.
To mind this Seb character is nothing but a troll, why do you even give him the time of day?
To expose the vacuousness of his beliefs. He provides the framework and backdrop by citing his we’ve-heard-this-all-before alarmist (“We are already at 30,000 species lost per year“) talking points.
Because they deep down know they are wrong and can’t leave something contrary to their belief stay uncommented on their blog.
It can’t even produce evidence of enhanced atmospheric CO2 causing warming of oceans atmosphere or anything.
Stuck in its own little world of brain-hosed FANTASY science and fizzics. !
Here! ‘gender non-specific ragdoll’…..
“We present a novel approach to characterize the spatiotemporal evolution of regional cooling across the eastern U.S. (commonly called the U.S. warming hole),…”
Why stop at the northern border? The eastern part of Canada also demonstrates the same degree off cooling.
This is not a “hole” but most of the eastern part of the North American continent, probably also central and western Greenland.
E
Much of Europe is also in a NOT-WARM hole.
The Canadian Arctic hasn’t even warmed in the last 150 years, and it’s 3°C cooler now than it was a few thousand years ago.
Fortin and Gajewski, 2016
“Biological production decreased again at ~ 2 ka and the rate of cooling increased in the past 2 ka [2,000 years], with coolest temperatures occurring between 0.46 and 0.36 ka [460 and 360 years ago], coinciding with the Little Ice Age. Although biological production increased in the last 150 yr, the reconstructed temperatures do not indicate a warming during this time. … Modern inferred temperatures based on both pollen and chironomids are up to 3°C cooler than those inferred for the mid-Holocene.”