By Kenneth Richard on 16. October 2017
Updated: The Shrinking
CO2 Climate Sensitivity
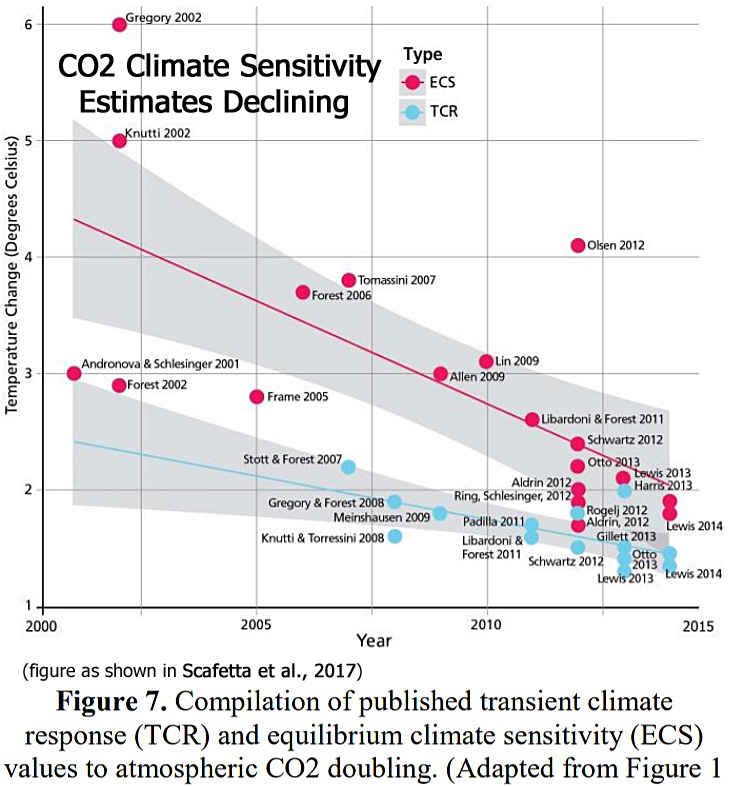
A recently highlighted paper published by atmospheric scientists Scafetta et al., (2017) featured a graph (above) documenting post-2000 trends in the published estimates of the Earth’s climate sensitivity to a doubling of CO2 concentrations (from 280 parts per million to 560 ppm).
The trajectory for the published estimates of transient climate response (TCR, the average temperature response centered around the time of CO2 doubling) and equilibrium climate sensitivity (ECS, the temperature response upon reaching an equilibrium state after doubling) are shown to be declining from an average of about 3°C earlier in the century to below 2°C and edging towards 1°C for the more recent years.
This visual evidence would appear to indicate that past climate model determinations of very high climate sensitivity (4°C, 5°C, 6°C and up) have increasingly been determined to be in error. The anthropogenic influence on the Earth’s surface temperature has likely been significantly exaggerated.
Scafetta et al., 2017 “Since 2000 there has been a systematic tendency to find lower climate sensitivity values. The most recent studies suggest a transient climate response (TCR) of about 1.0 °C, an ECS less than 2.0 °C and an effective climate sensitivity (EfCS) in the neighborhood of 1.0 °C.”
“Thus, all evidences suggest that the IPCC GCMs at least increase twofold or even triple the real anthropogenic warming. The GHG theory might even require a deep re-examination.”
An Update On The Gradually Declining Climate Sensitivity
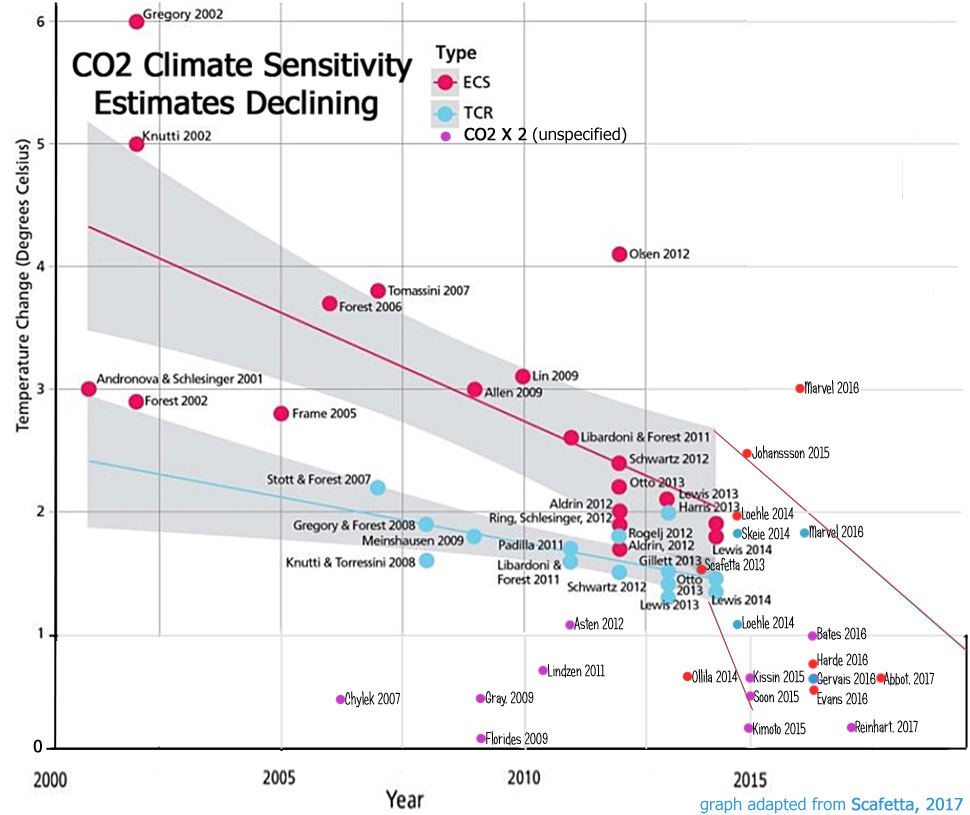
The graph shown in Scafetta et al. (2017) ends in 2014, which means that papers published in the last 3 years are not included. Also, there were several other published climate sensitivity papers from the last decade that were excluded from the analysis, possibly because they did not include and/or specify TCR and/or ECS estimates in isolation, but instead just used a generic doubled-CO2 climate sensitivity value (shown in purple here).
Below is a new, updated graph that (1) includes some of the previously unidentified papers and (2) adds the 10 – 12 climate sensitivity papers published in the last 3 years. Notice, again, that the trend found in published papers has continued downwards, gradually heading towards zero. The reference list for the over 20 additional papers used for the updated analysis is also included below.
For a more comprehensive list of over 60 papers with very low (<1°C) climate sensitivity estimates, see here.
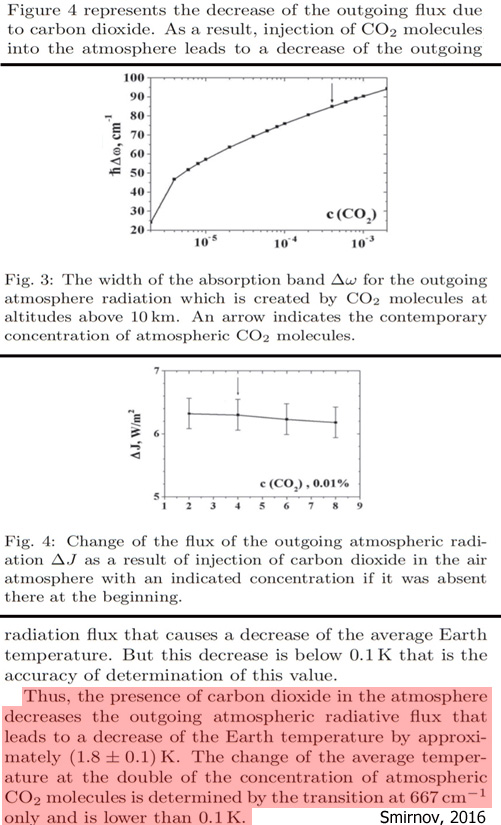
It is shown that infrared emission of the atmosphere is determined mostly by atmospheric water. One can separate the flux of outgoing infrared radiation of the atmosphere from that towards the Earth. The fluxes due to rotation-vibration transitions of atmospheric CO2 molecules are evaluated. Doubling of the concentration of CO2 molecules in the atmosphere that is expected over 130 years leads to an increase of the average Earth temperature by (0.4±0.2) K mostly due to the flux towards the Earth if other atmospheric parameters are not varied.

[W]e take into account that CO2 molecules give a small contribution to the heat Earth balance and, therefore, one can use the altitude distribution of the temperature for the standard atmosphere model [1], and a variation of the CO2 concentration does not influence this distribution. … [I]njection of CO2 molecules into the atmosphere leads to a decrease of the outgoing radiation flux that causes a decrease of the average Earth temperature. But this decrease is below 0.1K that is the accuracy of determination of this value. Thus, the presence of carbon dioxide in the atmosphere decreases the outgoing atmospheric radiative flux that leads to a decrease of the Earth temperature by approximately (1.8 ± 0.1) K. The change of the average temperature at the double of the concentration of atmospheric CO2 molecules is determined by the transition at 667cm−1 only and is lower than 0.1K.
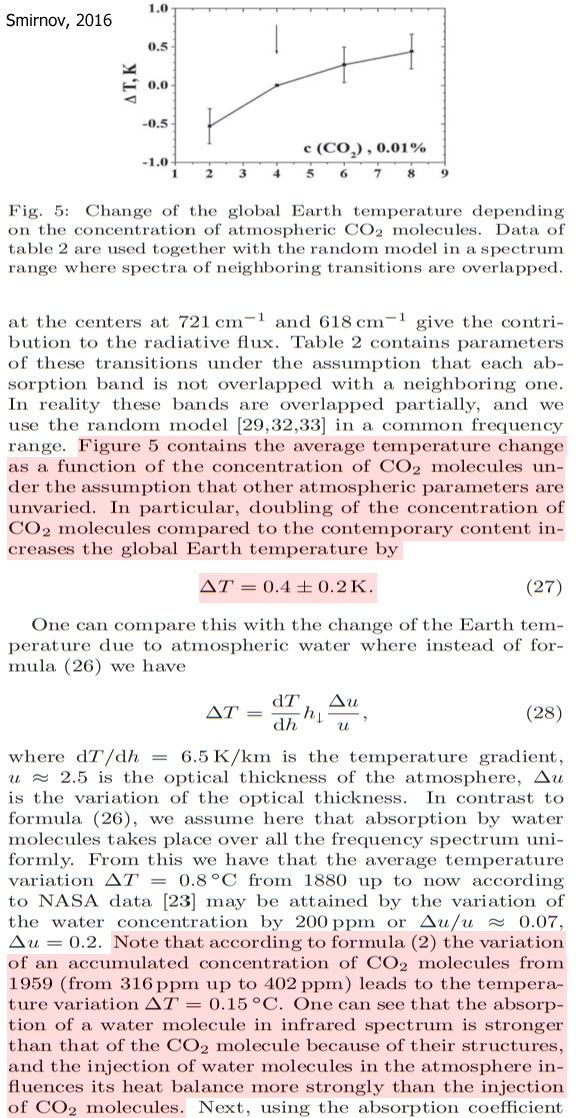
In particular, doubling of the concentration of CO2 molecules compared to the contemporary content increases the global Earth temperature by ΔT = 0.4 ± 0.2K. … From this we have that the average temperature variation ΔT = 0.8 ◦C from 1880 up to now according to NASA data may be attained by the variation of the water concentration by 200ppm or Δu/u ≈ 0.07, Δu = 0.2. Note that according to formula (2) the variation of an accumulated concentration of CO2 molecules from 1959 (from 316ppm up to 402ppm) leads to the temperature variation ΔT = 0.15°C. One can see that the absorption of a water molecule in infrared spectrum is stronger than that of the CO2 molecule because of their structures, and the injection of water molecules in the atmosphere influences its heat balance more strongly than the injection of CO2 molecules.
Our results permit to conclude that CO2 is a very weak greenhouse gas and cannot be accepted as the main driver of climate change. … The assumption of a constant temperature and black body radiation definitely violates reality and even the principles of thermodynamics. … [W]e conclude that the temperature increases predicted by the IPCC AR5 lack robust scientific justification. … A doubling [to 800 ppm] of the present level of CO2 [400 ppm] results in [temperature change] < 0.24 K. … [T]he scientific community must look for causes of climate change that can be solidly based on physics and chemistry. … The observed temperature increase since pre-industrial times is close to an order of magnitude higher than that attributable to CO2.
The largest deviation between the ANN [artificial neural network] projections and measured temperatures for six geographically distinct regions was approximately 0.2 °C, and from this an Equilibrium Climate Sensitivity (ECS) of approximately 0.6 °C [for a doubling of CO2 from 280 ppm to 560 ppm plus feedbacks] was estimated. This is considerably less than estimates from the General Circulation Models (GCMs) used by the Intergovernmental Panel on Climate Change (IPCC), and similar to estimates from spectroscopic methods.
The proxy measurements suggest New Zealand’s climate has fluctuated within a band of approximately 2°C since at least 900 AD, as shown in Figure 2. The warming of nearly 1°C since 1940 falls within this band. The discrepancy between the orange and blue lines in recent decades as shown in Figure 3, suggests that the anthropogenic contribution to this warming could be in the order of approximately 0.2°C. [80% of the warming since 1940 may be due natural factors].
Including solar and cloud effects as well as all relevant feedback processes our simulations give an equilibrium climate sensitivity of CS = 0.7 °C (temperature increase at doubled CO2) and a solar sensitivity of SS = 0.17 °C (at 0.1 % increase of the total solar irradiance). Then CO2 contributes 40 % and the Sun 60 % to global warming over the last century.
Estimates of 2xCO2 equilibrium climate sensitivity (EqCS) derive from running global climate models (GCMs) to equilibrium. Estimates of effective climate sensitivity (EfCS) are the corresponding quantities obtained using transient GCM output or observations. The EfCS approach uses an accompanying energy balance model (EBM), the zero-dimensional model (ZDM) being standard. GCM values of EqCS and EfCS vary widely [IPCC range: (1.5, 4.5)°C] and have failed to converge over the past 35 years. Recently, attempts have been made to refine the EfCS approach by using two-zone (tropical/extratropical) EBMs. When applied using satellite radiation data, these give low and tightly-constrained EfCS values, in the neighbourhood of 1°C. … The central conclusion of this study is that to disregard the low values of effective climate sensitivity (≈1°C) given by observations on the grounds that they do not agree with the larger values of equilibrium, or effective, climate sensitivity given by GCMs, while the GCMs themselves do not properly represent the observed value of the tropical radiative response coefficient, is a standpoint that needs to be reconsidered.
The conventional basic climate model applies “basic physics” to climate, estimating sensitivity to CO2. However, it has two serious architectural errors. It only allows feedbacks in response to surface warming, so it omits the driver-specific feedbacks. It treats extra-absorbed sunlight, which heats the surface and increases outgoing long-wave radiation (OLR), the same as extra CO2, which reduces OLR from carbon dioxide in the upper atmosphere but does not increase the total OLR. The rerouting feedback is proposed. An increasing CO2 concentration warms the upper troposphere, heating the water vapor emissions layer and some cloud tops, which emit more OLR and descend to lower and warmer altitudes. This feedback resolves the nonobservation of the “hotspot.” An alternative model is developed, whose architecture fixes the errors. By summing the (surface) warmings due to climate drivers, rather than their forcings, it allows driver-specific forcings and allows a separate CO2 response (the conventional model applies the same response, the solar response, to all forcings). It also applies a radiation balance, estimating OLR from properties of the emission layers. Fitting the climate data to the alternative model, we find that the equilibrium climate sensitivity is most likely less than 0.5°C, increasing CO2 most likely caused less than 20% of the global warming from the 1970s, and the CO2 response is less than one-third as strong as the solar response. The conventional model overestimates the potency of CO2 because it applies the strong solar response instead of the weak CO2response to the CO2 forcing.
Conclusion: Dangerous anthropogenic warming is questioned (i) upon recognition of the large amplitude of the natural 60–year cyclic component and (ii) upon revision downwards of the transient climate response consistent with latest tendencies shown in Fig. 1, here found to be at most 0.6 °C once the natural component has been removed, consistent with latest infrared studies (Harde, 2014). Anthropogenic warming well below the potentially dangerous range were reported in older and recent studies (Idso, 1998; Miskolczi, 2007; Paltridge et al., 2009; Gerlich and Tscheuschner, 2009; Lindzen and Choi, 2009, 2011; Spencer and Braswell, 2010; Clark, 2010; Kramm and Dlugi, 2011; Lewis and Curry, 2014; Skeie et al., 2014; Lewis, 2015; Volokin and ReLlez, 2015). On inspection of a risk of anthropogenic warming thus toned down, a change of paradigm which highlights a benefit for mankind related to the increase of plant feeding and crops yields by enhanced CO2 photosynthesis is suggested.
Assuming that all forcings have the same transient efficacy as greenhouse gases, and following a previous study, the best estimate (median) for TCR is 1.3°C. However, scaling each forcing by our estimates of transient efficacy (determined from either iRF or ERF), we obtain a best estimate for TCR of 1.8°C. This scaling simultaneously considers both forcing and ocean heat uptake efficacy. Other estimates of TCR which differ slightly due to choices of base period and uncertainty estimates and the aerosol forcing used, are similarly revised upward when using calculated efficacies. We apply the same reasoning to estimates of ECS. Using an estimate4 of the rate of recent heat uptake Q = 0.65 ± 0.27 W m-2, we find, assuming all equilibrium efficacies are unity, a best estimate of ECS = 2.0°C, comparable to the previous result of 1.9°C. However, as with TCR, accounting for differences in equilibrium forcing efficacy revises the estimate upward; our new best estimate (using efficacies derived from the iRF) is 2.9°C. If efficacies are instead calculated from the ERF, the best estimate of ECS is 3.0°C. As for TCR, alternate estimates of ECS are revised upward when efficacies are taken into account.
Nonetheless, let us ignore the negative relationship with greenhouse gas (GHG) radiative forcing, and assume the carbon dioxide (CO2) relationship is valid. If atmospheric carbon dioxide concentrations have risen by ~110 ppmv since 1881 (i.e., 290→400 ppmv), this would imply that carbon dioxide (CO2) is responsible for a warming of at most 0.0011 × 110 = 0.12°C over the 1881-2014 period, where 0.0011 is the slope of the line in Figure 29(a). We can use this relationship to calculate the so-called “climate sensitivity” to carbon dioxide, i.e., the temperature response to a doubling of atmospheric carbon dioxide. According to this model, if atmospheric carbon dioxide concentrations were to increase by ~400 ppmv, this would contribute to at most 0.0011 × 400 = 0.44°C warming. That is, the climate sensitivity to atmospheric carbon dioxide is at most 0.44°C.
Energy budget estimates of equilibrium climate sensitivity (ECS) and transient climate response (TCR) are derived using the comprehensive 1750–2011 time series and the uncertainty ranges for forcing components provided in the Intergovernmental Panel on Climate Change Fifth Assessment Working Group I Report, along with its estimates of heat accumulation in the climate system. The resulting estimates are less dependent on global climate models and allow more realistically for forcing uncertainties than similar estimates based on forcings diagnosed from simulations by such models. Base and final periods are selected that have well matched volcanic activity and influence from internal variability. Using 1859–1882 for the base period and 1995–2011 for the final period, thus avoiding major volcanic activity, median estimates are derived for ECS of 1.64 K and for TCR of 1.33 K.
A key uncertainty in projecting future climate change is the magnitude of equilibrium climate sensitivity (ECS), that is, the eventual increase in global annual average surface temperature in response to a doubling of atmospheric CO2 concentration. The lower bound of the likely range for ECS given in the IPCC Fifth Assessment Report was revised downwards to 1.5 °C, from 2 °C in its previous report, mainly as an effect of considering observations over the warming hiatus—the period of slowdown of global average temperature increase since the early 2000s. Here we analyse how estimates of ECS change as observations accumulate over time and estimate the contribution of potential causes to the hiatus. We find that including observations over the hiatus reduces the most likely value for ECS from 2.8 °C to 2.5 °C, but that the lower bound of the 90% range remains stable around 2 °C. We also find that the hiatus is primarily attributable to El Niño/Southern Oscillation-related variability and reduced solar forcing.
[A] doubling the CO2 concentration in the Earth’s atmosphere would lead to an increase of the surface temperature by about +0.5 to 0.7 °C, hardly an effect calling for immediate drastic changes in the planet’s energy policies. An increase in the absolute air humidity caused by doubling the CO2 concentration and the resulting decrease of the outgoing IR flux would produce a relatively small additional effect due to a strong overlap of IR spectral bands of CO2 and H2O, the two compounds primarily responsible for the greenhouse properties of the atmosphere.
The central dogma is critically evaluated in the anthropogenic global warming (AGW) theory of the IPCC, claiming the Planck response is 1.2K when CO2 is doubled. The first basis of it is one dimensional model studies with the fixed lapse rate assumption of 6.5K/km. It is failed from the lack of the parameter sensitivity analysis of the lapse rate for CO2 doubling. The second basis is the Planck response calculation by Cess in 1976 having a mathematical error. Therefore, the AGW theory is collapsed along with the canonical climate sensitivity of 3K utilizing the radiative forcing of 3.7W/m2 for CO2 doubling. The surface climate sensitivity is 0.14 – 0.17 K in this study with the surface radiative forcing of 1.1 W/m2.
According to this study the commonly applied radiative forcing (RF) value of 3.7 Wm-2 for CO2 concentration of 560 ppm includes water feedback. The same value without water feedback is 2.16 Wm-2 which is 41.6 % smaller. Spectral analyses show that the contribution of CO2 in the greenhouse (GH) phenomenon is about 11 % and water’s strength in the present climate in comparison to CO2 is 15.2. The author has analyzed the value of the climate sensitivity (CS) and the climate sensitivity parameter (l) using three different calculation bases. These methods include energy balance calculations, infrared radiation absorption in the atmosphere, and the changes in outgoing longwave radiation at the top of the atmosphere. According to the analyzed results, the equilibrium CS (ECS) is at maximum 0.6 °C and the best estimate of l is 0.268 K/(Wm-2 ) without any feedback mechanisms.
Loehle, 2014 (1.1°C transient, 2.0°C equilibrium)
Estimated sensitivity is 1.093 °C (transient) and 1.99 °C (equilibrium). Empirical study sensitivity estimates fall below those based on GCMs.
Equilibrium climate sensitivity (ECS) is constrained based on observed near-surface temperature change, changes in ocean heat content (OHC) and detailed radiative forcing (RF) time series from pre-industrial times to 2010 for all main anthropogenic and natural forcing mechanism. The RF time series are linked to the observations of OHC and temperature change through an energy balance model (EBM) and a stochastic model, using a Bayesian approach to estimate the ECS and other unknown parameters from the data. For the net anthropogenic RF the posterior mean in 2010 is 2.0 Wm−2, with a 90% credible interval (C.I.) of 1.3 to 2.8 Wm−2, excluding present-day total aerosol effects (direct + indirect) stronger than −1.7 Wm−2. The posterior mean of the ECS is 1.8 °C, with 90% C.I. ranging from 0.9 to 3.2 °C, which is tighter than most previously published estimates.
A quasi 60-year natural oscillation simultaneously explains the 1850–1880, 1910–1940 and 1970–2000 warming periods, the 1880–1910 and 1940–1970 cooling periods and the post 2000 GST plateau. This hypothesis implies that about 50% of the ~ 0.5 °C global surface warming observed from 1970 to 2000 was due to natural oscillations of the climate system, not to anthropogenic forcing as modeled by the CMIP3 and CMIP5 GCMs. Consequently, the climate sensitivity to CO2 doubling should be reduced by half, for example from the 2.0–4.5 °C range (as claimed by the IPCC, 2007) to 1.0–2.3 °C with a likely median of ~ 1.5 °C instead of ~ 3.0 °C.
Climate sensitivity estimated from the latter is 1.1 ± 0.4 °C (66% confidence) compared with the IPCC central value of 3 °C. The post Eocene-Oligocene transition (33.4 Ma) value of 1.1 °C obtained here is lower than those published from Holocene and Pleistocene glaciation-related temperature data (800 Kya to present) but is of similar order to sensitivity estimates published from satellite observations of tropospheric and sea-surface temperature variations. The value of 1.1 °C is grossly different from estimates up to 9 °C published from paleo-temperature studies of Pliocene (3 to 4 Mya) age sediments.
As a result, the climate sensitivity for a doubling of CO2 is estimated to be 0.7K (with the confidence interval 0.5K – 1.3K at 99% levels). This observational result shows that model sensitivities indicated by the IPCC AR4 are likely greater than the possibilities estimated from the observations.
A very recent development on the greenhouse phenomenon is a validated adiabatic model, based on laws of physics, forecasting a maximum temperature-increase of 0.01–0.03 °C for a value doubling the present concentration of atmospheric CO2.
CO2 increases without positive water vapor feedback could only have been responsible for about 0.1 – 0.2 °C of the 0.6-0.7°C global mean surface temperature warming that has been observed since the early 20th century. Assuming a doubling of CO2 by the late 21st century (assuming no positive water vapor feedback), we should likely expect to see no more than about 0.3-0.5°C global surface warming and certainly not the 2-5°C warming that has been projected by the GCMs [global circulation models].
Consequently, both increasing atmospheric concentration of greenhouse gases and decreasing loading of atmospheric aerosols are major contributors to the top-of atmosphere radiative forcing. We find that the climate sensitivity is reduced by at least a factor of 2 when direct and indirect effects of decreasing aerosols are included, compared to the case where the radiative forcing is ascribed only to increases in atmospheric concentrations of carbon dioxide. We find the empirical climate sensitivity to be between 0.29 and 0.48 K/Wm-2 when aerosol direct and indirect radiative forcing is included.
Posted in Climate Sensitivity, CO2 and GHG |


Thanks Kenneth for yet another excellent post! It will be interesting to see how the IPCC will manage such development.
[…] More .. […]
SebastianH?
Post your fantasy comments, please.
We could all do with a laugh.
Fantasy is what most papers in that list are writing about. You skeptics should be more skeptic when something seems to support your views than when it opposes your views. Especially when an author uses inappropriate language and celebrates himself/herself for having found something that shows the GHE would be violating one or more laws of physics 😉
But thanks for the comprehensive list of papers that will surely not be considered by any climate science panel. Not because their “results” would be inconvenient, but because those “results” are largely imagined … fantasy if you want.
What a substantive rebuttal, SebastianH. Effectively you have characterized papers that reach a climate sensitivity result at variance with your beliefs about what it really is as “imagined” and “fantasy”. That’s not particularly persuasive.
Tell us, do you believe the Gavin Schmidt paper (Marvel et al., 2016) that has a TCR of 1.9 C and an ECS of 3.0 C is imagined fantasy, or is that estimate the right one…because it agrees with your presuppositions?
It’s not about the value it’s about the methods used to determine climate sensitivity (mostly by attributing measured climate change to a different forcing). That and the language used make fantasy, and not a very convincing one. But you go on and believe what you want to believe 🙂
P.S.: why still quote Marohasy/Abbot? Have they revised their paper and corrected their fundamental errors?
Marohasy and Abbot’s mistake was in relying on other authors, Geirsdottir et al. (2009), to accurately represent the timing (1979 vs. 2000) of the end of the record for the Moberg paper. They didn’t. So A&M17 digitized another authors’ error on one graph of the 6 used in the paper.
Had M&A17 used any number of other reconstructions of the NH temperature record (like the ones below, which shows modern temps in line with natural variability), the very same conclusion reached in their paper (that CO2 might have only delivered 0.2 C to the warming over the last century, and thus climate sensitivity is about 0.6 C for CO2 doubling) could be reached.
Christiansen and Lungqvist, 2012
–
Schneider et al., 2015 (also here)
–
Stoffel et al., 2015
–
Abrantes et al., 2017
–
Ljungqvist, 2010
–
How much catastrophic warming do you believe we’ll get with doubled CO2, SebastianH? Since CO2 can only contribute 1.2 C at most upon reaching 560 ppm (according to the IPCC), how much of the catastrophic warming that you believe we’ll get will be caused by water vapor? Clouds?
How many species extinctions do you believe we’ll get by 2050? You’ve previously stated that you’re a denier of the million-species-go-extinct-by-2050 climate science found in the journal Nature. So what’s the value you believe in? 500,000? 300,000? What?
Otto et al. (2013), with a TCR of 1.3 C, was co-written by 14 IPCC lead authors and, like Lindzen and Choi (2011) (2XCO2=0.7 K) was featured as one of the referenced ECS papers in the last IPCC report.
You certainly gave me my chuckle for the day.
Such a wordy, finger pointing, character flaw focused attempt at falsifying supported science. Yet… You have absolutely nothing relevant to support your claims of what makes this fantasy. Just a blatant character attack and nothing more. HAHAHAHAHAHAHAHAHAHAHAHA!!!!!!!!!!!!!!!!
Thank you!!!!!!!!!! This will get me through years to come.
Do you think (most of) those papers are relevant? Why? Because they suit your narrative? Why aren’t you skeptical about the methods they used to derive at their conclusions?
Are you skeptical of the Gavin Schmidt paper, Marvel et al., 2016? Or do you find it relevant because it suits your narrative?
Back in 2010 I found a value of about 0.7 C/doubling using HadCET and the data from the Armagh weather observatory. That is probably an upper limit since it still assumes greenhouse gases were driving the residual warming after deduction of the effect of the ocean cycles and the indirect effect of the Sun. (The methodology is given and can be replicated with a bit of effort using a spreadsheet.)
It’s interesting that more and more studies are converging to the same general result: an ECS below 1 C/doubling.
It is important to underline what that means.
At 1 C/doubling, another 2 C more warming would require us to burn 10 times the amount of coal, oil and gas than we have done since the start of civilization. But that can’t happen since there isn’t that much coal, oil and gas in existence.
So any ECS value below 1 C/doubling means global warming is completely harmless.
Yes seb- please explain to us how computer-modeled CS based upon built-in assumptions is superior to observation-based analyses.
Worth noting perhaps that this development is an example of the well known decline effect in medical and social research. The estimates always trend to zero because the effect is zero. Usually, it begins with fantastic claims based on a false positive in a small sample, subtle errors in experimental design, or biased data.
Good point! This applies to a number of phenoma in the current post-truth hype-everything-society. I can wait for this anti-enlightment era to end.
I wonder what happens when you find out that you guys were wrong in a few decades. Can we look back and see what skeptics “predicted” 10 years ago and what really happened?
So what’s your prediction, SebastianH? How much catastrophic warming do you believe we’ll get in a few decades? Will the Southern Hemisphere sea ice actually begin to decline at some point, or will it continue to increase like it has been since the 1970s?
Similarly, you’ve written before that you deny the climate science (Thomas et al., 2004, Nature) that says we’ll get over 1 million species extinctions by 2050, which is about 30,000 per year every year for the next 33 years. So if you deny that science, what is the right species extinction figure in your opinion? And on what are you basing your position on?
We are definitely not getting -2.8 C below the average until 2020 as Pierre predicted in 2008 🙂
I predict that energy will continue to accumulate in the system. Are you betting against that? If so, why?
Regarding extinction of species, why do you think 30000 species lost per year is a big number? We are already at or over that rate. Oh and did you read the study about the loss of flying insect mass? http://journals.plos.org/plosone/article?id=10.1371/journal.pone.0185809
Fun times lay ahead …
How much warming do you think we’ll get due to that energy accumulation? Be specific.
My guess – and that’s all it is – is that we’ll get somewhere between -0.5 C of cooling and +0.5 C of warming during the next 30 years or so. There are too many variables to consider (Volcanic eruptions? Supernova event? Decadal-scale cloud cover increases vs. decreases?) other than just the parts per million concentration of a trace gas like CO2 when prognosticating future temperatures without large uncertainty ranges. Besides, I generally agree with the IPCC on long-term predictions…
“In sum, a strategy must recognise what is possible. In climate research and modelling, we should recognise that we are dealing with a coupled non-linear chaotic system, and therefore that the long-term prediction of future climate states is not possible.” — IPCC TAR (2001) Section 14.2.2.2 Page 774
But you, on the other hand, are totally convinced that we have warming in store for us…because of CO2. Right? Why else would you be so adamant that we use wind and solar? So what is your prediction? How much warming will we get? Be specific.
Hmmm. Probably because only one animal – a mollusc – has been confirmed by the IUCN to have gone extinct since 2000. In the 500 years before that, there were 801 extinctions — mostly during the cold, cold Little Ice Age.
http://www.bbc.com/news/magazine-17826898
“It is possible to count the number of species known to be extinct. The International Union for Conservation of Nature (IUCN) does just that. It has listed 801 animal and plant species (mostly animal) known to have gone extinct since 1500. … According to IUCN data, only one animal has been definitely identified as having gone extinct since 2000. It was a mollusc.”
Why do you believe that losing 30,000 species every year for the next 33 years is not catastrophic, SebastianH?
An accumulation of energy doesn’t cause a specific warming. The oceans could continue to take in the bulk of that energy and if the distribution is good enough the warming at the surface will not be as high as if all the energy would remain near the surface.
Yes, I am convinced about the energy accumulation potential of CO2 and other GHGs. But I don’t know if warming will continue. There could always be some other effect that produces cooling greater than the warming from CO2 which would result in net cooling obviously. But this doesn’t make the CO2 effect disappear like you so often seem to claim …
I guess you will repeat this question until I give you a definitive answer and you will continue to claim that I am evading or something like that. Let’s cut that short … I won’t give you a more specific value than any scientist or panel of scientists can give you. It’s also not quite sure by how much we will be able to reduce our CO2 emissions in the coming decades, which would also be a kind of big factor in predicting the accumulation of energy and the resulting temperature change.
The question is, why do you believe that 30000 species aren’t going extinct every year already?
You’ve just lost your “consensus” card. Even writing that you don’t know if warming will continue is enough for someone like Al Gore or Michael Mann to characterize you as a “denialist” or something similar. So why are you so hell-bent on building 100s of thousands of more wind turbines and millions more solar panels if you don’t even know if they’ll be necessary or worth it because natural factors may override the CO2 effect (like they did for 1992-2014) and we might get a net cooling? In other words, why are you even here?
Um, because that’s not happening. We’ve had 1 confirmed species extinction since 2000 – a mollusc. Or do you think the IUCN is trying to hide 30,000 species extinctions per year?
http://www.bbc.com/news/magazine-17826898
“It is possible to count the number of species known to be extinct. The International Union for Conservation of Nature (IUCN) does just that. It has listed 801 animal and plant species (mostly animal) known to have gone extinct since 1500. … According to IUCN data, only one animal has been definitely identified as having gone extinct since 2000. It was a mollusc.”
“Climate science” is definitely science. Just because there are many poor practitioners doesn’t mean it’s not science.
Scafetta has published his forecasts quite clearly. I think he has the best model I’ve seen. It combines the natural harmonics with climate models reliant on GHG forcings. He adjusts the climate models for their historical bias in the same way MOS adjust weather models for their biases and uncertainties.
Forecasts and hindcast here…
https://postimg.org/image/6pi63asqh7/
So far, the el nino spike has him underperforming the climate models. Time will tell.
Social “science”, like climate “science” is not social, or science.
Ditto for Social Justice!
Don’t forget that back in 1971, NASA/GISS assessed Climate Sensitivity to be around 0.5degC per doubling, and about 0.6degC with water feedback. So it has been known for a very long time that Climate Sensitivity is low.
We are constantly being told that AGW is grounded upon basic physics going back more than 100 years. We have known the infra red absorbing characteristics of CO2 for generations. There is no new physics or properties of CO2 that have come to light after the NASA/GISS 1971 paper such that there is no reason to consider that paper to be fundamentally flawed, or superseded by a better understanding of known physics.
The difference is one of politics. In 1971, Climate Scientists were pushing global cooling. Hence, they wanted to show that CO2 whilst causing warming, was not as important as high aerosol emissions that were causing cooling. Thus they portrayed low sensitivity to CO2, and high sensitivity to aerosols.
Now the meme has changed. Political activists now wish to promote global warming so they have had to switch around the sensitivities, and the warmist now want people to believe that there is high sensitivity to CO2, and lower sensitivity to aerosol emissions.
The fluidity of the science tells you everything you need to know. Science that can shift in this manner is not science, but rather simply politically driven to promote an agenda of someone’s utopian dream (socialism new world order).
See the Schneider 1971 paper (which incidentally utilized a model produced by no other than James Hansen). Science Volume 173 (July 19710 pages 138 to 141.
Rasool and Schneider, 1971
https://www.atmos.washington.edu/2008Q2/591A/Articles/Rasool_Schneider_Science.pdf
[A]lthough the addition of carbon dioxide in the atmosphere does increase the surface temperature, the rate of temperature increase diminishes with increasing carbon dioxide in the atmosphere. … It is found that even an increase by a factor of 8 in the amount of CO2, which is highly unlikely in the next several thousand years, will produce an increase in the surface temperature of less than 2 K. However, the effect on surface temperature of an increase in the aerosol content of the atmosphere is found to be quite significant. An increase by a factor of 4 in the equilibrium dust concentration in the global atmosphere, which cannot be ruled out as a possibility within the next century, could decrease the mean surface temperature by as much as 3.5 K. If sustained over a period of several years, such a temperature decrease could be sufficient to trigger an ice age!
–
Zdunkowski et al., 1975
http://link.springer.com/article/10.1007%2FBF01592922
It is found that doubling the carbon dioxide concentration increases the temperature near the ground by approximately one-half of one degree [0.5°C] if clouds are absent. A sevenfold [700%] increase of the present normal carbon dioxide concentration increases the temperature near the ground by approximately one degree. Temperature profiles resulting from presently observed carbon dioxide concentration and convective cloudiness of 50% or less are compared with those resulting from doubled carbon dioxide concentrations and the same amounts of cloud cover. Again, it is found that a doubling [100% increase] of carbon dioxide increases the temperature in the lower boundary layer by about one-half of one degree.
–
Weare and Snell, 1974
http://journals.ametsoc.org/doi/pdf/10.1175/1520-0469%281974%29031%3C1725%3AADTCAS%3E2.0.CO%3B2
As may be seen in Fig. 7, a doubling of CO2 increase the mean annual global surface temperature according to our dynamical model by about 0.7K, but a sixfold increase only increases the temperature 1.7K. The nonlinearity is due to saturation of the 15 µm band.
–
Dunbar, 1976
http://arctic.journalhosting.ucalgary.ca/arctic/index.php/arctic/article/viewFile/2803/2780
[T]he measured increase in carbon dioxide in the atmosphere, according to the most recent computations, would not be enough to have any measurable climatic effect. … [I]f the concentration were to increase from the present level of 320 parts per million to about 400 by the year 2000, the predicted increase in surface global temperature would be about 0.1°C.
–
Newell and Dopplick, 1979
http://journals.ametsoc.org/doi/pdf/10.1175/1520-0450%281979%29018%3C0822%3AQCTPIO%3E2.0.CO%3B2
The conclusion is that at low latitudes the influence of doubling CO2 on surface temperatures is less than 0.25 K
–
Schuurmans, 1983
http://link.springer.com/chapter/10.1007/978-94-009-6998-8_12#page-1
[T]here is some general agreement amongst different modellers that the transient response of global mean temperature to increased CO2 concentration of the atmosphere at present amounts to less than 0.5 K (estimates of [temperature response] now varying between 0.2 and 0.4 K).
Thanks Keith.
Your further examples prove the point that I was making.
At the time when those papers were published, we knew all about the basic physics of CO2, and its IR absorbing properties. There has been no new discoveries in the physics of CO2. I consider that to be a very important point to make.
The assessments made in those papers were made at a time before CO2 had become politicised. Before it had become weaponised, and at a time when scientists could be more honest about the true impact of CO2.
Further these assessments were made at a time before the thermometer record had been substantially adjusted. These assessments were based upon a more honest assessment of the temperature history of the past 100 years, and based upon RAW data, as opposed to the now heavily adjusted thermometer record that now bears no relationship with reality. Again, I consider that is an important point to appreciate.
Of course, returning to the point being made in the Article that as time goes by, Climate sensitivity is becoming lower, should the next phase of the ENSO cycle result in either a deep La Nina, or a long lasting weak La Nina, the pause will once again reappear but this time it will be at least 20 years in duration.
We can say that should that happen, ie., should the pause in temperature reappear, then when it reappears, the assessments of Climate Sensitivity will become even lower. The longer the length of any such pause, the lower Climate Sensitivity must become.
I make no prediction as to whether we are about to again witness a La Nina, but merely should a La Nina appear within the next 3 to 6 months, it will make the writing of AR6 very difficult, for two reasons.
First, it follows that Climate Sensitivity must be much lower than the IPCC are presently prepared to acknowledge, and it will put pressure on the IPCC to lower the band for Climate Sensitivity, or at least reduce the upper level.
Second, it will open up the wound of model discrepancy. The discrepancy between model projections and observational temperatures will widen, and it will therefore exert pressure on the IPCC to acknowledge the discrepancy and to comment upon it, and address it, perhaps by removing the models that run warmest from the model ensemble. That would then result in the ensemble mean effectively tracking a lower Climate Sensitivity. The two are intrinsically linked.
This summary is extremely useful. Thanks. In debating the climate in DC and rest of USA, almost no one thinks about any estimate except the dreaded >2.C
[…] Källa: NoTricksZone. […]
The fear inducing power of “global warming” seems to be declining! Truly “it is worse than we thought”.
All IPCC and contemporary climate analysis is based on the assumption that radiative (aka greenhouse) gasses ‘trap’ infrared radiation. This is wrong, they merely delay heat transfer to space.
A second false assumption is that the radiative delay (aka greenhouse) effect is the only mechanism that can account for Earth’s surface temperature. Thermal buffering by the atmosphere of the day/night temperature cycle can account for our surface temperature.
The total current contribution of CO2 to surface temperature is approximately 0.01 C.
See: http://brindabella.id.au/climarc/dai/RadiativeDelay/RadiativeDelayInContext170828.pdf
dai
If there are really “no tricks” here, then why are you tricking people? For example, your first listed source “Reinhert, 2017” is not a peer-reviewed study; it’s a blogpost from “Toutes les énergies”, as potholer54 pointed out. It calls itself a blog: “Ce blog est un espace de liberté, pour des auteurs francophones.” The dangers of relying such blogs are well-known:
“Unlike mainstream climate scientists, who publish primarily in peer reviewed journals, these critics typically employ a range of non-peer-reviewed outlets, ranging from blogs to the books we are examining. […]
The general lack of peer review allows authors or editors of denial books to make inaccurate assertions that misrepresent the current state of climate science. Like the vast range of other non-peer-reviewed material produced by the denial community, book authors can make whatever claims they wish, no matter how scientifically unfounded.”
http://abs.sagepub.com/content/early/2013/05/01/0002764213477096.full.pdf
And how about the fact that many of these so-called “studies” are published in predatory, open-access, online “journals” with no impact factor and which are not listed in reputable citation indexes (like the Master Journals list)? Thus the studies are unlikely to have undergone competent peer review.
For example, the “Abbot and Marohasy, 2017” “study” was incredily bad. They don’t even access the data sources they’re supposed to be using, and instead digitize images from papers they saw. This leads them to screw up their figure 12, which is a pretty poor modification of Moberg 2005:
“Climate: past ranges and future changes”
“Highly variable Northern Hemisphere temperatures reconstructed from low- and high-resolution proxy data”
Their figure 12 excludes much of the recent global warming, along with southern hemisphere trends. Zeke Hausfather and Gavin Schmidt dumb this down rather nicely here:
https://twitter.com/hausfath/status/900130781615374336/photo/1
https://twitter.com/ClimateOfGavin/status/900341454232371200/photo/1?ref_src=twsrc%5Etfw&ref_url=https%3A%2F%2Fandthentheresphysics.wordpress.com%2F2017%2F08%2F22%2Fmachine-unlearning%2F
Including the southern hemisphere and recent global warming results in the standard hockey stick pattern than would have likely increases Abbot and Marohasy’s climate sensitivity estimate. For example:
Figure 2:
“Pacific Ocean Heat Content During the Past 10,000 Years”
So no wonder Abbot and Marohasy decided to exclude that data; it would have gotten in the way of their goal of showing low climate sensitivity. Competent peer review would have prevented Abbot and Marohasy’s attempt at excluding data. But competent peer review apparently was not applied to Abbot and Marohasy’s “study”. Unsurprisingly, the predatory “journal” “Abbot and Marohasy, 2017” was published in will be closing down in a few months:
https://www.journals.elsevier.com/georesj
Anyway, your figure commits at least three additional errors [citations in brackets]:
A1) It is less comprehensive than a scientific review of the literature; this review presents recent evidence in support of a higher climate sensitivity [1].
A2) It excludes other studies that show higher climate sensitivity [2 – 17].
A3) It excludes papers that show flaws in some of the studies listed in your figure [5; 6; 8 – 12; 18, page 1375].
Reasons A2 and A3 are connected since correcting the flaws in the studies listed in your figure, tends to increase the studies’ climate sensitivity estimates [5; 6; 8 – 12; 18].
Citation list:
1. “Beyond equilibrium climate sensitivity”
2. “Climate sensitivity in the geologic past”
3. “Deep time evidence for climate sensitivity increase with warming”
4. “Observational constraints on mixed-phase clouds imply higher climate sensitivity”
5. “Reconciled climate response estimates from climate models and the energy budget of Earth”
6. “Implications for climate sensitivity from the response to individual forcings”
7. “Implications of potentially lower climate sensitivity on climate projections and policy”
8. “Disentangling greenhouse warming and aerosol cooling to reveal Earth’s climate sensitivity”
9. “Inhomogeneous forcing and transient climate sensitivity”
10. “On a minimal model for estimating climate sensitivity”
11. “Corrigendum to “On a minimal model for estimating climate sensitivity” [Ecol. Model. 297 (2015), 20-25]”
12. “Projection and prediction: Climate sensitivity on the rise”
13. “Spread in model climate sensitivity traced to atmospheric convective mixing”
14. “Long-term cloud change imprinted in seasonal cloud variation: More evidence of high climate sensitivity”
15. “Nonlinear climate sensitivity and its implications for future greenhouse warming”
16. “Natural variability, radiative forcing and climate response in the recent hiatus reconciled”
17. “A less cloudy future: the role of subtropical subsidence in climate sensitivity”
18. “Misdiagnosis of Earth climate sensitivity based on energy balance model results”
The paper was found in Google Scholar. Dr. FK Reinhart is a Swiss physicist who has published 100s of papers in the scientific literature. He is not a blogger.
The peer-review process is not a reliable indicator of the fitness of a paper for publication. Michael Mann, for example, published a paper in the journal Nature that was riddled with high school level logical errors and statistical malfeasance. Dr. William Briggs facilely exposed what “peer-review” did not:
http://wmbriggs.com/post/17849/
You are correct that Abbot and Marohasy (2017) used a graph of the Northern Hemisphere that they copied directly from another paper, Geirsdottir et al. (2009), that erroneously placed the end of the temperature record for Moberg et al. (2005) at 2000 instead of 1979 (the end year for the Moberg tree ring proxies, with 1980 the first year of the “instrumental” data). So A&M17 are “guilty” of assuming that the Geirsdottir (et al., 2009) paper had accurately represented the Moberg paper. They hadn’t. It was one of many other graphs included in that paper…that also showed that modern temperatures are still well within the range achieved during then Medieval Warm Period, or that don’t fall outside the range of natural variability.
There have been several other graphs of the Northern Hemisphere that A&M17 could have used that also showed there has been no significant net warming after the 1940s, or that showed a significant cooling between 1940-1970 (-0.5 C) and a warming since ~1980 (through ~2000) that hadn’t yet reached the warmth levels of the 1940s. For example:
Christiansen and Lungqvist, 2012
–
Schneider et al., 2015 (also here)
–
Stoffel et al., 2015
–
Abrantes et al., 2017
–
Ljungqvist, 2010
–
Here is a list of 350 graphs found in peer-reviewed scientific papers (with over 100 published this year alone) that show today’s temperatures do not fall outside the range of natural variability. About a quarter of them show no net warming in the Southern Hemisphere or equatorial regions since the Medieval Warm Period. It’s well known that the instrumental temperatures for the Southern Hemisphere are largely just “made up”. That’s what Phil Jones revealed in his exchanges with the dataset overseers, of course.
I assume you agree that doubling CO2 from 280 ppm to 560 ppm (and 560 ppm to 1,120 ppm, and so on) yields only an additional 1.2 K of warming (which is largely beneficial considering the Little Ice Age was the coldest multi-centennial-scale period of the last 10,000 years). It’s only with assumed positive water vapor and cloud cover feedback that temperatures are believed to be capable of reaching the catastrophic levels (~3 C and up). You agree with this, right?
Kenneth and his “look over there” tactic …
1) everyone can write nonsense in a blog, having published papers before doesn’t prevent that
2) And the Briggs thing again … Have you ever considered that this “numerologist” could be wrong? We had that discussion before.
3) The A&M error is a fundamental one which changes their conclusion. The other graphs you linked to … Well “we had that discussion before” and it leads to nowhere with you.
You really think you have no junk papers in your lists and that you interpreted their results correctly?
Explain why you believe Dr. Briggs is wrong, and that Michael Mann did not commit 4 logical/statistical errors in his paper.
Uh, no. It’s not fundamental to their paper that another author got the end date wrong for the Moberg paper and A&M17 copied their error and included it in their paper. As mentioned, plenty of other graphs of the NH also show no warming in modern times that falls outside the range of natural variability. They should have been more selective about their reconstruction choice. The reason why the discussion about the NH leads to no where is because you’re a believer in Mann and Marcott hockey stick graphs, and you will not budge from that belief.
I have explained why Briggs is wrong many times. Your reply is always something akin “well he is a doctor and you are just a blog commentator”. You are regularly blinded by titles … a basic knowledge of the mechanisms and math/physics would make you a better skeptic …
The A&M error is fundamental. They base their conclusion on that particular chart. And we also had lengthy discussions on why your “there is not hockey stick” repetition is wrong. Go on and keep ignoring everything that doesn’t suit you, but ignorance isn’t a good argument against anything.
Really? I don’t ever recall even once where you “debunked” his determination that Mann committed 4 elementary statistical and logical errors in his paper. Would you mind posting this “debunking” again? And since I don’t recall you ever “debunking” Dr. Briggs, I also don’t recall responding to this “debunking” in the way you have characterized here, as I know I didn’t write what you have here claimed I wrote.
No, it’s not fundamental to their paper’s conclusion, which is that modern temperatures do not fall outside the range of natural variability to any significant degree. Their 5 other reconstructions besides the one with the end-year error (that they copied from another paper) also show the same pattern. And they are correct that the tree-ring records show cooling after 1980, leading people like Michael Mann to “hide the decline” by replacing tree ring records with up-justed instrumental records.
Briffa et al., 2002
“…you really ought to replace the values from 1961 onwards with observed [instrumental] temperatures due to the decline.”
“I’ve just completed Mike’s Nature trick of adding in the real temps to each series for the last 20 years (ie from 1981 onwards) amd from 1961 for Keith’s to hide the decline.”
“Also we have applied a completely artificial adjustment to the data after 1960, so they look closer to observed temperatures than the tree-ring data actually were” …. “Also, we set all post-1960 values to missing in the MXD data set (due to decline), and the method will infill these, estimating them from the real temperatures – another way of ‘correcting’ for the decline, though may be not defensible!”
Hide the Decline, Mann et al. (1998, 1999)
Regarding Briggs and his claim that we don’t know the exact temperatures from past years: https://tamino.wordpress.com/2012/02/01/william-m-briggs-numerologist-to-the-stars/
Why do you think the “blog post” of Briggs is generally being ignored? Because it is correct?
They used an algorithm to predict the (current) temperatures based on that wrongly digitized proxy dataset. They found that the algorithm that has been trained on past data produced only a small difference to reality. And thus they concluded that human influence (by CO2) must be small. Correct? And you don’t understand why the problem with their dataset makes their conclusion fall apart? They should redo their experiment with proper data and republish. It’s one of many papers with errors that lead to wrong conclusions …
It happens to many scientists that are celebrated by skeptics:
https://link.springer.com/article/10.1007/s00704-015-1597-5
And apparently you still think there is a big conspiracy going on that keeps adjusting the temperature and “hides the decline” 😉
A 2012 blog post by “tamino” has exactly what to do with the critique of Michael Mann’s 2015 paper? I’ll answer: absolutely nothing. So you were engaging in dishonesty again, just as I suspected. You hadn’t actually addressed, much less “debunked” the Four Errors… article that was referenced here. Nor is your claim that I responded to this “debunking” of Briggs’ article the way you said I did the truth. That was made up too. Why do you think that making up stuff is helping you here, SebastianH? I have so little respect for someone who has the chronic habit of not telling the truth.
Again, that proxy dataset was one of 6 they used for the paper. The tenths of a degree difference from using the wrong end year from 1 of 6 of the papers would have rendered a negligible difference had they used the “right” end year. And if they had used a different proxy record of the NH — such as one of the 6 other ones that show no net warming since the 1940s — there would have also been no difference at all. So again, the digitizing error was not fundamental to their conclusion. At most, perhaps they would conclude that 0.25 C of the 0.8 C of the warming during the industrial era has been anthropogenic …instead of 0.2 C. A 0.05 C difference is not “fundamental”.
I don’t use the word conspiracy. That’s the dismissive language your side uses. I’ll just keep noting that the dataset overseers openly discussed hiding the decline in temperatures after 1960s…because that’s what they actually wrote.
@Kenneth Richard 19. October 2017 at 10:52 AM
lol – the only thing linking to (as Mark Steyn calls him) “Diehard Maniac blogger ‘Tamino'” proves, is that SebH hasn’t a clue what he thinks he’s writing about. The only thing he debunks is himself.
Question, do you understand the kind of errors that Briggs thinks were made? Can you repeat – in your own words – what he is claiming?
???
Do you really believe this? So you think everything they say is still good despite the huge error (they didn’t use 6 proxy datasets for the estimation of the climate sensitivity in their paper, since 5 of them weren’t global), but on the other hand you think because of some person named Briggs with arguments that you don’t seem to fully understand that a paper should not have passed peer review? That’s really amazing …
Every sentence in which you say some data was manipulated (and still is) screams “conspiracy” … you don’t have to actually use the word.
But do you understand what they wrote? Including the full context? Or do you just pick some quotable sentence and present it as evidence of a conspiracy and be done with it? Why do you think that the proxy data provides a better temperature record than actually measured temperatures?
I have no desire to educate you about what Dr. Briggs is saying in his article. It is a waste of my time. Again, you have not ever “rebutted” the 4 errors identified by Briggs in the Mann paper…even though you claimed to have done so, and then falsely claimed what my response was to your made-up “rebuttal” was to point out his credentials vs. yours. On both counts, you’re fabricating.
Nor is your claim that I responded to this “debunking” of Briggs’ article the way you said I did the truth. That was made up too.
You claimed that, after reading how you “many times” explained why Briggs “is wrong” in his Four Errors… article, I responded by saying that he is a doctor and you aren’t. You made this up. I didn’t write that in response to your made-up “rebuttal”. You fabricated that too.
How many more times must I repeat this? The NH graph was one of 6 graphs used. Six. Like the other 5, it wasn’t global either. So in one of the 6 graphs, they “missed” a few tenths of a degree of recent warmth due to a copying error (made by other authors). The few tenths of a degree difference in one of 6 graphs isn’t enough to change their conclusion to any substantial degree. That’s why A&M17 wrote this about the New Zealand record, which showed a warming of a full degree since 1940:
“The proxy measurements suggest New Zealand’s climate has fluctuated within a band of approximately 2°C since at least 900 AD, as shown in Figure 2. The warming of nearly 1°C since 1940 falls within this band. The discrepancy between the orange and blue lines in recent decades as shown in Figure 3, suggests that the anthropogenic contribution to this warming could be in the order of approximately 0.2°C.”
Same with the average of all 6 graphs, including the NH one (which was weighed equally with the other 5):
“The largest deviation between the ANN [artificial neural network] projections and measured temperatures for six geographically distinct regions was approximately 0.2 °C, and from this an Equilibrium Climate Sensitivity (ECS) of approximately 0.6 °C [for a doubling of CO2 from 280 ppm to 560 ppm plus feedbacks] was estimated.”
So, again, even the copying error that left off a few tenths of a degree from one of the 6 records used would not change their results to any substantial degree. It is therefore not a “fundamental” error; it’s more like a typographical error…too minor to even niggle about. But, of course, since that’s all you have, that’s what you do: niggle.
So if I wrote that every sentence in which you claim that CO2 emissions must be reduced to avoid sea level rise and harm to the biosphere reads like you are screaming “Catastrophe!” and “The end of civilization!” and “Doom!” lurking around the corner, does that make it so because that’s how I have decided to interpret what you write? Or would you agree that I am not accurately representing your point of view by claiming that you are screaming “Catastrophe!” and “End times!” every time you point out that sea levels are rising and ice sheets are melting and oceans are warming? Or would you not mind if I wrote that you’re thinking/screaming that…since you actually aren’t?
@
There is nothing about Mann’s Hockey Stick that can’t be fixed by tossing it into the circular file and moving on.
Interesting that, even at the time it came out, they knew it wasn’t true, but embraced it anyway.
http://www.c3headlines.com/2014/04/from-expert-lead-author-the-sordid-ipcc-history-of-the-hockey-stick-fabrication.html
As much as there is wrong with the Hockey Stick, the only reason for anyone to continue pushing it is either profound ignorance, or willful duplicity.
http://www.c3headlines.com/2012/03/the-infamous-hockey-stick-tree-scientists-michael-mann.html
Re: “The paper was found in Google Scholar. Dr. FK Reinhart is a Swiss physicist who has published 100s of papers in the scientific literature. He is not a blogger.”
Your source is a blog, and it explicitly states that it’s a blog:
“Ce blog est un espace de liberté, pour des auteurs francophones.”
Reinhart is a blogger, insofar as he made a blogposts; a blogger is someone who blogs. And your reference to Google Scholar is irrelevant, since Google Scholar casts a wide net that sometimes include blogposts.
Re: “The peer-review process is not a reliable indicator of the fitness of a paper for publication.”
You don’t believe that. For example, everyday you rely on the fruits of peer-reviewed research in medicine, food science, air quality testing, satellite-technology, etc. Furthermore, you’d likely be appalled if your doctor recommended a medical treatment for your loved one, based on something the doctor read in a blog. Instead, you’d likely want the doctor to based their recommendation on, in part, peer-reviewed clinical studies on that treatment.
So you know the value of peer review. It isn’t perfect, but it’s better than the alternatives; best to not make the perfect the enemy of the good. It makes no sense to rely on crackpot blogs, just b/c peer review isn’t perfect; it’d be akin to relying on flying carpets for inter-continental travel b/c planes sometimes crash.
You’re basically engaged in a tactic of faux skeptics, where you unfairly attack on peer review, even as you rely on it. That tactic is debunked in sources such as:
“Denialism: what is it and how should scientists respond?”
“How the growth of denialism undermines public health”
“Science denial: a guide for scientists”
“HIV Denial in the Internet Era”
“Science denialism: Evolution and climate change”
Re: “Dr. William Briggs facilely exposed what “peer-review” did not”
Not really. Briggs just continued his practice of making ideologically-motivated mistakes that are easy to debunk. Not surprising, given his work with the ideologically-motivated David Legates.
Re: “It was one of many other graphs included in that paper…that also showed that modern temperatures are still well within the range achieved during then Medieval Warm Period, or that don’t fall outside the range of natural variability. There have been several other graphs of the Northern Hemisphere”
Nice try, but I’m familiar with the tricks you faux skeptics use. You usually avoid the hockey stick pattern by either:
1) cherry-picking temperature records from particular locations, or
2) focusing on temperature records from just the northern hemisphere (often the extra-tropical northern hemisphere).
Generating a more global picture by incorporating the tropics and southern hemisphere, reveals the hockey stick pattern. For example:
“Pacific ocean heat content during the past 10,000 years”
“A global multiproxy database for temperature reconstructions of the Common Era”
“Continental-scale temperature variability during the last two millennia”
“A reconstruction of regional and global temperature for the past 11,300 years” [further discussion at: http://www.realclimate.org/index.php/archives/2013/03/response-by-marcott-et-al/%5D
“Climate change 2013: Working Group I: The physical science basis; Information from paleoclimate archives” (figure 5.7 on page 409)
Your comment on “natural variation” is misguided, b/c it doesn’t address the numerous lines of evidence showing that most of the recent warming is anthropogenic and caused by CO2, not some non-anthropogenic, natural variation. There are quite a number of ways we can confirm that the the vast majority of recent CO2 increase is anthropogenic. For example, we can:
1) use carbon isotope ratios in atmospheric CO2 (anthropogenic emissions from fossil fuel burning would drop the relative proportions of C13 and C14)
2) show that the oceans likely aren’t a *net* releaser of CO2, since the oceans are acidifying (indicative of net CO2 uptake, not net CO2 release) and CO2 levels are increasing in the oceans
3) measure emissions from other non-anthropogenic sources (such as volcanoes), and see that anthropogenic emissions outweigh those sources
4) observe the decreased atmospheric O2 levels that one would expect from burning of fossils fuels as a contributor to CO2 emissions
5) observe the correlation between increased anthropogenic CO2 emissions and increased atmospheric CO2
6) examine the radiative forcing and temperature response changed from before to after the industrial revolution, consistent with anthropogenic CO2 emissions resulting in warming (as opposed to it just being non-anthropogenic)
And there are quite a number of ways to tell that increased CO2 caused most of the post-1950s global warming. For example:
1) Post-1950s stratospheric cooling
2) Post-1950s mesospheric cooling
3) Post-1950s thermospheric cooling
4) Post-1970s increase in radiation absorption at a wavenumber of ~666 cycles per cm, and other frequencies CO2 is expected is to absorb at.
5) Estimates of climate sensitivity (in excess of 3K for ECS) based on proxy records for CO2 and temperature.
6) Exclusion of other likely causal factors, such as the Sun (ex: solar-induced warming causes cooling the stratosphere, mesosphere, and thermosphere, yet scientists observed cooling in these layers).
Re: “It’s well known that the instrumental temperatures for the Southern Hemisphere are largely just “made up”. That’s what Phil Jones revealed in his exchanges with the dataset overseers, of course”
Not really; you just quote-mined without giving appropriate context. That’s a common tactic among faux skeptics when they discuss the “Climategate” e-mails.
But since you want to resort to that type of paranoid conspiracy theory, then remember that BEST, ERA-I, GISTEMP, etc. get about the same warming trends. Are you really going to claim they’re all falsifying their analyses as well?:
“A reassessment of temperature variations and trends from global reanalyses and monthly surface climatological datasets”
“Estimating changes in global temperature since the pre-industrial period”
Are the proxy records showing warming also fabricated?:
“Independent confirmation of global land warming without the use of station temperatures”
“A global multiproxy database for temperature reconstructions of the Common Era”
“Global warming in an independent record of the past 130 years”
How about the papers validating the homogenization of surface records; are they all falsified as well?:
“Coverage bias in the HadCRUT4 temperature series and its impact on recent temperature trends”
“Homogenization of temperature data: An assessment”
“Benchmarking the performance of pairwise homogenization of surface temperatures in the United States”
“Evaluating the impact of U.S. Historical Climatology Network homogenization using the U.S. Climate Reference Network”
“On the reliability of the U.S. surface temperature record”
“Homogenization of temperature series via pairwise comparisons”
Now we can see the problem with the conspiracy theories invented by faux skeptics like you:
“Conspiracy theories in science
[…]
One valuable guideline is to look for cascade logic in conspiracy arguments (Susstein & Vermeule, 2008). This occurs when defenders of one conspiracy theory find it necessary to implicate more and more people whose failure to discover or reveal the conspiracy can only be explained by their alleged complicity. Another guideline is to look for exaggerated claims about the power of the conspirators: claims that are needed to explain how they were able to intimidate so many people and cover their tracks so well. The more vast and more powerful the alleged conspiracy, the less likely that it could have remained undiscovered.”
Re: “I assume you agree that doubling CO2 from 280 ppm to 560 ppm (and 560 ppm to 1,120 ppm, and so on) yields only an additional 1.2 K of warming”
No, it yields ~3K or more of warming. The Planck response is less than the total amount of warming caused by CO2. Further context at:
“Climate sensitivity in the geologic past”
“Positive feedback in climate: stabilization or runaway, illustrated by a simple experiment”
Re: “which is largely beneficial considering the Little Ice Age was the coldest multi-centennial-scale period of the last 10,000 years”
Another faux skeptic talking point for you, with numerous problems. For example, you left out the droughts and wildfires that came with warming:
“Medieval warming initiated exceptionally large wildfire outbreaks in the Rocky Mountains”
“A 1,200-year perspective of 21st century drought in southwestern North America”
“The ‘Mediaeval Warm Period’ drought recorded in Lake Huguangyan, tropical South China”
There are also some other issues to deal with, such as:
– ocean acidification
– sea level rise
– increases hurricane intensity
– change in the location of plant pathogens
and so on.
By the way, we’re also in the middle of an anthropogenic mass extinction:
“Accelerated modern human–induced species losses: Entering the sixth mass extinction”
“Could a potential Anthropocene mass extinction define a new geological period?”
Re: “It’s only with assumed positive water vapor and cloud cover feedback that temperatures are believed to be capable of reaching the catastrophic levels (~3 C and up).”
Please don’t waste me time with your “catastrophic” straw man. I’m getting tired of faux skeptics abusing it:
“Additionally, we find that catastrophic anthropogenic global warming [CAGW] is essentially a term that is never used in the relevant scientific literature by mainstream sources. Furthermore, in the press it appears to be used exclusively by climate contrarians. The term is typically neither defined nor attributed to a mainstream scientific source. Our conclusion is therefore that CAGW is simply a straw man used by climate contrarians to criticize the mainstream position (50).”
https://link.springer.com/chapter/10.1007/978-3-319-20161-0_3
Anyway, water vapor feedback is positive; this is known, as opposed to simply “assumed”. For example:
“Observations of climate feedbacks over 2000–10 and comparisons to climate models”
“Anthropogenic greenhouse forcing and strong water vapor feedback increase temperature in Europe”
“Water-vapor climate feedback inferred from climate fluctuations, 2003–2008”
“Enhanced positive water vapor feedback associated with tropical deep convection: New evidence from Aura MLS”
“Upper-tropospheric moistening in response to anthropogenic warming”
“Global water vapor trend from 1988 to 2011 and its diurnal asymmetry based on GPS, radiosonde, and microwave satellite measurements”
“An analysis of tropospheric humidity trends from radiosondes”
And cloud feedback is positive; this is also known, as opposed to simply “assumed”. For example:
“Observations of climate feedbacks over 2000–10 and comparisons to climate models”
“Cloud feedback mechanisms and their representation in global climate models”
“Clearing clouds of uncertainty”
“A net decrease in the Earth’s cloud, aerosol, and surface 340 nm reflectivity during the past 33 yr (1979–2011)”
“A determination of the cloud feedback from climate variations over the past decade”
“Long-term cloud change imprinted in seasonal cloud variation: More evidence of high climate sensitivity”
“New observational evidence for a positive cloud feedback that amplifies the Atlantic Multidecadal Oscillation”
“Impact of dataset choice on calculations of the short-term cloud feedback”
“Evidence for climate change in the satellite cloud record”
“Thermodynamic constraint on the depth of the global tropospheric circulation”
Dr. Reinhart is a physicist who has published 100s of papers in science journals. I find it rather telling that you have nothing to critique about this paper other than its sourcing.
“The peer-review process is not a reliable indicator of the fitness of a paper for publication.”
I certainly do believe that peer-review is not a reliable indicator of fitness for publication. Peer-reviewed journals are only slightly less likely to accept deliberately flawed “hoax” papers as non-peer-reviewed journals.
https://wakeup-world.com/2017/08/17/the-failure-of-peer-review-especially-in-medicine/
“Any reviewer with more than a high-school knowledge of chemistry and the ability to understand a basic data plot should have spotted the paper’s shortcomings immediately. Its experiments are so hopelessly flawed that the results are meaningless. … The hoax paper was accepted by a whopping 157 of the journals and rejected by only 98. Of the 106 journals that did conduct peer review, 70% accepted the paper…”
Australian physicist Brian Martin elaborates in his excellent article Strategies for Dissenting Scientists: “Certain sorts of innovation are welcome in science, when they fall within established frameworks and do not threaten vested interests. But aside from this sort of routine innovation, science has many similarities to systems of dogma. Dissenters are not welcome. They are ignored, rejected, and sometimes attacked.”
A spectacular false dichotomy/straw man.
“Dr. William Briggs facilely exposed what ‘peer-review’ did not”
Great. Since it’s so easy, please provide your thorough debunking of Dr. Brigg’s critique of Mann’s paper. The four errors he identifies are rather elementary (I thought). But if you believe the logical errors and statistical malfeasance identified by Briggs do not exist, please do identify why you believe this.
Here are 75 non-hockey stick graphs from the Southern Hemisphere. They’re peer-reviewed. Therefore, they are truth. Right?
Half The Planet Has Not Cooperated With The ‘Global’ Warming Narrative
Here are another ~250 from the Northern Hemisphere (overlapping the above):
350 Non-Hockey Stick Graphs
I don’t think that paper helps you. The abstract says that the Medieval Warm Period was 0.65 C warmer than today (0-700 m layer), and that the Holocene Thermal Maximum was 2.0 C warmer than today. And here are the non-hockey stick graphs generated from that paper:
Pacific Ocean
Equatorial SSTs
Northern Hemisphere, Pacific Ocean Intermediate
–
The Marcott graph mixes instrumental temperatures with proxy temperatures, and the authors themselves indicate that the record for the 20th century lacks significance/isn’t statistically robust, and isn’t representative of global temperatures.
–
“Our global paleotemperature reconstruction includes a so-called “uptick” in temperatures during the 20th-century. However, in the paper we make the point that this particular feature is of shorter duration than the inherent smoothing in our statistical averaging procedure, and that it is based on only a few available paleo-reconstructions of the type we used. Thus, the 20th century portion of our paleotemperature stack is not statistically robust, cannot be considered representative of global temperature changes, and therefore is not the basis of any of our conclusions.”
–
My, your post is just too long, with too many misrepresentations and misguided conclusions to go through one by one. I’ll just respond to a few more of them for now.
–
“I assume you agree that doubling CO2 from 280 ppm to 560 ppm (and 560 ppm to 1,120 ppm, and so on) yields only an additional 1.2 K of warming”
No, apparently you’re confused by what the models say re: ECS vs. the direct convective response. To educate you, here are a few introductory papers:
http://www.atmos.washington.edu/~davidc/ATMS211/articles_optional/Hansen81_CO2_Impact.pdf
“The increase of equilibrium surface temperature for doubled atmospheric CO2 is ∼1.2°C. This case is of special interest because it is the purely radiative-convective result, with no feedback effects.”
–
http://www.atmos.washington.edu/2009Q1/111/Readings/Lorius1990_ice-core.pdf
“The radiative forcing resulting from doubled atmospheric CO2 would increase the surface and tropospheric temperature by 1.2°C if there were no feedbacks in the climate system.”
–
http://onlinelibrary.wiley.com/doi/10.1029/2005GL025540/pdf
“An increase in atmospheric CO2 concentration from 275 to 550 ppm is expected to increase radiative forcing by about 4 W m2, which would lead to a direct warming of 1.2°C in the absence of feedbacks or other responses of the climate system”
–
http://www.yaleclimateconnections.org/2009/04/recent-lower-global-temperatures/
“By itself, doubling atmospheric CO2 would increase global temperatures by about 1.2 degrees C. Even most of the scientists skeptical of the severity of climate change agree on this basic point.”
–
http://eaps.mit.edu/faculty/lindzen/236-Lindzen-Choi-2011.pdf
[W]arming from a doubling of CO2 would only be about 1°C (based on simple calculations where the radiation altitude and the Planck temperature depend on wavelength in accordance with the attenuation coefficients of wellmixed CO2 molecules; a doubling of any concentration in ppmv produces the same warming because of the logarithmic dependence of CO2’s absorption on the amount of CO2) (IPCC, 2007).
–
The Ocean Acidification Narrative Collapses Under The Weight Of New Scientific Evidence
Past Sea Levels Rose 4-6 Meters Per Century, Shorelines Retreated 40 Meters Per Year…Without CO2 Flux
–
10,000 To 5,000 Years Ago, Global Sea Levels Were 3 Meters Higher, Temperatures 4-6° C Warmer
Coastal Land Area Expanding – More Land Area Above Sea Level Now Than During 1980s
Scientific ‘Consensus’ Says ‘Global Warming’ Leads To Less Intense, Less Frequent Hurricanes
According to peer-reviewed science (published in the journal Nature), global warming will cause over 1 million species extinctions by the year 2050. That’s 30,000 species extinctions per year for the next 33 years. Since it’s peer-reviewed, and published in Nature, it therefore must be accurate (or at least mostly accurate). That is your position, right? So since I assume you believe we’ll get 30,000 species extinctions per year for the next 33 years (or something similar to that), do you think this kind of species loss would be catastrophic? Or will you refuse to use that word to describe losing 30,000 species per year?
According to Hansen et al. (2015), sea levels will rise by 10 feet by the year 2065…because the Antarctic and Greenland ice sheets will melt rapidly. Since the paper was ultimately accepted after peer-review…it’s true. Right? So do you believe that 2 feet of sea level rise per decade for the next 5 decades is a rate of rise that is…catastrophic? If not, what word would you use to describe it? Problematic? Inconvenient? Unfortunate? What?
If I find it worth spending any more time on, I’ll respond to some of your other points. But this has gotten too long as it is…
Greenies often jump the gun on calling Species “Exctinct.”
https://arizonadailyindependent.com/2017/09/10/thought-to-be-extinct-when-science-is-wrong/
Scroll down to “Species Extinction – One Million, or Just One?” for analysis of some of how estimates of species extinctions are exaggerated. (4th up from bottom of page)
http://www.john-daly.com/press/
[…] Read more at notrickszone.com […]
If you extend the graphs the sensitivity might be negative around 2100.
They are falling steadily without any levelling out, so it could be interesting times ahead.
IPCC has in due time changed from GW to Climate Change, so the scare can be uphold. No one remember at that time, that Climate Change was caused by temperature and not CO2 in itself.
“If you extend the graphs the sensitivity might be negative around 2100.” – Svend Ferdinandsen
So, some time after 2100 CO2 is going to stop warming the world, and start cooling it?
That’s going to leave a mark. No wonder they are in such a hurry to get all their phony mitigation schemes through and fascist restrictive laws past before their scam is discovered.
Potholer54 gives an explanation of why this article is based on junk science: https://www.youtube.com/watch?v=QFDnxMp0Hw8
It’s the we didn’t approve this paper’s publication, therefore it is wrong “rebuttal”.
According to the IPCC, the climate’s sensitivity for doubling CO2 itself (no feedbacks) from 280 ppm to 560 ppm is just 1.2 degrees C. Temperatures are only “believed” to reach levels much higher than that due to water vapor and cloud feedbacks. I find it odd that there is so much controversy about low climate sensitivity when even the IPCC has direct CO2 climate sensitivity at just a little more than 1 degree C upon doubling.
It’s amazing how you are riding on that word “believed” from an executive summary. Have you ever read the more detailed versions?
And why do you want to ignore the feedbacks?
The word “believed” is used because there has been no observational evidence that would support the contention that increasing cloud cover — which is what the models say will happen due to global warming — will cause more warming (+ feedback). The models are all over the place on water vapor and cloud feedbacks. They can’t even agree that cloud feedbacks are positive or negative.
http://journals.ametsoc.org/doi/abs/10.1175/JCLI-D-13-00025.1
This paper mainly addresses two issues that concern the longwave climate feedbacks. First, it is recognized that the radiative forcing of greenhouse gases, as measured by their impact on the outgoing longwave radiation (OLR), may vary across different climate models even when the concentrations of these gases are identically prescribed. This forcing variation contributes to the discrepancy in these models’ projections of surface warming. Second, it is shown that the stratosphere is an important factor that affects the OLR in transient climate change. Stratospheric water vapor and temperature changes may both act as a positive feedback mechanism during global warming and cannot be fully accounted as a “stratospheric adjustment” of radiative forcing. Neglecting these two issues may cause a bias in the longwave cloud feedback diagnosed as a residual term in the decomposition of OLR variations. There is no consensus among the climate models on the sign [positive or negative] of the longwave cloud feedback after accounting for both issues.
[…] NoTricksZone har författaren Kenneth Richard gjort en uppdatering av en tidigare sammanställning av […]
[…] https://notrickszone.com/2017/10/16/recent-co2-climate-sensitivity-estimates-continue-trending-toward… […]
[…] Wie erwähnt, liegen die Schätzungen der Klimasensitivität seit beinahe 30 Jahren im Bereich zwischen 1,5 und 4,5 Grad. Der „Erfinder“ der Treibhausthese, Svante Arrhenius, schätzte sie Anfang des 20. Jahrhunderts auf 5 bis 6 Grad Celsius, war also gar nicht so weit vom heutigen oberen Schätzwert entfernt. Die tatsächliche Temperatur-Entwicklung deutet jedoch auf einen Wert hin, der am unteren Ende der Skala, also bei undramatischen 1 bis 1,5 Grad liegt. Die Schätzungen werden mit jeder neuen Studie immer geringer. […]