NASA’s Massive Adjustments:
1910-2000 Now 53% Warmer
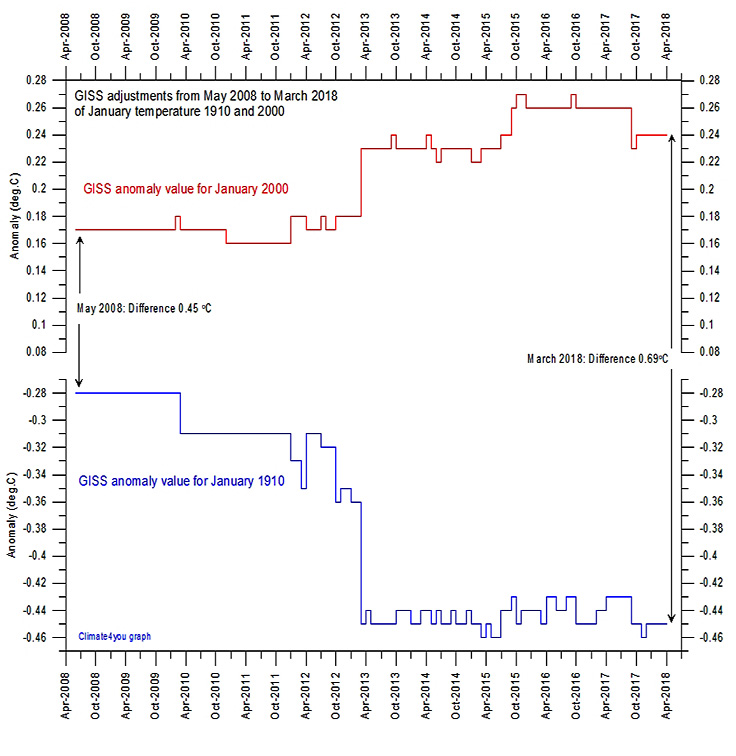
Image Source: climate4you.com
In the last 10 years, overseers of the NASA GISS global temperature data set have been busy utilizing cool-the-past-and-warm-the-present adjustment techniques to alter the slope of the overall warming trend.
For example, as the climate4you graph illustrates above, there was a +0.45°C difference between the 1910 temperature anomaly and the 2000 temperature anomaly as of May, 2008.
Today (March, 2018), NASA GISS has tendentiously adjusted up the difference between 1910 and 2000 to +0.69°C, a 53% increase.
The +0.5°C Warming Between 1880-1950 Has Been Erased
Changes to past data consistently serve to cool down the past and warm up the present.
As recently as 1987, for example, NASA GISS reported a warming trend of +0.5°C between 1880 and 1950.
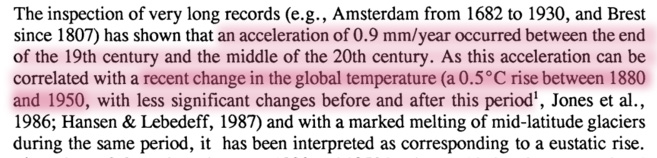
Pirazzoli, 1990
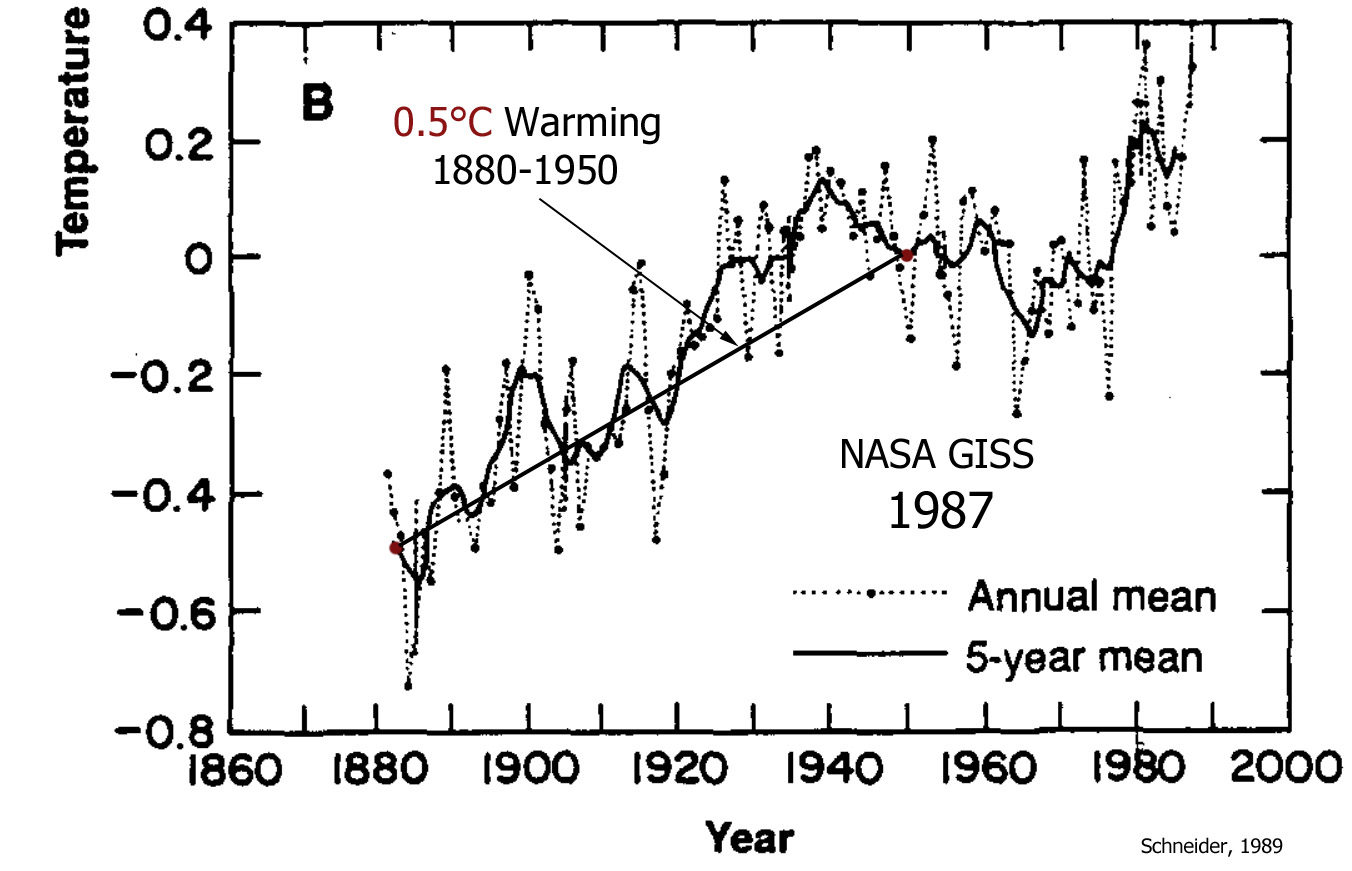
Schneider, S. H. 1989 Science 243: 771-81.
Today, the NASA GISS overseers have removed +0.5°C from 1880 to 1950 trend and replaced it with a 70-year pause. The 2018 NASA GISS graph depicts no change, a 0.0°C non-trend, between 1880 and 1950.
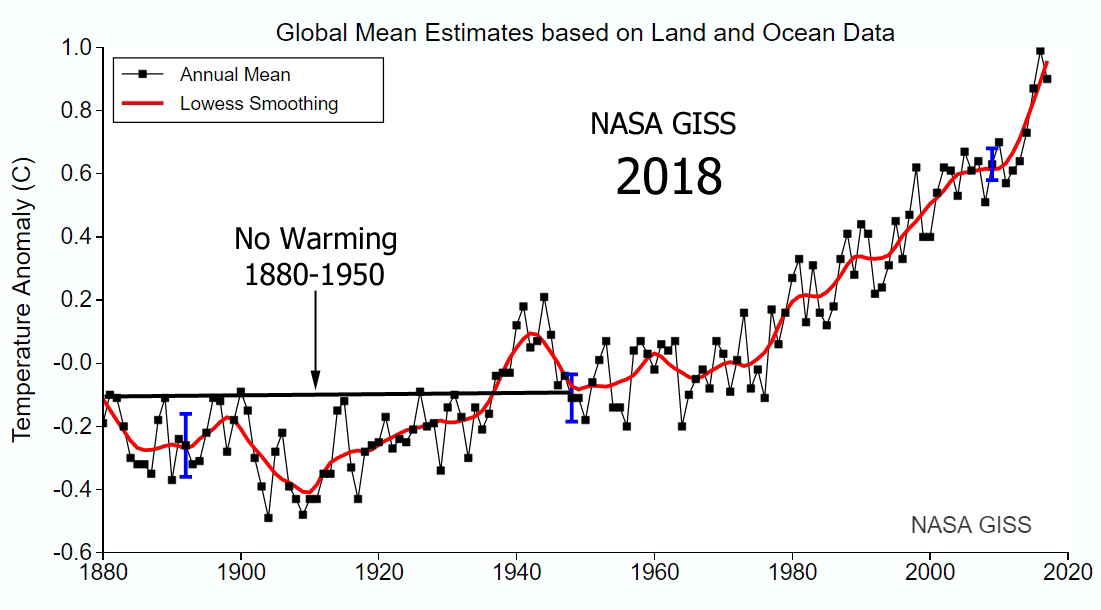
Image Source: NASA GISS
If NASA GISS temperature adjustments can maintain pace with the changes made in the last 10 years, perhaps a decade from now the temperature divergence between 1910 and 2000 will reach a monumental +1.0°C.
Or perhaps NASA GISS will discover there was a cooling trend of -0.3°C between 1880 to 1950 at some point in the next ten years.
We’ll just have to wait and see what temperature data changes NASA GISS will uncover for us next.


How much more evidence do we need to show that “Man-made global warming” is exactly what it states- Man-made, by crooked scientists, working on behalf of crooked politicians, backed by the “Greens”?
Everyone of them scamsters who deserve to be in prison for fraud.
The REAL “climate criminals!”
well that is first the evidence that it is darn hard to estimate a global or average temperature..
evidence of overconfidence from my point of view.
Indeed Bitter&twisted,
here’s a short video on what NASA/NOAA et al are doing with their maladjustments.
https://youtu.be/U6pZKZX0FYc
NASA, GISS, and NOAA scientists responsible for this should be in jail for violating federal criminal statutes: Section 2071 of Title 18 of the United States Code, the federal criminal law.
Look it up!
Could this change be anything to do with how anomalies are calculated and on what baseline?
I read sometime ago that it is theoretically possible for a given period to show a record high temperature while in reality the actual temperature could be anything up to 0.5° less than another because of the different periods used as the base.
One good reason, surely, why temperatures should be quoted in real figures. After all, there has to have been a real figure there to start with even if — as Hansen has admitted, global average temperature is “ not a useful metric”.
I keep being reminded of something a boss of mine said 50 years since about profit, that he paid his bills with money not percentages. For money, read temperatures; for percentages, read anomalies!
RESIDUALS – Bait And Switch
They talk about temperatures, but show us “anomalies.” Why is that?
https://notalotofpeopleknowthat.wordpress.com/2017/05/03/richard-lindzen-part-ii/
That would be bad enough, but in order to get the anomalies they want, they have to tamper with the raw data.
The accuracy of the temperature measurements are in the order of 2/10th of a degree C (and historically may be a lot worse), yet these institutions show anomalies in 1/100th of a degree precision. Once again these academics exchange real measurement accuracy and precision with erroneous and irrelevant levels of ‘confidence’.
I mark my student’s work down for “spurious accuracy”.
You can’t quote a mean to 3DPs, when you are only measuring to 2DPs.
Climate “scientists” can’t even get the basics correct.
We were never allowed to get away with being sloppy with “error propagation.” Not that after a lesson and a quiz on it anyone did. It’s such a simple concept, yet so VERY important.
Mulitsampling is a common practice to increase the resolution of a measurement. And of course a mean can be given at a higher accuracy than the measurements itself.
What is the mean of 4+5? Is it 4, is it 5 or is it 4.5?
http://www.ni.com/white-paper/3488/en/ (Improving Accuracy through Averaging)
As usual seb you’re wrong.
What only seem like a reference to the subject is of course being from you it is not.
Go away and find something about how to collate and average samples from many locations, using different measurement devices at different times. Then explain how you can average the results!
TomOmason, you have a 10*10 km grid with 100 thermometers with 1 degree accuracy. Half of them measure 14 degrees, the other half 15 degrees. What is the mean temperature of the area with those 100 thermometers?
Or you have an analog/digital converter with 10 bit resolution. You make 4 measurements per millisecond and average them. Can you go beyond the 1024 steps provided by a single measurement or not? What do you think?
Wrong as usual seb. You are complete dross at this.
I have professionally done such measurements and I know from what you write you have not. IT DOES NOT WORK like that! Only people that never have done this type of technical work come out with such cretinous rubbish.
Real world devices are not identical. Historical measurements where made with what sort of devices, how did they age?
Get back to burger flipping where you belong and leave the real thinking to us retired engineers.
Yep tom0, its funny to see seb stuck at junior high level of education in basically every facet of maths, science, physics etc.
And the fact that he relishes displaying his ineptitude and ignorance, makes it even funnier. 🙂
Indeed AndyG55,
The real dumbness of the idea is that a an area 10km x 10km can or should be the close to or at the same temperature at every location, and that for some lunatic reason, you ‘should’ average this to a mean temperature. Only someone deluded could think so. Topography rules here.
Then there’s how to fully characterized every thermometer devices’ to ensure every measurement error and drift falls within a Gaussian distribution curve, as they vary over time. And that’s only the beginning!
10bit resolution of an A to D does NOT define it’s accuracy! Lower junior high school mistake, seb.
Guess what seb, it could be a 20 bit resolution and not be accurate at all. Defining how all the characteristics of a good A to D vary over time is quite a challenge. In the real world seb, no measurement is perfect — ever!
However the real lunacy of the idea and it’s proposer is that this scenario has absolutely anything to do with the ‘NASA’s Massive Adjustments:
1910-2000 Now 53% Warmer’ and the graphics at the top of the page.
As you say AndyG55, only someone stuck in junior high science and maths educational level could even think it. Maybe he should go back to flipping burgers. 🙂
Why am I not surprised? The most extreme nonsensical views are usually held by retirees and you do not disappoint. Please stay of the internet and leave the work to a fresher generation who actually know something about current technology 😉
And please don’t use the profession of flipping burgers as an insult. That’s just disgusting.
More bigotry from SebastianH.
seb produces yet another faceplant EMPTY post.
Please stay away from science, physics, maths etc and anything requiring rational thought, until you have got out of junior high school, seb.
I wouldn’t even trust you to flip burgers.
Are you insulted seb,
They’re calling for more fries on table 3, move your ass!
And seb
I repeat “Go away and find something about how to collate and average samples from many locations, using different measurement devices at different times. Then explain how you can average the results!”
You can not do it.
YOU can not justify the method used as it is a nonsense. No seb you are devoid of a rational scientific method. You seb, have nothing!
Just another cAGW vassal.
seb the moron writes “Why am I not surprised? The most extreme nonsensical views are usually held by retirees and you do not disappoint. Please stay of the internet and leave the work to a fresher generation who actually know something about current technology”
I don’t suppose that seb can think beyond his assumed and prejudiced view of who or why someone retires, and at what age?
But why expect anything more from seb? From someone who does not need empirical evidence to back-up his presumed knowledge. Prejudiced morons think like that and seb is my evidence to prove the fact cAGW advocates can’t think rationally.
So Seb- they run a “model” 100 times and produce a spaghetti chart. Then they produce a “mean” of the 100 runs and report it as the best representation of the data. The reported metric has a 1/100 chance of being right, as only one (if any) of the strands of spaghetti can be correct. If they can prove that the actual run that best coincides with the “mean” run is correct, I will accept the results. Ever heard of the texas marksman?
What are you talking about? I think you missed the point a bit 😉
You had NO point except to display your mathematical ignorance, seb… YET AGAIN.
Burger flipper seb, doesn’t even understand what this [http://www.ni.com/white-paper/3488/en/]quoted paper is about. It’s high school, and YOU seb misunderstand it.
Sheesh what a moron.
🙂
That’s what actually bugs me the most: even if they are completely right about the temperatures, they expect me to get excited, give away everything, live like a Hobbit, because temps have gone up a degree in a hundred years…. yawn.
In case anyone missed it,
Seb is saying that they couldn’t read thermometers in the Arctic in the 1930s,40s
How can one person be so DUMB !!!
Nope, that is not what I said. But are you saying you trust temperature measurements from 90 years ago more than today’s? What’s the error range of those stations from nearly a century ago? How many stations were there back then?
Tell you what Seb. When the vikings have again reestablished farms on Greenland , and stayed there for 200 years, I will accept that climate change has resulted in temps that lie outside of historical values. One doesn’t need thermometer readings to know history.
Indeed R2Dtoo,
I mere glance at historical temperatures across the globe, and the atmospheric CO2 levels at each historic point, IMO more than anything show that CO2 does not, and never have, governed this planet’s temperature.
Look here and judge for yourself how CO2 levels and this planet’s temperature don’t run together. http://rockyhigh66.org/stuff/tempco2570mlefttoright.png .
“Nope, that is not what I said”
That is EXACTLY what you said.. Your own words quoted.
Seems you can’t even tell the TRUTH to yourself
What a sad little non-entity you are.
In many cases, modern day temperatures have been found to be HIGHLY contaminated by urban encroachment.
The new AWS thermometers have major issues in reliability and in making comparisons to past temperature readings by people highly dedicated to their job.
Child-minded SJWs like you don’t know the meaning of the word s dedication to ajob.
You are definetely dedicated to “your job” of making skeptics look ridiculous.
So, how was temperature measured in the Artic back then vs. now?
Seb now admits ignorance about how thermometers work.
You really are looking incredibly dumb today, seb.
AndyG55,
“Seems you can’t even tell the TRUTH to yourself “ is the very problem the deluded have.
No warming trend for 96 years, 1976 anomaly is -0.11C…..
Anybody agree that the 25 year cooling trend 1940-1965 was caused by WWII? Or was there some colossal eruption in 1939-40? Nazi green initiatives had too great an effect? Aliens at Roswell?
The cooling generally lasted from the 1940s to mid-1970s.
The 1940s to 1970s cooling was likely caused by global dimming — a decadal-scale increase in cloud cover over the tropics. The subsequent warming from the 1980s onward was likely caused by a decrease in cloud cover over the tropics.
More clouds, less solar radiation heats the oceans. Less clouds, more solar radiation heats the oceans.
http://www.sciencemag.org/content/295/5556/841
“It is widely assumed that variations in Earth’s radiative energy budget at large time and space scales are small. We present new evidence from a compilation of over two decades of accurate satellite data that the top-of-atmosphere (TOA) tropical radiative energy budget is much more dynamic and variable than previously thought. Results indicate that the radiation budget changes are caused by changes in tropical mean cloudiness.”
—
http://www.atmos-chem-phys.net/13/8505/2013/acp-13-8505-2013.html
“[T]here has been a global net decrease [of 3.6%] in 340 nm cloud plus aerosol reflectivity [which has led to] an increase of 2.7 W m−2 of solar energy reaching the Earth’s surface and an increase of 1.4% or 2.3 W m−2 absorbed by the surface [between 1979 and 2011].”
Hmm, and here I thought global dimming was caused by aerosols released by mankind. The usual information sources must be wrong again and whatever skeptics believe must have happened instead 😉
1. Global dimming and brightening are predominantly influenced by clouds more than aerosols. 2. Aerosol depth changes are predominantly determined by volcanism, not anthropogenic emissions, with the latter accounting for a “negligible” fraction of aerosol depth changes.
—
http://onlinelibrary.wiley.com/doi/10.1002/2013JD021308/abstract
“It is concluded that at the sites studied changes in cloud cover rather than anthropogenic aerosols emissions played the major role in determining solar dimming and brightening during the last half century and that there are reasons to suppose that these findings may have wider relevance.”
—
http://onlinelibrary.wiley.com/doi/10.1002/2014JD022076/abstract
The contribution of clouds and aerosols to the decadal variations of downward surface shortwave radiation (SSR) is a current controversial topic. … Overall, three fourths of the SSR trend is explained by clouds, while the other one fourth is related to aerosol changes.”
—
Neely et al., 2013
http://onlinelibrary.wiley.com/doi/10.1002/grl.50263/abstract
“We employ model runs that include the increases in anthropogenic sulfur dioxide (SO2) over Asia and the moderate volcanic explosive injections of SO2 observed from 2000 to 2010. Comparison of the model results to observations reveals that moderate volcanic eruptions, rather than anthropogenic influences, are the primary source of the observed increases in stratospheric aerosol.”
—
Höpfner et al., 2013
http://www.atmos-chem-phys.net/13/10405/2013/acp-13-10405-2013.pdf
“The increase in the stratospheric aerosol concentration observed in the past years is caused mainly by sulfur dioxide from a number of volcano eruptions. Variation of the concentration is mainly due to volcanoes. Lower stratospheric variability of SO2 could mainly be explained by volcanic activity and no hint for a strong anthropogenic influence has been found.”
—
http://journals.ametsoc.org/doi/pdf/10.1175/1520-0493%281980%29108%3C1430%3ATIATAT%3E2.0.CO%3B2
“Conclusions: The trends in [anthropogenic] atmospheric transmission at the three locations examined in this paper are very small, perhaps nonexistent, and generally not statistically significant. If the trends in atmospheric transmission and hence anthropogenic aerosols are small near their presumed sources, then the global increase in aerosols must be very small indeed. Consequently, the effects of anthropogenic aerosols on climate is probably negligible. … [T]here is no evidence for an increase in anthropogenic aerosols on a global scale and hence they are unlikely to be important climatically.”
—
http://www.tandfonline.com/doi/pdf/10.1080/00022470.1975.10470118
“The scientific community (e.g., SCEP1 and SMIC2 ) has become increasingly aware in recent years of the importance of atmospheric aerosols and their optical properties in possible climate modification. The aerosols in the atmosphere consist of man-made and natural particles, and it is the man-made contribution due to combustion added to the natural (dust, sea spray, forest fires, and volcanic dust) background that is generally considered to be important in determining climatic changes. However, the man-made contribution on a global scale is quite small; estimates range from a negligible amount to about 6% of the natural background.”
—
http://journals.ametsoc.org/doi/pdf/10.1175/1520-0469%281973%29030%3C0101%3AOALDFM%3E2.0.CO%3B2
It has been estimated (Squires, 1966; Selezneva, 1966; Hidy and Brock, 1970; Robinson and Robbins, 1970) that the anthropogenic component of the global particulate burden of the atmosphere amounts to 5-12%; not, it would seem a very alarming figure. … Ellis and Pueschel (1971), in a report based on solar radiation data at Mauna Loa for the period 1958-70, conclude that human activities have not affected the atmospheric turbidity on a global scale.
—
http://link.springer.com/chapter/10.1007/978-94-010-3290-2_15
“The secular increase of global atmospheric particulate loading by human activity is estimated, and compared with a construction of the secular variability of stratospheric dust loading derived from data on volcanic activity since 1850. It is concluded that the total human-derived particulate load is at present comparable to the average stratospheric dust load from volcanic eruptions, but that the variations of human-derived loading are an order of magnitude less than those of volcanic dust loading.”
—
I see, so it is only a coincidence that the brightening started right after pollution control went into effect?
And these very often cited papers/authors are all wrong:
https://www.sciencedirect.com/science/article/pii/S0168192300002410
https://agupubs.onlinelibrary.wiley.com/doi/full/10.1029/2008JD011470
https://agupubs.onlinelibrary.wiley.com/doi/full/10.1029/2006GL028031
https://agupubs.onlinelibrary.wiley.com/doi/full/10.1029/2006GL026471
https://agupubs.onlinelibrary.wiley.com/doi/full/10.1029/2008JD011382
Sulphate emissions loading by humans were much higher during 1975-2000 than they were during 1940-1975.
https://www.researchgate.net/figure/Time-series-of-anthropogenic-sulphur-dioxide-emissions-in-TgS-yr-1-and-sulphate-aerosol_fig15_229862704
This demonstrates that anthropogenic aerosol emissions loading bear little to no resemblance to the global dimming/brightening trends. Again, cloud cover changes are more significant in albedo-induced Surface Solar Radiation than aerosol loading, which is mostly natural (volcanism), not anthropogenic.
High correlation, volcanic aerosols and climate (graph)
The link above shows high volcanic activity (high natural aerosol releases) during 1880-1910, 1945-1975, when cooling temperatures occurred. Low or no volcanic activity during 1920-1945 corresponds to the warming during those decades.
http://journals.ametsoc.org/doi/pdf/10.1175/1520-0450%281976%29015%3C0933%3AOTROHM%3E2.0.CO%3B2
“Climate is variable. In historical times, many significant fluctuations in temperature and precipitation have been identified. In the period from 1880 to 1940, the mean temperature of the earth increased about 0.6°C; from 1940 to 1970, it decreased by 0.3-0.4°C. Locally, temperature changes as large as 3-4°C per decade have been recorded, especially in sub-polar regions. … The drop in the earth’s temperature since 1940 has been paralleled by a substantial increase in natural volcanism. The effect of such volcanic activity is probably greater than the effect of manmade pollutants.”
Wrong again seb.
“and here I thought global dimming… blah . blah.. “
So you ADMIT that there was SUSTAINED COOLING from 1940-1970.
Tiny steps, seb
Watch out you don’t faceplant as usual on your next post. !!
One reason why the 1880 – 1950 0.5C anomaly as of 1987 was reduced to 0C is because according to CC™ dogma: “most of the observed increase in global average temperatures since the mid-20th century is very likely due to the observed increase in anthropogenic greenhouse gas concentrations” and that invites the obvious question what caused an equal and corresponding warming prior to 1950.
Since the human emissions before ~1945 were relatively insignificant, as in the case of the MWP, it had to be ‘disappeared’ Yezhov-style:
https://ourworldindata.org/wp-content/uploads/2017/04/Global-CO2-emissions-by-region-since-1751.png
Correct. When the data don’t fit the modeled expectations, change the data.
That’s “post modern” science at work.
At this rate we will be making sacrifices to the climate gods.
Oh hang on……
I dare you to come up with better adjustments. Do you have the time to do some actual science instead of “blogscience”?
Poor seb, TOTAL DENIAL of facts,
The adjustments are OBVIOUS, even to a blind monkey,
https://img.elo7.com.br/product/100×80/D55041/emoji-20x20cm-emoji.jpg
and they are ALWAYS done to support some cause of the AGW scam.
Remain WILFULLY BLIND, little seb. Its who you are.
They aren’t … sea surface temperature got adjusted to be warmer than what was recorded because of the method used at the time. And since most of the surface is covered by water that’s the overall adjustment direction of the past.
https://www.ncdc.noaa.gov/monitoring-references/faq/temperature-monitoring.php
But whatever, I guess that also supports the AGW case. Doesn’t matter in which direction adjustments go, right?
ROFLMAO.
Seb produces a graph that shows how the RAPID WARMING pre-1940 was removed.
HILARIOUS !!
How inconvenient to the AGW scam was that rapid warming pre-1940, seb. 😉
seb says “I dare you to come up with better adjustments. “
Simple do not do it!
Your assertion that they REQUIRE adjustments is (as always with your assertions) just wrong.
Unless you have complete and validated characterization data for each and every measuring device over time you can not just arbitrarily adjust (attempting to normalize the measurement errors) when all devices errors are unknown.
Anyone advocating that type of adjustment is a scientific idiot, and should go back to helping seb flip burgers where they belong.
OT, Great article over at Paul’s place. 🙂
https://notalotofpeopleknowthat.wordpress.com/2018/03/18/clean-coal-is-the-way-to-power-africa-and-south-african-academics-know-how/#more-32859
Nearly 2.5ºC of “adjustments from raw to reported USA temperatures.
https://realclimatescience.com/wp-content/uploads/2018/03/2018_03_20_05_47_24.png
This is how both NASA graphs look like when overlayed with each other:
[fabrication removed]
So it depends on which date you compare what direction of adjustment you get. In general … does it really matter? You skeptics don’t trust the adjusted data from 1987 either, right? Why? Because it doesn’t show that 1940 was a warm as today as you feel must be true …
What an incredibly PATHETIC ATTEMPT to mask the manic adjustments.
As you have been told about 10 times now when you dishonestly overlay these graphs, you are using starting points (1880) that are wildly different. Use the same data point location for the start year (1880) and notice how the 1987 graph’s trajectory shoots up by about 0.5 C above the 2018 graph. This is the exact same dishonesty employed by the data manipulators. Because you continue to post this fabrication, I will delete the link any time I see it from here on out. Use the same starting year data point and the image will be allowed to remain.
There is a VERY OBVIOUS agenda behind these “adjustments”
https://s19.postimg.org/z4a5119ir/adjustments_vs_CO2.png
In the USA at least, basically ALL pseudo-warming comes from DATA ADJUSTMENTS.
and the same “adjustments” have been found in MANY parts of the world, following the same pattern
Get rid of the 1940’s peak
Increase surface trends to try to hide the fact of ZERO non-El Nino warming in satellite data
Latest is illustrated in the “disappearing” of the steep warming from 1880-1925.
EVERY major adjustment to get rid of an “INCONVENIENT FACT” that destroyed the AGW fartasy.
What the hell is wrong with you?!?!?! It’s both graphs from this very article overlayed over each other in the only correct way to do it (matching the part in the near present).
You can’t do it like that, but then again you didn’t understand the baseline thing anyway. Want to post a woodfortrees graph without the baselines adjusted? 😉
You really got to be kidding me.
Remade that graph according to Kenneths wishes:
https://imgur.com/a/DAjHv
Notice the problem with non-matching baselines (both graphs have a baseline perdiod of 1951-1980, 30 years)? Kenneth, why do you want join those graphs at the beginning, it makes no sense. But if you do, you have to acknowledge the offset between both. If you manage to do that there really is no difference between the graph you call “fabricated” and the version you like.
If you don’t mention the offset, then it is you who is dishonest.
Almost. The starting point (1880) is still different by 0.1 C. But we’ll let it stand. Interesting how much the adjustments have changed the 1880-1950 trends, huh?
And when we consider the urban heat island and removing hundreds of rural stations since the 1980s to create the artificial warming favored by the alarmists, we see that the 1940s peak is no warmer than the 2000s peak, which is what the instrumental record for the Arctic shows:
https://notrickszone.com/wp-content/uploads/2017/01/Arctic-Surface-Temps-1920-2016.jpg
Unbelievable! It is an exact match of the 1880 temperature value. Don’t confuse the 5-year mean line of the older graph with the red linear regression line in the newer graph. Not the same at all …
That is also visible when you overlay the graphs the correct way and not the skeptics way. The slope of the lines doesn’t change due to the vertical offset.
No, we don’t see that at all. That is made up skeptics stuff. A result of your imagination.
Scientists Expose Data Manipulation, ‘Hide The Decline’, And The Post-1940s Hockey Stick Temperature Myth
“No, we don’t see that at all. “
Poor seb, in TOTAL DENIAL of data that is in front of his eyes.
Basic graph comprehension, in fact, anything to do with rational thought, seems to be BEYOND his feeble abilities.
seb needs to do a stint dish-washing before they let him anywhere near the burgers. !!
“The slope of the lines doesn’t change due to the vertical offset.”
Yep, no matter how you try and hide one behind the other, there is still a 0.5C difference between 1880 and 1950 in the original, and ZERO difference in the second.
History lesson for seb, more DENIAL of climate change expected.
https://s19.postimg.org/kblcdu6ar/Arctic_1976.gif
Read it all from the FIRST SENTENCE..
Also note specifically the second highlighted section.
Does that match NASA’s mal-adjusted 2018 fabrications ?
Also note, that Ice is returning to Iceland shore AFTER 40 YEARS, words that match the Arctic sea ice extent as shown here.
https://s19.postimg.org/hcmhnqak3/Arctic-_Sea-_Ice-_Alekseev-2016-as-shown-in-_Connolly-2017.jpg
No seb, your anti-maths attempt to hide the adjustments is a NOTHING but a piece of failed junior high junk.
Not only has NASA/GISS changed the inconvenient warming from 1880 to 1950 to a zero trend (despite your laughably FEEBLE attempt to hide it.)
They have also got rid of most of the cooling from 1940-1970 as shown on the NAS graph.
https://s19.postimg.org/a37ebw1cz/NAS_1975.png
Do your REALLY think this MANIC DATA CORRUPTION is any sort of science?
Are you REALLY that DISHONEST. !!
[fabrication removed]
Uh, no. The “only correct way to do it” is not to make the trend line starting point (1880) for both graphs vastly different (by 0.4 C). It’s the only fabricated way to make the graphs look similar. So that’s why you do it.
How much warming has there been since 1880? Your way: make the 2018 trend line start 0.4 C above the 1987 trend line starting point. You know that if you make the starting point the same, the discrepancy appears. So you make the starting point wildly different. It’s your way of “hiding the decline”.
We’re not operating with baseline data here. We’re directly comparing graph trend line shapes. You’re falsely adjusting the shape of the trend line by making one trend line start one place and the other trend line in another. This has been explained to you about 10 times, and yet you keep on posting the same deception anyway. No longer. You’re done.
Use the same starting year data point and the image will be allowed to remain.
Let’s see what the overlay looks like when the trend line start point (1880) is in the same location for both graphs. How’s it look, SebastianH? Do they match up? No? You’ve just “discovered” the reason why your fabrications are no longer welcome here.
The only way to match graphs is to match the values. If there is an offset, adjust for it. Since both graphs are anomalies with the same baseline period, the match is easy. No offset, so a 0.0 in one graph is 0.0 in the other graph.
No, it is the only way to join graphs that makes sense. The trends don’t change at all by using an offset as you propose to make the 1880 datapoints match. So what is the point of doing that?
Oh boy this can’t get weirder, can it? The trend line shapes do not change by changing the offset between two lines. I am not adjusting the shape of the trend line, this is just wrong and you are now totally out of your mind as it seems.
The trend lines look EXACTLY THE SAME. They don’t change by using offset (my offset being 0.0, yours close to 0.3 or 0.4 if you believe the red line is also a 5 year average as you seem to do).
Something is seriously wrong with you thinking that the correct way to match those graphs is a deception. Even calling it a fabrication.
As the NASA graphs show, there was a 0.5 C warming between the 1880 and 1950 data points in their 1987 graphical representation of global temperatures. By changing the shape of the trend line (i.e., suppressing the 1910s to 1940s warming), today’s graph not only eliminates the 1940s to 1970s cooling, it makes the 0.5 C warming between 1880 and 1950 disappear. Since this is what people on your side want to believe — that warming occurs when CO2 emissions rise, and generally doesn’t independent of anthropogenic influences — the trend line as it exists today is preferred. When the data do not fit the modeled expectations, change the data.
Robust Evidence NOAA Temperature Data Hopelessly Corrupted By Warming Bias, Manipulation
If they did, 0.5 C of warming would not have been completely removed from 1880 to 1950. But I understand your desire to defend the data manipulation.
And 30,000 species are going extinct every year too.
This one is a less messy graph.
https://s19.postimg.org/asqn7o8kj/NASA-_Global-_Surface-_Temps-1987-1880-1950-0_5_C.jpg
Maybe you will remove your brain-numbing AGW blinkers and finally STOP DENYING the fact that a 0.5ºC difference has been “FALSIFIED” to become a zero difference.
Why do you both assume that the temperature at the starting point is identical and later data point we’re adjusted downwards? Why can’t you recognize that 1880 was adjusted upwards?
This is really weird. But then again, I am just washing the dishes waiting to be promoted to flipping burgers or something like that … doesn’t matter what your opponents say, as long as you can try to insult them with meaningless phrases.
As of 1970, the National Academy of Sciences reported a 0.6°C global warming between 1880 and 1940 and a 0.3-0.4°C global cooling between 1940 and 1970. Today, NASA shows about 0.2°C of warming between 1880 and 1940 and almost no cooling between 1940 and 1970. Why were the earlier-recorded data wrong, SebastianH? Why did the warming and cooling need to be removed?
Benton, 1970
http://www.pnas.org/content/67/2/898.short
“In the period from 1880 to 1940, the mean temperature of the earth increased about 0.6°C; from 1940 to 1970, it decreased by 0.3-0.4°C. Locally, temperature changes as large as 3-4°C per decade have been recorded, especially in sub-polar regions. … The drop in the earth’s temperature since 1940 has been paralleled by a substantial increase in natural volcanism. The effect of such volcanic activity is probably greater than the effect of manmade pollutants.”
Basic graphical and data comprehension is obviously BEYOND YOU, seb
There WAS an increase of about 0.5C from 1880-1940,50 in basically ALL temperature data.
That has now been TOTALLY ERASED by NOAA because it was very INCONVENIENT to have that much warming when CO2 was much lower than now.
Your flaccid attempts at DENIAL of this fact is NOTHING but anti-science idiocy.
You really are a true CLIMATE CHANGE DENIER, ser.
Is someone able to please provide links to download locations for:
(a) The “original”, entire and unadjusted data sets.
(b) The latest and entire adjusted data sets.
(I couldn’t find the links in this post, or the comments, though the data sets are mentioned.)
I wish to use these as a teaching aid for students in high school statistics (math.) classes, as a comparison example of the potential risk of custodial corruption/misuse of data that can occur to observational truth (raw data) when left in the custody of religio-political ideological zealots who may be required to produce propaganda.
(This is for a New Zealand school.)
Thanks in anticipation.
Regards,
S.
The graph is not understandable. There is tow lines red and blue, both from 2008 to 2016. Its not explained what they represent or how the text about 1910 fits in.
Look more closely. Read the text..
The top graph is the changes to the January 1910 (blue)and January 2000 (red) temperature anomalies in each monthly iteration of the GISS data from May 2008 to March 2018
You can clearly see that the January 2000 (red) data has be “mal-adjusted” upwards while the January 1910 (blue) data has been “mal-adjusted” downwards.
This sort of unsupportable anti-science leads to an unrealistic warming in their FABRICATION of the surface temperatures.
hmmm.. It WET outside !! East coast low, dumping rain on the East coast from Newy up to Port Mac.
http://www.weatherzone.com.au/radar/nsw/newcastle/128km
But gees, the Hunter region needed it !! 🙂
[…] by K. Richard, March 19, 2018 in NoTricksZone […]
[…] https://notrickszone.com/2018/03/19/since-2008-0-24c-of-extra-warming-has-curiously-been-added-to-nas… […]
If your hypothesis isn’t supported by the data and you decide to adjust the data to support your hypothesis then you’re not a scientist and you’re not doing science.
Indeed ScienceABC123,
What kind of science adjust to 1/100th of a degree when the basic measurement devices measurement accuracy is at best in 1/10th of a degree? What kind of ‘science’ regularly exchanges measurements for levels of ‘confidence’?
The only way to stop global warming is to turn off NASA climate computers. Otherwise, we will soon see the movie The Grapes of Rapture–The 1930 Great Ice Age.
Off topic but probably of interest here —
Coldest late February night on Germany’s highest peak in over a century (2018)
https://www.thelocal.de/20180227/coldest-late-february-night-on-germanys-highest-peak-in-over-a-century
NASA has adjusted Brazil’s temperatures so much they are now at odds with INMET’s (Brazil’s meteorological Agency) for their January map of Brazil.
See https://mobile.twitter.com/gddcunha1961/status/974482826719526912
or
https://www.iceagenow.info/i-wonder-where-noaa-gets-its-temperature-readings/
[…] https://notrickszone.com/2018/03/19/since-2008-0-24c-of-extra-warming-has-curiously-been-added-to-nas… […]