The Sun in April 2018
By Frank Bosse and Fritz Vahrenholt
(Translated, edited and summarized by P Gosselin)
The sun was inactive in April, as we currently find ourselves in the minimum between solar cycle (SC) 24 and the coming solar cycle 25.
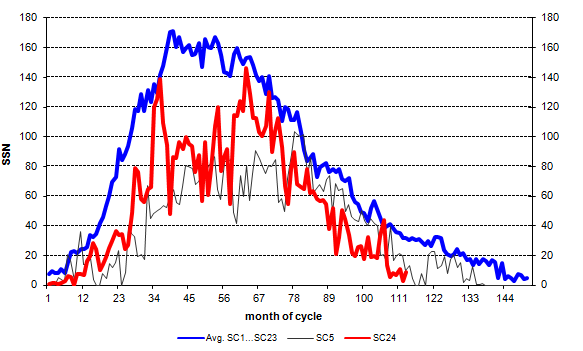
The recorded mean sunspot number (SSN) for April was 8.9, which is only 28% of what is usual 113 months into a solar cycle. In April, 16 days were spotless. The following chart shows sunspot activity:

Figure 1: Plot of the monthly sunspot activity for the current cycle (red) compared to SC 5 (black) and the mean of the previous 23 recorded cycles (blue).
Next what follows is a chart of the sunspot activity, as measured by satellite. As spot activity rises, so does total solar irradiance (TSI):

Figure 2: Total solar irradiance (TSI) at mean Earth distance since 2004, (source here). The rise of 1.5 W/m² between minimum and maximum is clearly observed, and translates to approx. 0.4W/m² atmospheric effective fluctuation.
The chart above illustrates the relationship between sunspot activity and TSI. The sharp peaks of greater than 3 W/m² show the effects of large sunspots that darken the sun’s surface.
The question that arises: “Why does TSI increase when there are dark spots?“ This can be answered when the spectral share of the ultraviolet range is accounted for. When dark spots appear, there is a greater source of UV light (faculae), which overcompensates for the visible light.
Figure 2 above also shows us that we reached a minimum in 2018.
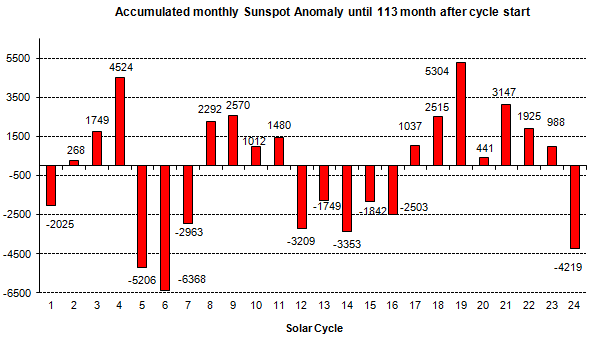
The following chart, Figure 3, is a comparison of solar activity of all the previous solar cycles recorded thus far since 1755:

Figure 3: The accumulated monthly sunspot anomaly until 113 months into the cycle. The current solar cycle has been well below the mean in activity, and is the weakest in close to 200 years since SC 6.
Arctic sea ice volume greater than 2014
Meanwhile, the earth’s surface has cooled since the last powerful El Nino ended, and thus could be having some effect on Arctic sea ice.
Japanese climate skeptic and blogger Kirye tweeted yesterday that Arctic sea ice volume has in fact exceeded the level seen in 2014, and is now just somewhat below average, and so fully within the range of natural variability:
The current #Arctic sea ice volume has exceeded that of 2014, and is now at a five-year high.
ʕ´•ᴥ•`ʔ
DMI:https://t.co/l84iFSHY3z
~#地球温暖化? #温暖化? #気候変動 #GlobalWarming? pic.twitter.com/CDdvqp40ly— キリエ (@KiryeNet) May 24, 2018
Arctic sea ice volume has been falling only slowly this spring and is now higher than 2014 levels.
Also a satellite image of the northern hemisphere ice cap presented by Pure Climate Skeptic at Twitter shows widespread snow and ice:
https://twitter.com/Carbongate/status/999912412370288640


If I recall correctly, the solar cycle parameter that correlates best with global temperature is the length of the cycle rather than the strength. I’ve also heard that a cycle 25 spot has already been observed in the last month or two so we may have to wait and see if there will be a strong signal for solar cooling.
We’re going to need to do something with the excess polar bears too.
https://polarbearscience.com/2018/05/24/status-of-canadian-polar-bears-updated-map-from-environment-canada/
I follow DMI ice volume as well.
The sliding seven-day window of ice volume decline is the slowest for the last seven days in any year the DMI has reported.
If this continues just a couple more days, 2018 will pass the next closest year, which is declining more rapidly than it is.
Very interesting!
[…] Fonte: No Tricks Zone […]
Sea ice extent and volume is primarily controlled by lower latitude lressursd atmospheric displacement. NH poleward displacement is lower than to the SH with the NH below mean currently.
The factors that will influence the ice after the June solstice are the level of ocean heat release and timing, the influence on troposphere pressure and whether the pressure displacement has a NH or SH bias. A lot can change after the solstice.
[…] F. Bosse and F. Vahrenholt in P. Gosselin, May 25, 2018 […]
2018 is now #7 in the DMI ice volume for the 26th of May, having passed 2009.
@Steven Fraser 27. May 2018
“2018 is now #7 in the DMI ice volume for the 26th of May”
Hopefully this is just a mere blip in our travels out of the last LIA and not the start of a new trend indicating general global cooling.
Cooling would be so detrimental for all life on the planet. A continuation of this natural warming (as has happened since the mid-1800s) would be highly beneficial for all, especially if those atmospheric CO2 levels continue to increase.
But as solar activity drives our climate and is waning, it is likely we will go into a cool period but for how long? Best estimates figure anything from decades to a century.
“Hope for the best, prepare for the worst” as the old saying goes. However in this modern world we have built a system that is predicated on constancy of supply, holding little in stock, and relying on ‘just-in-time’ ordering of foodstuffs and goods. How long before that fails?
[…] https://notrickszone.com/2018/05/25/solar-activity-drought-now-only-28-of-what-is-normal-arctic-sea-i… […]