In direct contrast with CO2-centric climate modeling, extensive paleoclimate evidence affirms that the Holocene climate has been far more variable in the past 12,000 years than during the relatively quiescent period we’ve enjoyed since the mid-19th century. In the absence of CO2 concentration changes or human interference, abrupt global cooling episodes led to agricultural collapse, famines, and the extirpation of ancient civilizations. These naturally-occurring climate events are likely to recur…and we will be powerless to intervene.
Between 1860 and 2014, CO2 concentrations rose dramatically (from 285 parts per million to 400 ppm), and yet global temperatures have fortunately remained relatively stable, with an overall per-decade change rate of just 0.05°C.
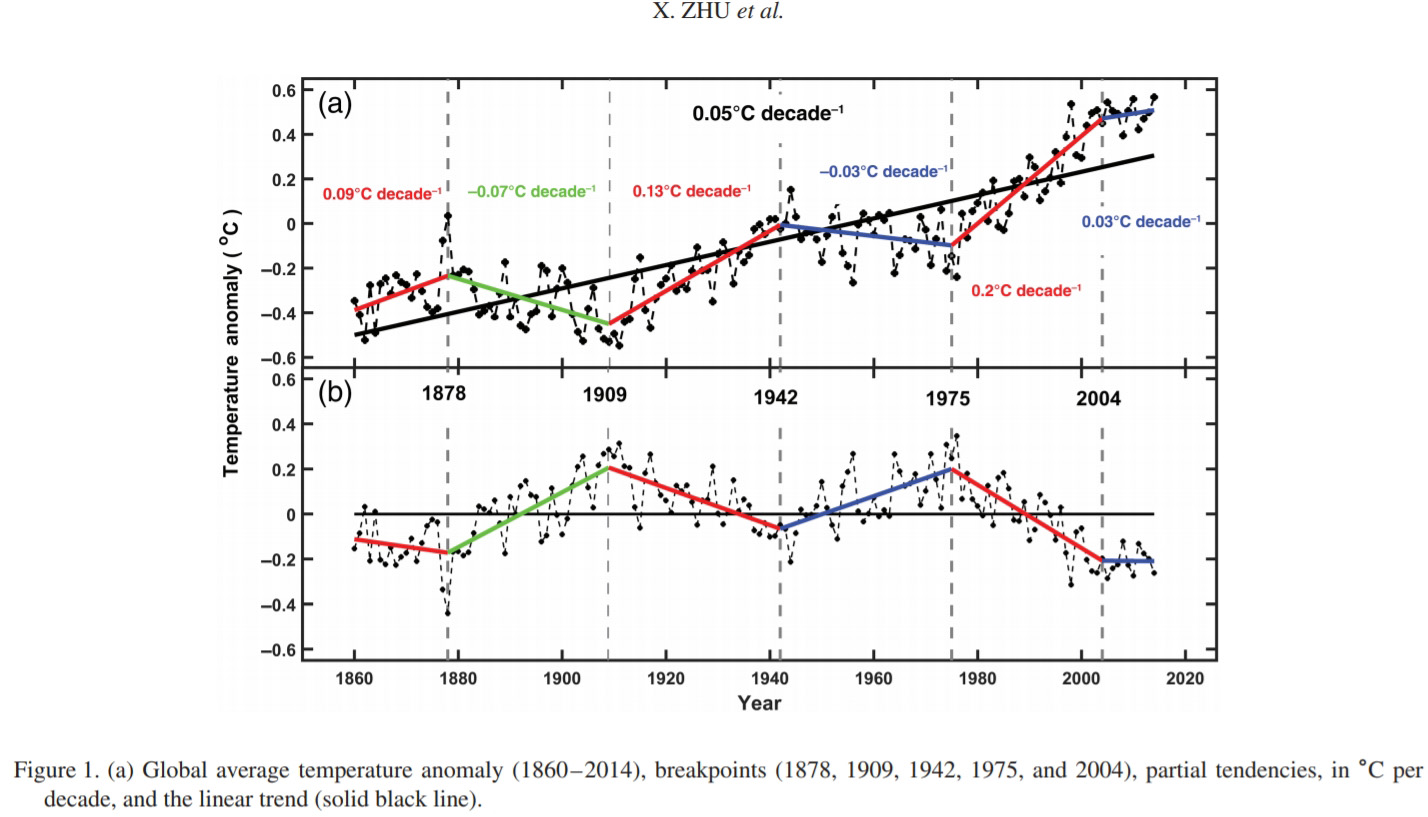
Image Source: Zhu et al., 2017
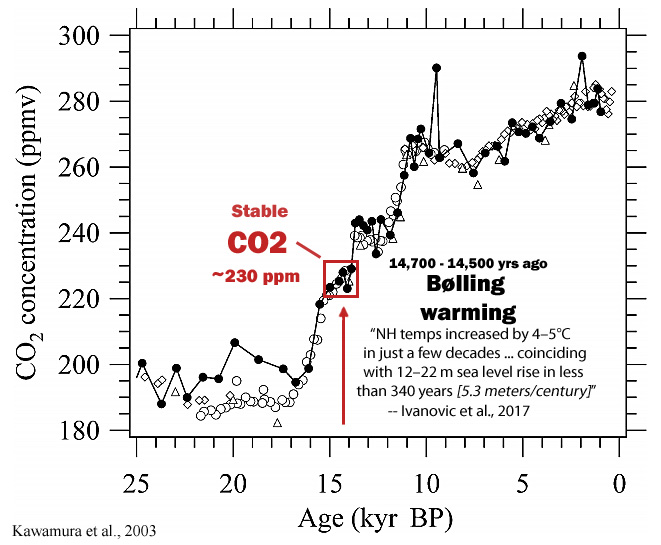
In contrast to the last 150 years of modest climate change, there was an instance 14,500 years ago in which “Northern Hemisphere temperatures increased by 4–5°C in just a few decades” and a concomitant “12–22 m sea level rise in less than 340 years” (Ivanovic et al., 2017), which is a warming of multiple degrees per decade and a sea level rise amounting to 3.5 to 6.5 meters per century. This well-documented climate event occurred without CO2 levels fluctuating, indicating that CO2 was not causally involved in this explosive warming or sea level rise.
The 8.2 ka Abrupt Cooling/Warming Event
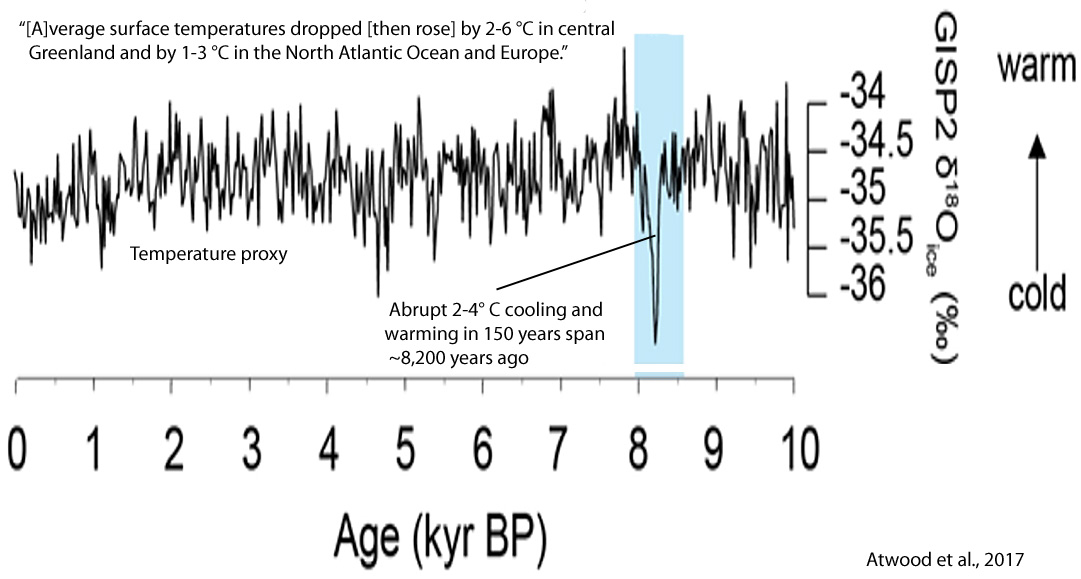
About 8,200 years ago, there was an abrupt, multiple-degree C cooling and warming episode (the “8.2 ka event”) that was global in scope, and lasted a total of about 150 years, with the amplitude of the cooling and warming phases lasting only decades. The event was “associated with a total eustatic sea level rise of 0.8–2.2 m [Li et al., 2012; Törnqvist and Hijma, 2012]” (Ahn et al., 2013), indicating that there was far more pronounced climatic changes and sea level rise rates — ~1 meter per century — during this period than the mere 0.05°C per decade change and <0.2 meter of sea level rise that has occurred in the last 150 years.
Kobashi et al., 2007 “A large number of paleoclimatic records over a hemispheric area show a large and abrupt climate change around 8200 years BP. However, the duration and general character of the event have been ambiguous. Here, we provide a precise characterization and timing of the event using methane and nitrogen isotopes in trapped air in an ice core. Climate change in Greenland and at a hemispheric scale was simultaneous (within ~4 years) as supported by climate model results (LeGrande et al., 2006). The event started around ~8175 years BP, and it took less than 20 years to reach the coldest period, with a magnitude of cooling of ~3.3°C [per decade] in central Greenland. After 60 years of maximum cold, climate gradually recovered for 70 years to a similar state as before the event [+3.3°C within 70 years]. The total duration of the event was roughly 150 years. … The fall in temperatures that accompanied the 8.2 ka event also corresponded with abrupt migrations of human populations and abandonment of sites ranging from Spain to Greece and in the Middle East (Gonzalez-Samperiz et al., 2009) …. Ice cores from Greenland (Alley et al., 1997) and Africa (Thompson et al., 2002) suggest that the 8.2 ka event was global in extent.”
During this period, atmospheric CO2 concentrations effectively stayed the same, with “a small, about 1–2 ppm, increase of atmospheric CO2 during the 8.2 ka event” (Ahn et al., 2013), once again supporting a lack of causal connection between large-scale global warming and cooling and CO2 concentration changes.
Atwood et al., 2017 “The relatively stable climate of the Holocene epoch (11,700 yr BP-present) was punctuated by a period of large and abrupt climate change ca. 8,200 yr BP, when an outburst of glacial meltwater into the Labrador Sea drove large and abrupt climate changes across the globe. Polar ice and marine records indicate that annual average surface temperatures dropped by 2-6 °C in central Greenland and by 1-3 °C in the North Atlantic Ocean and Europe [within decades]. The associated climate perturbations are generally thought to have persisted for 100-150 years [before temperatures returned to the previous baseline]. … These events stretch our understanding of the dynamical principles that govern the climate system, given the lack of these events in the modern record and the inability of climate models to reproduce such variability.”
Griffiths and Robinson, 2018 “The 8.2 ka BP (8200 cal. BP) event is regarded as the largest abrupt climate change event of the Holocene period (Alley et al., 1997; Alley and Agústsd ottir, 2005 ). It was first identified in the Greenland ice cores (Alley et al., 1997; Rasmussen et al., 2006; Thomas et al., 2007), but has subsequently been reported in multiple proxies across Europe (Magny et al., 2003; Seppa et al., 2007; Prasad et al., 2009; Zillen and Snowball, 2009; Daley et al., 2011; Giesecke et al., 2011), and throughout the Northern (Morrill and Jacobsen, 2005; Shuman, 2012; Liu et al., 2013; Dixit et al., 2014) and Southern Hemispheres (Morrill and Jacobsen, 2005; Cheng et al., 2009; Bustamante et al., 2016). In the Northern Hemisphere the event has been cited as precipitating a cold period, with a drop in temperature for example of 6 ± 2°C at Summit, Greenland (Alley et al., 1997) and of c. 1.6°C at Hawes Water, northwest England (Lang et al., 2010) that, according to counts of Greenland ice core layers, lasted a total of just over 160 years (Thomas et al., 2007). The event was reportedly caused by a glacier meltwater outburst from Laurentide lakes Agassiz and Ojibway around 8470 cal BP, which reduced deep water formation and caused an abrupt slowdown of the Atlantic meridional overturning circulation (Barber et al., 1999). This hypothesis has been supported by work showing two sea-level jumps between 8.5 and 8.25 ka BP (Tornqvist and Hijma, 2012).”
The 4.2 ka Abrupt Cooling/Warming Event
About 4,200 years ago, another abrupt global-scale cooling event occurred that was associated with severe Northern Hemisphere-wide drying period that lasted for centuries. The accompanying megadroughts and famines wiped out human civilizations that had existed in the same locations for centuries to millennia. After about 300 years of enduring cold and drought-stricken climates, “unified Neolithic farming culture completely collapsed” (Fenggui et al., 2010 ).
Like the 8.2 ka event, the 4.2 ka event featured a sudden, decadal-scale drop in surface ocean temperatures of 1-2°C (Guo et al., 2018). Also like the 8.2 ka event, the 4.2 ka event was not accompanied by changes in CO2 concentrations, again emphasizing the lack of a strong linkage between CO2 fluctuations and large-scale climate changes in the paleoclimate record.
Guo et al., 2018 “The mid-Holocene environmental transition was characterised by global cooling and the abrupt weakening of the Northern Hemisphere monsoon systems. It is generally considered the key driver of the collapse of several mid-Holocene agricultural societies, on a global scale. … The mid-Holocene environmental transition has attracted much attention from climate scientists and archaeologists, especially Holocene event 3 (HE3, ~4.2 ka) [4,2000 years ago],as termed by Bond et al. (1997), because it marks the termination of the Holocene climatic optimum (Perry and Hsu, 2000) and the initiation of the Neoglacial (Solomina et al., 2015). Existing records reveal that ocean surface temperatures decreased by ~1-2°C during HE3 [4.200 years ago] (Bond et al., 1997; deMenocal et al., 2000b), which persisted for ~300-600 years (Cullen et al., 2000; Perry and Hsu, 2000); while a total duration of up to ~1500 years was recorded in the North Atlantic (Bond et al., 1997, 2001). In addition, HE3 was punctuated by a series of geologically-rapid global cooling and/or dry events (Morrill et al., 2003; Marchant and Hooghiemstra, 2004; Booth et al., 2005; Shanahan et al., 2015) which were superimposed on the gradual drying trend of the mid-Holocene (Morrill et al., 2003; Mayewski et al., 2004; Wanner et al., 2008, 2011; Roberts et al., 2011). Associated with HE3 were the collapse of cultures in Pakistan (Staubwasser et al., 2003; Madella and Fuller, 2006; Macdonald, 2011; Giosan et al., 2012; Ponton et al., 2012; Leipe et al., 2014; Menzel et al., 2014; Prasad et al., 2014a), Mesopotamia (Weiss et al., 1993; Cullen et al., 2000; deMenocal, 2001), China (Jin and Liu, 2002; Wu and Liu, 2004; An et al., 2005; Innes et al., 2014; Zeng et al., 2016; Zhu et al., 2017) and Egypt (Thompson et al., 2002; Marshall et al., 2011; Phillipps et al., 2012). In high latitudes of the Northern Hemisphere, a peak in detrital carbonate flux on the East Greenland Shelf at 4.7 ka signaled both the beginning of the Neoglacial and a southward expansion of the Arctic sea ice (Jennings et al., 2002). In Europe, a 4.2 ka drought event is recorded by multi-proxy data from a cave flowstone in Italy (Drysdale et al., 2006); diatom assemblages from Montcortes Lake in the Iberian Peninsula indicate that lake levels were lower during a pronounced dry interval from 2360 to 1850 BCE (Scussolini et al., 2011); a decrease in deciduous Quercus and Pinus pinea-type percentages in Southwest Iberia at ~4.2 ka suggests an abrupt shift to dry conditions (Lillios et al., 2016); and a synthesis of records from the Mediterranean reveals an unusually dry interval from 4.5 to 3.9 ka (Mercuri et al., 2011; Roberts et al., 2011). Evidence from eastern tropical Africa indicates a shift to drier conditions at ~4.0 ka (Marchant and Hooghiemstra, 2004), although at this time wetter conditions were maintained in West Africa (Russell et al., 2003) and in parts of South America (Marchant and Hooghiemstra, 2004); and magnetic and geochemical data from the Holocene sediments of Lake Tana in northwest Ethiopia confirm that the driest interval occurred at ~4.2 ka (Marshall et al., 2011), which is also identified in the Mount Kilimanjaro ice core (Thompson et al., 2002) and in the Mauritian lowlands (de Boer et al., 2014). In eastern Russia, evidence of a cold spell between 4.5 ka and 3.5 ka is provided by a multi-proxy record from Two-Yurts Lake (Hoff et al., 2015). A severe centennial-scale megadrought in mid-continental North America occurred between 4.1 and 4.3 ka (Booth et al., 2005).”
Xiao et al., 2018 “Researches on the 4.2 ka event and its impact on cultural evolution in China have been encouraged by Hsü’s view (1998) that famines and mass migrations have occurred in the past. In ancient China, these could have resulted from regional droughts related to global cooling. Wu and Liu (2004) synthesized data from paleoclimatic records in eastern China and suggested that the climatic anomaly that occurred ~4.2 ka ago produced a drought in the northand flooding in the south, which was responsible for the collapse of neolithic cultures in the central plain of China during the late third millennium BC. … Fang and Sun (1998) first attributed the interruption of the Laohushan Culture to climatic cooling based on the impacts of ≥10°C cumulative temperature decreases on frost-free period in the lake region and of a temperature drop to agricultural production in areas along the Great Wall during the historical period. This interpretation has been followed by Tian (2000) and Tian and Guo (2004). As stated above, our multi-proxy data imply a decrease in regional precipitation rather than temperature.”
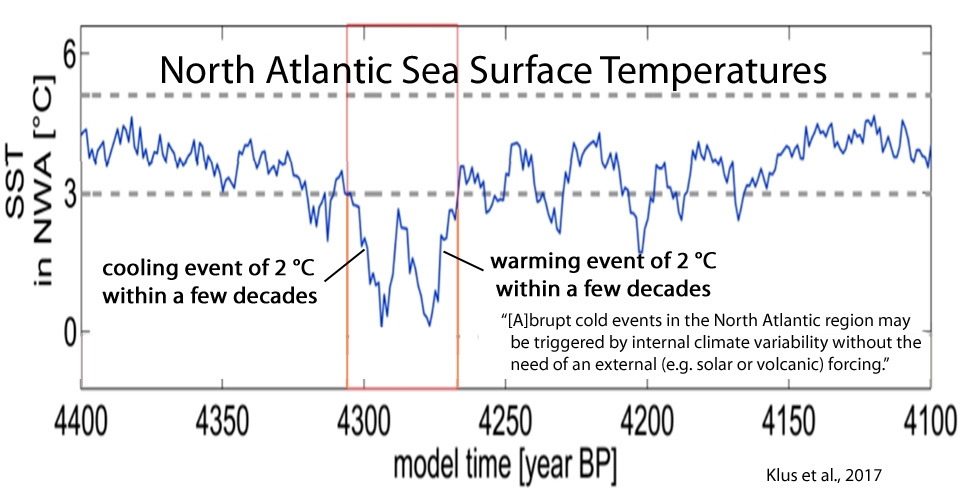
Klus et al., 2017 “Abrupt cold events have been detected in numerous North Atlantic climate records from the Holocene. … Here, we describe two cold events that occurred during an orbitally forced transient Holocene simulation using the Community Climate System Model version 3. Both events occurred during the late Holocene (event 1 referring to 4305-4267 BP [38 years] and event 2 referring to 3046-3018 BP [28 years]) and were characterized by substantial surface cooling (-2.7 and -2.2 °C, respectively [-0.71 °C/per decade and -0.78 °C/decade]) … … Northeast of Iceland, however, shows an increase in both SST and SSS, but a decline in sea ice concentration (event 1: warming of 1.6 °C [+0.42 °C/decade], rise of 0.7 PSU, decline of -5 % in sea ice concentration; event 2: warming of 1.9 °C [+0.68 °C/decade], rise of 0.9 PSU, decline of -11 % in sea ice concentration). … The events were triggered by prolonged phases of a positive North Atlantic Oscillation which, through changes in surface winds, caused substantial changes in the sub-polar ocean circulation and associated freshwater transports, resulting in a weakening of the sub-polar gyre. Our results suggest a possible mechanism by which abrupt cold events in the North Atlantic region may be triggered by internal climate variability without the need of an external (e.g. solar or volcanic) forcing.”
1-3°C Decadal-Scale Holocene Surface Cooling/Warming In the North Atlantic
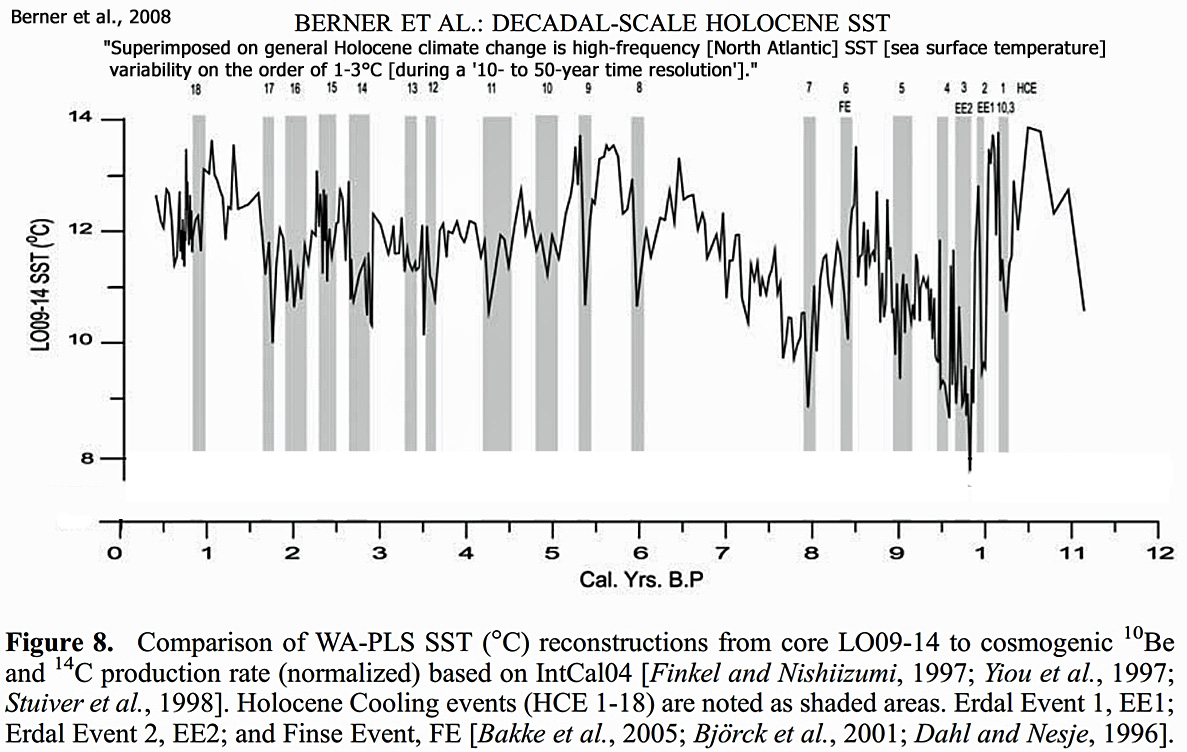
In the subpolar North Atlantic, Holocene sea surface temperatures routinely rose and fell by 1°C to 3°C within a span of decades.
Berner et al., 2008 “Superimposed on general Holocene climate change is high-frequency [North Atlantic] SST [sea surface temperature] variability on the order of 1-3°C [during a ’10- to 50-year time resolution’].”
Modern Ocean Heat Content Changes So Minimal They Are “Below Detection”, While Holocene Ocean Temperature Changes Reached “>2 °C Within 200 Years”
According to Levitus et al. (2012), the global ocean heat content (0-2000 m layer) rose by a total of just 0.09°C during the 55 years between 1955 and 2010. During the Holocene, temperatures in the 0-1000 m layer rose and/or fell by more than 2°C within 200 years, or 1°C per century.
Bova et al., 2016 “Rapid variations in deep ocean temperature detected in the Holocene … The observational record of deep-ocean variability is short, which makes it difficult to attribute the recent rise in deep ocean temperatures to anthropogenic forcing. Here, we test a new proxy – the oxygen isotopic signature of individual benthic foraminifera – to detect rapid (i.e. monthly to decadal) variations in deep ocean temperature and salinity in the sedimentary record. We apply this technique at 1000 m water depth in the Eastern Equatorial Pacific during seven 200-year Holocene intervals. Variability in foraminifer δ18O [water temperature proxy] over the past 200 years is below the detection limit [a change or variability in ocean heat cannot be detected in the past 200 years], but δ18O signatures from two mid-Holocene intervals indicate [natural, unforced] temperature swings >2 °C within 200 years.”
Between 80,000 and 20,000 Years Ago, Temperatures Rose By 10°C And More Within Decades Dozens Of Times
Referred to as Dansgaard-Oeschger (DO) events occurring during the last glacial (~80,000 to 20,000 years ago), global temperatures would rise by multiple degrees within decades about every 1,500 years, each time nearly reaching the modern interglacial’s warmth before gradually cooling back down over the course of centuries. The amplitude of these explosive warming events reached 10 to 15°C in Greenland. As usual, CO2 concentrations did not change during these abrupt warming/cooling episodes, as they remained flat and dangerously low at 180 to 190 ppm throughout the last glacial. Scientists have concluded that “DO events are part of the natural variability and not externally triggered” (Shao and Ditlevsen, 2016).
Sánchez et al., 2017 “The estimated increases in Greenland atmospheric temperature were 5–16°C [Capron et al., 2010] and the duration of the warming events between 10 to 200 years [Steffensen et al., 2008].”

Lohmann and Ditlevsen, 2018 “During the last glacial period, lasting from approximately 120 to 12 kya BP (thousands of years before present), a large number of abrupt large-scale climate changes have been recorded in Greenland ice cores and other Northern Hemisphere climate proxies. These so-called Dansgaard–Oeschger (DO) events (Dansgaard et al., 1993) are characterized by an abrupt warming of 10–15 K from cold conditions (stadials) to warmer conditions (interstadials) within a few decades. This is typically followed by gradual cooling, lasting centuries to thousands of years, until a more abrupt jump back to cold conditions is observed. … In conclusion, we show that the long-term variations in DO warming event frequency, often described as millennial climate activity, are consistent with a memory-less stationary random process. From the data at hand we cannot exclude the possibility that the long-term variations occurred by chance. If we however divide a DO cycle into two independent processes governing warming and cooling, this is not true anymore and significant time-varying structure is detected. We thus propose a model that incorporates long-term variations through forcing of the parameters with external climate factors. We find good agreement with the data in a model where the mean duration of interstadial phases of the DO cycle is controlled by global ice volume and the stadial phases by boreal summer insolation.”
Jensen et al., 2017 “The Dansgaard-Oeschger (DO) events of the last glacial are some of the most prominent climate variations known from the past. Ice cores from Greenland show multiple temperature excursions during the last glacial period as the climate over Greenland alternated between cold stadial (Greenland Stadial, GS), and warmer interstadial (Greenland Interstadial, GI) conditions with a period of roughly 1500 years (Grootes and Stuiver, 1997). Each DO-event is characterised by an initial temperature rise of 10±5 °C toward GI [Greenland Interstadial] conditions in a few decades, a more gradual cooling over the following several hundreds of years, and a relatively rapid temperature drop back to GS at the end of most of the events (Johnsen et al., 1992; Dansgaard et al., 1993; North-Greenland-Ice-Core-project members, 2004; Kindler et al., 2014).DO-events are manifested not only in Greenland, but around the world.”
Hewitt et al., 2016 “Many northern hemisphere climate records, particularly those from around the North Atlantic, show a series of rapid climate changes that recurred on centennial to millennial timescales throughout most of the last glacial period. These Dansgaard-Oeschger (D-O) sequences are observed most prominently in Greenland ice cores, although they havea global signature, including an out of phase Antarctic signal. They consist of warming jumps of order 10°C, occurring in typically 40 years, followed generally by a slow cooling (Greenland Interstadial, GI) lasting between a few centuries and a few millennia, and then a final rapid temperature drop into a cold Greenland Stadial (GS) that lasts for a similar period. … [S]teady changes in ice-sheet runoff, driven by the AMOC, lead to a naturally arising oscillator, in which the rapid warmings come about because the Arctic Ocean is starved of freshwater. The changing size of the ice sheets would have affected the magnitude and extent of runoff, and we suggest that this could provide a simple explanation for the absence of the events during interglacials and around the time of glacial maxima.”
Rasmussen et al., 2016 (press release) “Extreme climate changes in the past Ice core records show that Greenland went through 25 extreme and abrupt climate changes during the last ice age some 20,000 to 70,000 years ago. In less than 50 years the air temperatures over Greenland could increase by 10 to 15 °C. However the warm periods were short; within a few centuries the frigid temperatures of the ice age returned. That kind of climate change would have been catastrophic for us today. Ice core records from Antarctica also show climate changes in the same period, but they are more gradual, with less severe temperature swings.”
Jensen et al., 2016 “Proxy data suggests a large variability in the North Atlantic sea surface temperature (SST) and sea ice cover during the Dansgaard Oeschger (DO) events of the last glacial. However, the mechanisms behind these changes are still debated. … Based on our analysis, we suggest that the variability of the subpolar gyre during the analyzed DO event can be explained by internal variability of the climate system alone. Further research is needed to explain whether the lacking amplitude in the Nordic Seas is due to the model deficiencies or if external forcing or some feedback mechanisms could give rise to larger SST variability.”
Agosta and Compagnucci, 2016 “The climate in the North Atlantic Ocean during the Marine Isotope Stage 3 (MIS 3) —roughly between 80,000 years before present (B.P.) and 20,000 years B.P., within the last glacial period—is characterized by great instability, with opposing climate transitions including at least six colder Heinrich (H) events and fourteen warmer Dansgaard–Oeschger (D-O) events. … During the D-O events, the high-latitude warming occurred abruptly (probably in decades to centuries), reaching temperatures close to interglacial conditions. Even though H and D-O events seemed to have been initiated in the North Atlantic Ocean, they had a global footprint. Global climate anomalies were consistent with a slowdown of AMOC and reduced ocean heat transport into the northern high latitudes.”
Olsen, 2016 “The most frequent abrupt stadial/interstadial changes retained from the marine sediments are known as Dansgaard-Oeschger (D-O) cycles, and appear every 1-2 kyr. These cycles are characterized by abrupt short-lived increase in temperatures (10 ± 5°C) followed by gradual cooling preceding the next rapid event. A second millennial scale feature detected in the sediments record is cooling events culminating significant iceberg discharges analogous to Heinrich events. Mechanisms triggering abrupt changes display uncertainties, but leading hypothesis is attributed to modifications in the Atlantic Meridional Overturning Circulation (AMOC) and deep-water formation initiated by freshwater input.”
Mayewski, 2016 “The demonstration using Greenland ice cores that abrupt shifts in climate, Dansgaard-Oeschger (D-O) events, existed during the last glacial period has had a transformational impact on our understanding of climate change in the naturally forced world. The demonstration that D-O events are globally distributed and that they operated during previous glacial periods has led to extensive research into the relative hemispheric timing and causes of these events. The emergence of civilization during our current interglacial, the Holocene, has been attributed to the “relative climate quiescence” of this period relative to the massive, abrupt shifts in climate that characterized glacial periods in the form of D-O events.”
Bogotá-A et al., 2016 “We reconstructed upper forest line (UFL) positions between ~2000 and ~3400 m elevation and the most abrupt temperature shifts ranged up to 10 °C/100 yr at Terminations II and III. Regional vegetation change is mainly driven by eccentricity (100 kyr) and obliquity (41 kyr) cycles, while changes in local aquatic vegetation show variability in the obliquity and precession (21 kyr) bands. Millennial-scale climate variability reflecting Dansgaard–Oeschger (DO) climate cycles in the upper part of the record, continues in this penultimate intergalcial–glacial cycle strongly suggesting that this variability has a persistent character in Pleistocene vegetation and climate dynamics.”
Shao and Ditlevsen, 2016 “The glacial climate is dominated by the strong multi-millennial Dansgaard–Oeschger (DO) events influencing the long-time correlation. However, by separately analysing the last glacial maximum lacking DO events, here we find the same scaling for that period as for the full glacial period. The unbroken scaling thus indicates that the DO events are part of the natural variability and not externally triggered.”
Lynch-Stieglitz, 2017 “Abrupt changes in climate have occurred in many locations around the globe over the last glacial cycle, with pronounced temperature swings on timescales of decades or less in the North Atlantic. The global pattern of these changes suggests that they reflect variability in the Atlantic meridional overturning circulation (AMOC). … In many locations in the Northern Hemisphere, abrupt changes in climate have occurred that span almost the full range of glacial to interglacial conditions, with the transition between climate states occurring in decades or less (Alley & Clark 1999, Voelker 2002). These abrupt climate changes are most clearly recorded in the climate records from glacial ice on Greenland (Andersen et al. 2004) and are referred to as DansgaardOeschger (D-O) events. The warm intervals are referred to as interstadials, and the cold intervals are referred to as stadials. … [T]he prevailing paradigm is that the abrupt climate changes are a result of changes in the northward transport of heat by the Atlantic meridional overturning circulation (AMOC) (Broecker et al. 1985, Clark et al. 2002, Rahmstorf 2002).”
Climate Modeling Rooted In CO2-Driven Temperature Change Cannot Reproduce This Variability
In writing about the abrupt, global-scale climate changes during the 8.2 ka event that do not follow modeled expectations of an anthropogenically-driven modern climate, (Atwood et al., 2017) wrote:
“These events stretch our understanding of the dynamical principles that govern the climate system, given the lack of these events in the modern record and the inability of climate models to reproduce such variability.”
Indeed, considering how profound past climate changes have been in the absence of CO2 fluctuations relative to the modest (0.05°C per decade) temperature changes of the last 150 years with pronounced CO2 rise, there does not appear to be a non-political justification for focusing our attention on CO2 as a driver of climate change.
Another abrupt global cooling event in line with the 8.2 ka or 4.2 ka may be in store for us in the coming decades. And if it does happen, we will be powerless to stop it.


I am glad to know that we can measure global temperatures 8,200 years ago with a better accuracy than in 2017.
about 8000 years ago the number of sunspots decreased strongly. it may well be the (or one of the) cause(s) for the swift cooling.
I here there were unicorns farting that caused this.
Please cite your source for this claim.
What? you don’t know about the 30000 unicorns that went extinct due to the result of their actions back then? Also blinded by sunspots of course …
P.S.: writing English on a German smartphone/iPad sometimes autocorrects the wrong way. Sorry for that, but I doubt it is the reason for the level of misunderstanding that you bring to the table whenever you see me writing something you don’t agree with.
No, hadn’t read anything about this on RealClimate or SkepticalScience either. We’re still waiting for you to cite a source for your claims about unicorns causing abrupt climate changes like the one that occurred during the 8.2 ka event.
There is plenty of scientific support for the explanation that changes in solar activity/sunspots had a significant connection to the 8.2 ka event, just as wim van hoorn wrote. I have yet to see support for your unicorn claims. Please provide a scientific source citing this evidence.
Cheng et al., 2009
https://www.geo.umass.edu/climate/papers2/Cheng_Geology2009.pdf
“Changes in solar activity could be one of the primary forcing causes of the 8.2 kyr B.P. event of the IM and AM (Neff et al., 2001; Wang et al., 2005).”
—
Allan et al., 2018
https://orbi.uliege.be/bitstream/2268/224568/1/M.ALLAN_JQSR_2018.pdf
“Results were compared to reconstructed sunspot number data to determine whether solar signal is presents in PN speleothem. The occurrence of significant solar periodicities (i.e., cycles of Gleissberg, de Vries, unnamed 500 years, Eddy and Hallstatt) supports for an impact of solar forcing on PN speleothem trace element contents. Moreover, several intervals of significant rapid winter change were detected during the Holocene at 10.3, 9.3-9.5, around 8.2, 6.4-6.2, 4.7-4.5, and around 2.7 ka BP. Those intervals are similar to the cold winter events evidenced in different natural paleoclimate archives, suggesting common climate forcing mechanisms related to changes in solar irradiance.”
—
Jime´nez-Moreno et al., 2018
http://www2.nau.edu/ScottAnderson/docs/106.pdf
“[C]entennial-scale cold events may correlate with periods of lower solar activity. A solar-climate connection is suggested from these records by a prominent ca 200-yr cycle in tree pollen abundance, which may correlate with the 208 yr Suess solar cycle. This study shows an immediate response of the vegetation (treeline) to climate change at millennial- and centennial-scales, probably related to variations in summer insolation and solar activity during the late Pleistocene and Holocene. The Holocene climatic fluctuations observed in our pollen and MS records may reflect a manifestation of climatic cycles related to variations in solar activity on centennial-timescales as shown by the correlation with residual 14C record and a prominent 208 yr cycle in vegetation and MS throughout the Holocene. The main vegetation changes appear to be synchronous with transitions in marine records from the North Atlantic and other regions of the world. The high resolution of this vegetation record also allows the recognition of several early Holocene cold events that probably correspond to the Preboreal Oscillation, the 9.95 ka climate anomaly, and the 9.3 and 8.2 ka climate events, in addition to the middle and late Holocene climate changes recognized by Armour et al. (2002).”
Really, and here I thought that it had something to do with the ice shield finally collapsing. The huge fresh water influx stopped the usual ocean water circulation for a while.
Imagine if such an ice sheet collapse would occure in modern times. Would definetly cause some cooling and a lot of sea level rise.
You are not the only one waiting for actual scientific evidence supporting mythical unicorn theories …
What was the mechanism that led to the ice sheet collapse? Or was the ice sheet collapse itself the first cause?
What would be the mechanism if an ice sheet collapsed? CO2 forcing? You do recall that the CO2 greenhouse warming effect is minimal to “weak” at the poles according to scientists, right?
https://notrickszone.com/wp-content/uploads/2018/04/Smithusen-2015-CO2-Forcing-Weak-At-Poles.jpg
–
https://notrickszone.com/wp-content/uploads/2018/04/Smithusen-2015-CO2-Forcing-Weak-At-The-Poles-Greenland.jpg
–
https://notrickszone.com/2018/04/16/in-2015-climate-scientists-wrecked-their-own-co2-forced-polar-amplification-narrative/
Schmithüsen and colleagues reached the conclusion that CO2-forcing is “rather small” and even “weak“ at the poles. They found the planet’s tiniest warming signal from CO2 occurs for central Antarctica; they characterized the CO2-forcing for the Arctic region as “comparatively weak”. For example, quadrupling CO2 concentrations over the Antarctic Plateau is poised to yield a net radiative forcing value of just 1 W m-2. … The authors even assert that increasing CO2 concentrations causes atmospheric cooling in some areas above the Antarctic continent. They characterize this as a “negative greenhouse effect” due to the “increased long-wave energy loss to space, which cools the Earth-atmosphere system”.
I have yet to see support for your unicorn claims.
Who besides you is referencing unicorns and their connection to climate science? I know of no one else. Why do you keep on bringing them up?
“You are not the only one waiting for actual scientific evidence supporting ………”
Yep, we are ALL waiting for actual scientific evidence that CO2 causes warming or affects climate I any way whatsoever..
Seems to be extremely SPARSE, doesn’t it seb. 😉
Basically NON-EXISTENT.
Seems that there is about as much evidence for CO2 affecting climate as there is for unicorn farts affecting climate..
Wouldn’t you agree, seb.
Or I suppose you could actually post some evidence for CO2 warming.
Nah… that’s not going to happen is it, seb.
Are you still hunting ?
Or have you given up ?
Surely a very grand solar cycle, right? What do you think? Is an ice sheet collapse ever the first cause?
You do recall that it isn’t CO2 radiating down on ice that is causing the twice as fast (than global average) warming rate in the Arctic? You can’t be honestly thinking that if CO2 warming would be a thing it would only get warmer where the effect is strongest? (see the pretty picture in that Smithusen paper). That is not what climate scientist are saying, not at all.
I understand that you are not referring to your wild skeptic theories that you keep presenting here as unicorns. I do.
I would assume there is a connection between solar activity and ice sheet collapse, yes. Do you find that connection ridiculous? It would appear so since when another commentator brought that up you began talking about unicorns (again).
You’re the only one who references unicorns when we’re discussing climate science. I don’t. Why do you write about them?
Yep, seb has given up trying to find ANY evidence of CO2 warming anything, anywhere anytime.
Obviously the poor little fella has come to the same conclusion as everyone else…
THERE IS NONE!!
Just blindly preach the mantra, seb.
Make vague, unsubstantiated, zero-science claims of your delusions of the power of CO2.
You KNOW its all you have left.
Even the slap-stick comedy of your headless chook evasion routine is wearing thin.
“that is causing the twice as fast (than global average) warming rate in the Arctic”
Yet another LIE or INTENTIONAL MISINFORMATION
Only warming in the Arctic this century has come from the El Nino effect.. almost gone now.
In fact, its REALLY cold up there at the moment , with Arctic sea ice and Greenland SMB making gains over the last dozen or so years. Run-off limited because it too cold.
Arctic region is no warmer now than it was in the 1940s.
One minute you DENY the AMO, the next you RELY on the upward temperature part of the cycle.. Very deceitful, seb. !!!
And of course there is NO EVIDENCE of any affect from CO2 in the Arctic..
..just like there is NO EVIDENCE anywhere else.
Ehm, the OP wrote “about 8000 years ago the number of sunspots decreased strongly. it may well be the (or one of the) cause(s) for the swift cooling.”
Do you think less solar activity collapses an ice sheet? Further, the OP didn’t provide any source for this claim. So mythical unicorn explanation …
It is incredible difficult to converse with people who don’t understand the basics. Somehow I get the feeling you think I am writing about actual unicorns. Do you not understand that this is a metaphor?
You guys give the same kind of reply when I point out that you are in conspiracy theory territory. That I would be the only one using that word and you guys don’t and therefore I would be the one talking about conspiracies … this is either a good troll attempt or you guys are really that slow 😉 Which is it?
@Spikey:
you sure got that CH4 part right … lots of it coming from your brain now.
I’ve read explanations that go both ways for the solar influence.
There is broad agreement that the Early Holocene was several degrees warmer than now because of the higher insolation, which was considered responsible for melting the ice sheets.
Also, the slowdown in the AMOC (and global cooling) is presumed to be caused by increases in TSI, as mentioned in a just-published paper (below). There is still ongoing questioning about how and to what extent the Sun exerts its impact on the global climate. The science isn’t “settled” here.
Miao et al., 2018
https://link.springer.com/article/10.1007/s00376-018-7229-0
“In this study, we investigate the influence of low-frequency solar forcing on the East Asian winter monsoon (EAWM) by analyzing a four-member ensemble of 600-year simulations performed with HadCM3 (Hadley Centre Coupled Model, version 3). We find that the EAWM [East Asian winter monsoon] is strengthened when total solar irradiance (TSI) increases on the multidecadal time scale. The model results indicate that positive TSI anomalies can result in the weakening of Atlantic meridional overturning circulation, causing negative sea surface temperature (SST) anomalies in the North Atlantic. Especially for the subtropical North Atlantic, the negative SST anomalies can excite an anomalous Rossby wave train that moves from the subtropical North Atlantic to the Greenland Sea and finally to Siberia. In this process, the positive sea-ice feedback over the Greenland Sea further enhances the Rossby wave. The wave train can reach the Siberian region, and strengthen the Siberian high. As a result, low-level East Asian winter circulation is strengthened and the surface air temperature in East Asia decreases. Overall, when solar forcing is stronger on the multidecadal time scale, the EAWM is typically stronger than normal. Finally, a similar linkage can be observed between the EAWM and solar forcing during the period 1850–1970.”
I don’t see how or in what context a unicorn is relevant here, no. In what way are sunspot activity changes and abrupt climate changes — well-documented in the scientific literature to be connected — related to unicorns, metaphor (for what?) or not? Are unicorns supposed to be a metaphor for abrupt climate changes, indicating that the scientific literature is wrong and abrupt climate changes like the 8.2 ka event never happened?
Was this supposed to be a joke? Was it supposed to be funny? Or were attempting to insult the original commentator? If so, in what way were you successful considering there is scientific evidence to suggest abrupt climate changes occur in tandem with solar activity changes…just as the original commentator wrote?
Only hot air from your posts seb.
Zero evidence to counter my post…
Still running away from two simple questions..
How much more PATHETIC can you get ???
You are already cowering near the bottom of your troll-hole.
Time will tell how much deeper you will dig in your EVASION of those two simple questions…
Q1.. In what way has the climate changed in the last 40 years, that can be scientifically attributable to human CO2 ?
Q2. Do you have ANY EMPIRICAL EVIDENCE at all that humans have changed the global climate in ANYWAY WHATSOEVER?
How do you explain ever higher temperature records despite the Sun having become weaker in the last cycle?
http://woodfortrees.org/plot/pmod/plot/pmod/compress:12
How do you explain that the first half of 2018 ranks 3rd amongst all first halfs of a year in the temperature record despite it being an La Nina year?
Wow. So slow it is …
I … I must apologize to you. Apparently you can even misunderstand a short sentence like this one “I here there were unicorns farting that caused this.”.
Yes, this was a joke. Sarcasm, something which you now demonstrated multiple times are unable to detect.
You are dead serious with this, right? I don’t think repeating what the OP actually wrote will help in this case … you just don’t understand the problem and somehow feel the need to defend a baseless comment, because it was me who replied to it. Got it 😉
Spikey, it’s not all about you. Your behaviour takes the meaning of anything you write away instantly. No need to counter whatever you come up with as long as you can’t behave yourself and present valid points that aren’t conspiracy theorist talking points.
Thanks for playing though. I enjoy the creativity of your insult ridden comments.
No seb.. its all about YOU.. that is what you want isn’t it ??
Still the headless chook routine I see, avoiding the basics.
Can’t counter FACTS with anything.
Can’t even show proof for CO2 warming.
You are NOTHING but a PATHETIC attention-seeking serial pest.
You have no substance.
Lets try again with those two questions see if you run away , yet again.
Q1.. In what way has the climate changed in the last 40 years, that can be scientifically attributable to human CO2 ?
Q2. Do you have ANY EMPIRICAL EVIDENCE at all that humans have changed the global climate in ANYWAY WHATSOEVER?
No seb, unicorn farts would be CH4 + trace aromatic hydrocarbons.
At least get your biology and chemistry somewhere near correct.
And CH4 breaks down to CO2 fairly quickly,
And CO2 has NO EFFECT on climate or temperature.
So, NO.. you are wrong again.
So if you write that you claim something like this, will you deny that you claimed something like this too? Why do you think this would happen in the coming decades?
Something true, but what’s up with that graph below this claim? A paper from 2017 should have had access to the latest Hadcrut4 data and should not stop in the year 2014, right?
There is a Github project with a collection of climate related timeseries. It has an R example to get change points for Hadcrut4 too: link (looks a bit different)
I sense a theme here. But hey, you aren’t claiming anything, right? Just shouting something in the room that may or may not be what is happening.
According to NOAA it rose from -0.013°C to +0.055°C in this timespan (makes 0.068°C instead of 0.09°C). Even less. But somehow it managed to rise by 0.034°C in just the 7 years after 2010. That half the rate you find noteworthy (1°C per century). Oh and looking at the 0-700 layer (a bit closer to 0-1000m) we have an increase by 0.058 degrees in the last 7 years (link) … which is a per century rate of 0.83°C.
Well, in a recent comment thread you told me you aren’t claiming that climate changes have nothing to do with CO2. Why does this paragraph nevertheless sound like you do? Profound climate changes happening without CO2 as a driver in the past, therefore no justification to look for CO2 as the reason for today’s climate change. Am I reading this wrong?
Oh and the modes temperature change … perhaps you should look at that Github graph i linked to above again. And maybe you’ll finally consider that we are just at the beginning of this road. Not much has changed yet, the imbalance will continue into the future and temperatures/heat content are going to increase further. Basically the same as with solar/wind … you keep looking backwards and lament about how little has been accomplished yet while you completely fail to see the trends going forward. I am guess you think that 2°C limit that everyone is talking about that we have to reach is completely out of reach in your world, right? We’ll never get there because of this “modest 0.05°C increase per decade”. Whatever helps you sleep 😉
What does this mean?
Why might cooling happen in the coming decades? Because warming and cooling undulations occur naturally with far greater magnitude and rapidity than what has occurred in the modern era. It happened during the Little Ice Age, when global temperatures plummeted by 1.0 to 1.5 C in tandem with lower solar activity and high volcanic activity (and likely higher cloud cover, but this is unknown, of course). We had global cooling as recently as the 1950s to 1970s, when Arctic sea ice expanded and global temperatures dropped by -0.3 C … before the was erased from the instrumental record.
Benton, 1970 “In the period from 1880 to 1940, the mean temperature of the earth increased about 0.6°C; from 1940 to 1970, it decreased by 0.3-0.4°C.”
Cimorelli and House, 1974 “[B]etween 1880 and 1940 a net warming of about 0.6°C occurred, and from 1940 to the present our globe experienced a net cooling of 0.3°C.”
https://notrickszone.com/wp-content/uploads/2016/09/Northern-Hemisphere-Cooling-0.6-C-1958-to-1963-Starr-Oort-1973.jpg
Um, I don’t exert control over what year scientists choose to start or stop their trends. HadCRUT4 goes back to 1850, and yet 1850-’59 isn’t included. Are you wringing your hands about that too?
My claim is that there does not appear to be a causal connection between CO2 concentration changes and large-scale temperature changes in the paleoclimate record as documented by the dozens of papers included in this article. Was that unclear?
You’ll need a longer record than a few decades to compare trends in a statistically accurate manner, but the 200-year trend outlined in Bova et al. (2016) indicates more than 1.0 C per century trends occurred naturally in the Holocene in the deeper 0-1000 m layer, indicating that even the short-term record from today still has not fallen outside the range of natural variability.
Because of the word choices. I don’t use phrasing like “nothing to do with” when it comes to causal relationships between variables. I haven’t ruled out that CO2 plays a role; I just don’t see the real-world observable measurements needed that show how much OHC values are changed by CO2 concentration changes. That’s still an assumption…but I haven’t dismissed the possibility.
SebastianH claims the article says there is “no justification to look for CO2 as the reason for today’s climate change.”
That’s not even close to the wording, which is far more nuanced and conditional and hedging. Here’s what I actually wrote. It would have been appreciated if you had used my actual wording rather than making up your own interpretation and attributing your wording to me. How many times must I ask that you stop doing this? Is it so hard to copy/paste the actual word choices and phrasing?
KR: “there does not appear to be a non-political justification for focusing our attention on CO2 as a driver of climate change.”
I’m glad you’re at least willing to admit that +130 ppm of CO2 concentration change has so far elicited “not much” change in climate. That was the point of the comparison between past climate changes and today’s. As for your predictions, I guess we’ll have to see. Since CO2 has delivered “not much” change in the past, I fail to see why you have such certainty that some day in the future this will transform from “not much” to “a whole lot”.
Oh, I see the trend going forward in solar and wind, but they aren’t enough to offset the rise in fossil fuel emissions. The US easily led the world (again) in CO2 emissions reductions, but it was offset 3 times over by increases in China.
https://wattsupwiththat.com/wp-content/uploads/2018/07/bpco2.png
Why the dramatic reduction in the US? It’s not because of solar and wind. It’s because of switching from one fossil fuel (coal) to another (gas).
Keeping under 2 C with wind and solar and fossil fuel emissions reductions?
“no justification to look for CO2 as the reason for today’s climate change.”
Seb could actually so us some scientific justification..
Maybe answer some simple questions as a start…
Q1.. In what way has the climate changed in the last 40 years, that can be scientifically attributable to human CO2 ?
Q2. Do you have ANY EMPIRICAL EVIDENCE at all that humans have changed the global climate in ANYWAY WHATSOEVER?
Without being able to answer these two questions, that should be straight-forward and easy to answer ..
There really is.. “no justification to look for CO2 as the reason for today’s climate non-change”
So come on seb..
.. we are all STILL WAITING !!
Reply deleted? Not appearing? … whatever :/
Yep , whatever you said, it would have been EMPTY, and totally free of any content or evidence…
You could always try again….
Q1.. In what way has the climate changed in the last 40 years, that can be scientifically attributable to human CO2 ?
Q2. Do you have ANY EMPIRICAL EVIDENCE at all that humans have changed the global climate in ANYWAY WHATSOEVER?
.. we are all STILL WAITING !!
Are you going to drag this out until we all freeze to death or die of boredom watching your headless chook routine ?
“which is a per century rate of 0.83°C.”
Roflmao.
And seb highlights his mathematical INEPTITUDE, yet again
So funny!
Seb.. Your posts are MEANINGLESS garbage..
“Well, in a recent comment thread you told me you aren’t claiming that climate changes have nothing to do with CO2.”
Do you have even the tiniest amount of real evidence that it does ???
So far, when asked for evidence of CO2 warming anything anywhere, you have been found to be TOTALLY LACKING.