By Pierre Gosselin
and Kirye
Today any warming found anywhere almost always gets blamed on heat supposedly getting trapped by rising atmospheric CO2 concentrations. Moreover, activist scientists insist we ignore all other powerful factors such as solar and oceanic cycles.
In fact these activists have become so extreme that they insist that record cold today is caused by warming.
But as people learned already in the first grade, the earth’s surface warms when the sun shines on it, and tends to cool when clouds obstruct the sun.
Solar radiation at the surface has risen over the past decades
In Japan, the Japanese Meteorology Agency (JMA) has 8 stations that measure solar radiation reaching the surface, and many other for recording temperature.
Data from the 8 stations recording solar radiation are plotted since 1999 (i.e. 20 years) as follows:
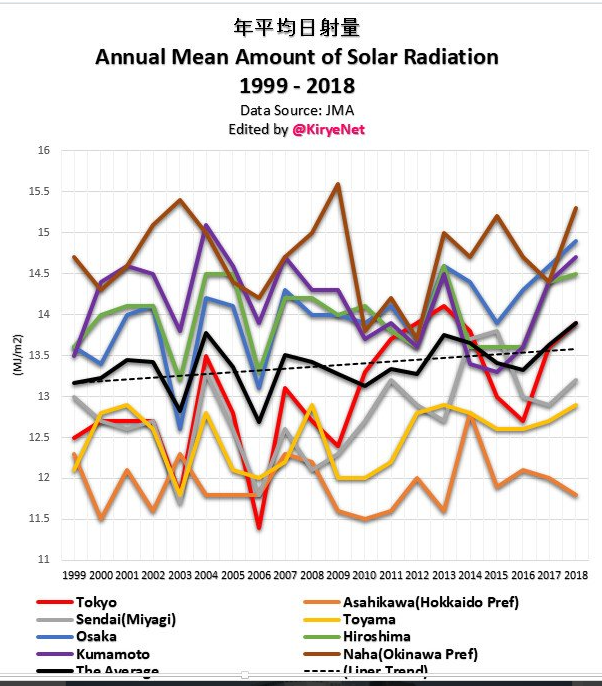
Data source: JMA
The black curve with the dashed linear trend line in the middle of the pack is the mean of all 8 stations. As we can see, these 8 stations have seen a clear upward trend since 1999.
Next follows the annual mean temperature chart for the same 8 stations:
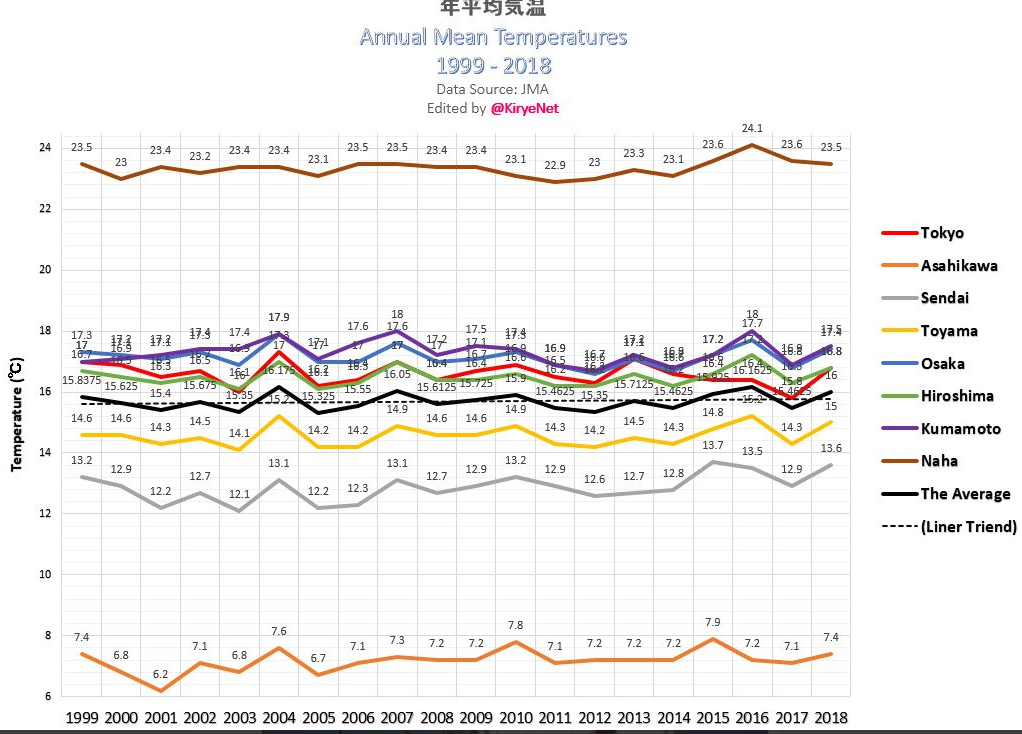
Data Source: JMA.
As the chart above shows, the annual mean temperature for the 8 stations has risen modestly over the past 20 years – in line with solar radiation.
The solar radiation data in fact go back to 1961, and we’ve plotted that data as follows, along with the mean annual temperature for the same 8 stations:
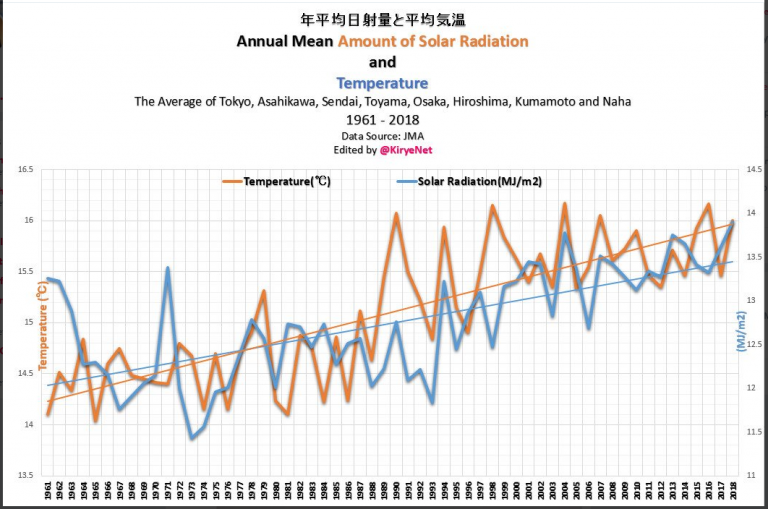
Approx. 10% rise
Since 1961, the linear trend for solar radiation has risen from about 12 MJ/m2 to about 13.4 MJ/m2, which is some 10%. Meanwhile the mean annual temperature has gone from about 14.2°C to 16°C for the 8 stations.
With all the extra solar energy, and in combination with urban development, it should not be a surprise that we’ve seen a warming.
CO2 hardly the driver
If we had seen the same temperature rise without an increase in solar radiation and urban development, and ignoring oceanic factors, then we might assume a possible “greenhouse” effect. But the charts make it clear that Japan’s warming had very little to do with CO2.
So why would solar radiation be increasing? Obviously less cloud cover, which have nothing to do with CO2, but rather with natural solar and oceanic cycles. And no, CO2 does not drive either one.
Oceans cycles dominate over other regions
In the far north, for example, the sun is much weaker and so probably has a lesser role. So other factors such as natural ocean cycles likely have major impacts on mean annual temperature trends and ice melt. Warm oceanic phases release more moisture into the atmosphere which in turn has profound a warming effect in polar regions, for example at polar outpost Spitzbergen.
Ole Humlum, Danish professor emeritus of physical geography at the University of Oslo, believes that the future forecasts in the recently presented IPCC climate report are “not well founded”, and presents a chart that shows that the AMO is clearly a huge driver:
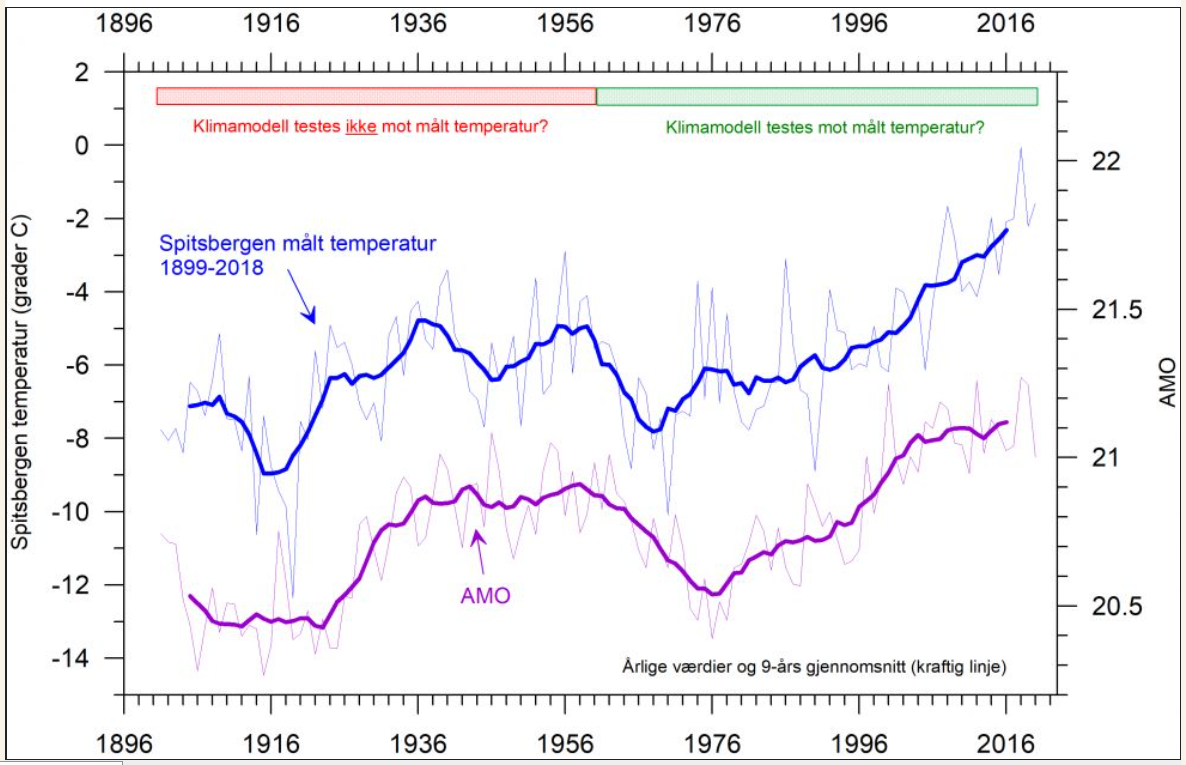
The graph shows temperature fluctuations back to the end of the 19th century. Chart: Skjermdump.
Obviously in most regions globally, other factors are very much behind the warming of the past 150 years, and not CO2.


[…] P. Gosselin, February 17, 2019 in […]
What about cleaner industry regionally and in or near the locations where the solar instrumentation is stationed? Thus, the readings are higher without saying the Sun is more intense.
I’m not aware of some of the sites indicated, nor where the instruments are.
I do know that the sky is cleaner in many American cities than it was years ago, say 1975 as a guess.
I don’t know about Japan, but American cities have been slowly but steadily getting cleaner on average.
http://www.usa.com/
Pick a state and select “air quality,” …e.g.,…
California.
http://www.usa.com/california-state-air-quality.htm
It may not be spectacular, but it’s slowly improving.
Another fine post from Kirye.
Yet again the signature of CO2 warming is missing.
There is one signal that is indeed clearly missing from this analysis – namely the signal from the sun itself. The changes in radiation detected at the earth’s surface are much larger than the changes in TSI detected by satellites. Moreover, the eleven year cycle is clearly missing. This is a strong indication that it is the earth’s atmosphere, rather than the sun itself, that is determining how much radiation gets through. Whether this is by reflection, refraction, scattering, absorption, re-emission or even the infamous “back radiation” is unclear. It is probably a mixture of several.
There is also a further problem. If the changes really do represent 10% of the total radiation reaching the earth’s surface, then, at equilibrium, this would indicate that we should see a change of around seven degrees centigrade! It would seem that the measurements of radiation only consider a narrow range of frequencies rather than the total radiation arriving at the earth’s surface. It is worth noting in this context that the outgoing long wave radiation is substantially larger than the measurements quoted here.
Scepticism cuts both ways!
@Skeptik
“The changes in radiation detected at the earth’s surface are much larger than the changes in TSI detected by satellites.”
That’s well known, as is the reason for the apparent discrepancy. See here, where Dr. Moerner presents Dr. Easterbrook’s work, in which there is an informative portion on TSI, and why it correlates so well with temperatures on earth.
https://youtu.be/G4wov0kc3yg
You really shouldn’t be so critical of others when you overlook important details yourself.
“Skeptik” has shown his propensity to believe that TSI variation is the only means by which the Sun can influence climate. We’ve explained this to him before, but he lacks the skepticism to do anything other than keep believing what he always has. His trenchant close-mindedness belies the name he has given himself.
@Skeptik,
“There is one signal that is indeed clearly missing from this analysis – namely the signal from the sun itself.”
And there for all to see is the error –>> “one signal”! Since when was the sun’s output defined as “one signal”?
Neither TSI nor SSN defines the solar effects. So please Skeptik, go and research all the effects (all the signals) the sun has on this planet. Then come back with better knowledge and perhaps some understanding.
Japan and Europe same trend in Sweden:
https://www.smhi.se/polopoly_fs/1.143988.1548428269!/image/allgack_1983-lastyear.jpg_gen/derivatives/Original_1256px/image/allgack_1983-lastyear.jpg
It could be solar brightening.
Less clouds form and number of solar hours rises.
Sulfur in the air has the opposite curve.
And less clouds also mean less backradiation from clouds. Don’t ignore this rather important part of the equation. A winter night becomes much much cooler when the sky is clear.
Where is Carbon Dioxide when it is needed?
LOLOL
The “little professor” reminds me of this timeless wisdom.
And the cloud cover took a drop recently and haven’t quite recovered —
https://isccp.giss.nasa.gov/zD2BASICS/B8glbp.anomdevs.jpg
Pretty sure kids also learn that clouds keep the surface warm in many cases, e.g. when the Sun doesn’t shine or in the cold season.
Well, obviously solar radiation and temperature aren’t correlated in a linear fashion. 14.2°C to 16°C is only a 0.63% change in temperature.
Also, a 1.4 MJ/m² difference in the daily solar radiation average would equal a difference of 16.2 W/m² in solar radiation in 58 years. You’d need to subtract the obvious lack of cloud backradiation from this amount to get the real forcing value of this change in cloud cover over Japan.
Nope, we might not “assume” anything from just correlating curves to each other. Without a physical mechanism that is sufficient for one to cause the other, correlations are meaningless. As a thought experiment, imagine there were two variables that increased linearly and you observe a matching linear increase in the temperature. How could you ever decide how much of the temperature increase can be attributed to one or the other variable? You can’t without knowledge about the physical mechanisms involved.
I’ll never get the human desire to try and correlate things in a way that more or less amounts to eyeballing it. While climate skeptics seem to generally use this argument against who they perceive as alarmists, they appear to do this all the time themselves. Kind of ironic.
[…] and ENSO prediction. The New Sunspot Data … and Satellite Sea Levels | Watts Up With That? Land Of The Warming Sun: Japan Has Seen Solar Radiation Rise 10% Over Past 60 Years! Scottish Sunspots. Essay: Solar cycle wave frequency linked to jet stream changes. Hunger Stones […]