We were told that the mild winters we experienced in Europe were due to global warming. Now, suddenly, we are getting hit with yet another nasty cold winter.
Why? Guest writer Juraj Vanovcan presents his observations and interesting evidence that it has nothing to do with CO2. He presents what I think is an astonishing finding near the end.
===============================================================
Predicting The European Climate From The CET Record – Lesson Learned
By guest writer Juraj Vanovcan
This post was inspired by the article Negative AO bringing cold winters back to Europe.
Recalling the summers and winters of the early 1980s, it becomes obvious to me that it is the prevalence of air circulation that determines if a season is warm or cold. The very mild winter of 2006/2007 in Central Europe was characterized by a sustained flow of warm Atlantic air over the European continent, while the cold and snowy 2005/2006 winter received a lot of Arctic air entering the mid-latitudes from the North.
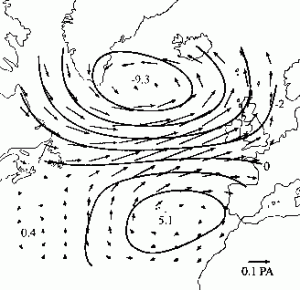
Air circulation is governed by pressure differences and basically this is what North Atlantic Oscillation is all about.
Fig 1 Example of positive NAO (Source: JISAO webpage).
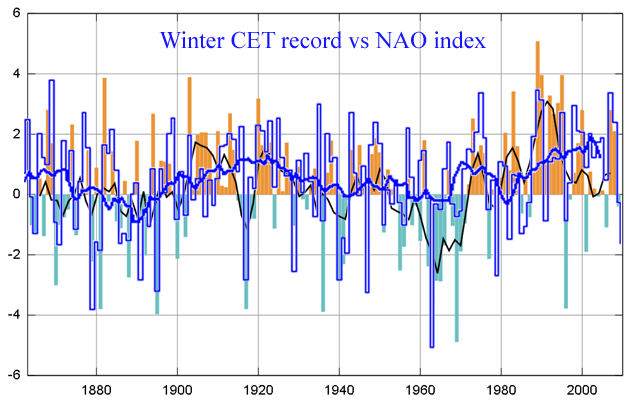
I compared the NAO index with the European long-term climate record. Checking the Central European Record (CET) shown, one sees there is an obvious correlation between NAO and winter temperatures. The dark blue line is CET, orange/light blue is NAO.
Fig 2 North Atlantic Oscillation index compared with CET winter record, 1860-2010 (CET graph source: http://climate4you.com/ ).
As observed above, the NAO oscillates in an 80-year long sine wave cycle. The first period with mild winters happened in the 1920s, which of course we do not remember. The second positive phase began in 70s and mild winters in Central Europe become frequent since late 80s. It also seems that the current period with prevalent NAO-positive years has ended; the recent string of cold winters in North-Western Europe suggests this as well.
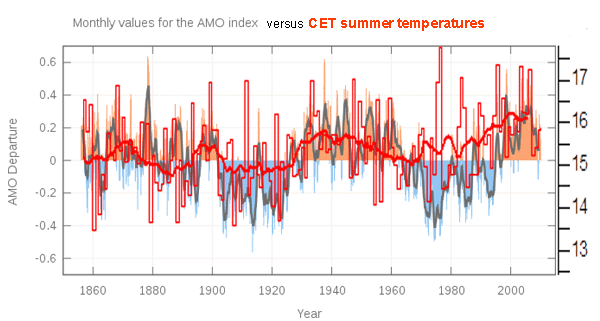
On the other hand, CET summers do not show correlation with NAO in the early part of 20th century. Comparing the CET summer anomalies with AMO index (detrended North Atlantic SST) however gives reasonable correlation again. Summers in the period 1930-1950 were often as warm as the recent ones, and the extremely hot and dry summer of 1946 in Central Europe with its catastrophic impact on crops has since never been repeated. However, warm summers in this period were combined with cold winters, like those of 1939/40/41.
 Fig 3 Atlantic Multidecadal oscillation index compared with CET summer record, 1860-2010
It is worth noting that while the NAO peaked circa 20 years before the warm AMO phase centered on 1940, their warm phases were much closer to each the other in the later part of the century. It means that while Europe experienced cold summers and mild winters in 1920s and warm summers and cold winters in the 1940s, the last 20 years saw both warm summers as mild winters. This is also probably the reason why 2000-2010 decade is slightly warmer than 1940-1950.
Based on the observed SST and OHC record for North Atlantic, it seems however that AMO had peaked around 2005 and it is now heading down. This time, both NAO and AMO being in their negative phases will mean miserable summers and cold winters. Such shift in temperature trend is already being observed in the whole northern extratropics record.
Fig 4 Northern hemisphere north of 30N, HadCRUT3 data
IPCC attributed the post-1975 warming phase almost solely to anthropogenic reasons, namely to increased “greenhouse effect” caused by increase of CO2 molecules from 3.5 to 4 per other 10,000 molecules in the atmosphere.
We can conclude, however, that at least for Europe, observed warming is fully explainable by natural variations, two of which – AMO and NAO – had their positive phases overlaid during the last 20 years. Neither CO2, aerosols nor greenhouse effect theory are needed.
For those still seeking the anthropogenic signature in recent warming, here is a comparison of 1890-1920 warming trend compared against 1980-2010 warming trend in the winter CET record. The running 10-year mean is strikingly similar, following even minor dips and upticks.
 Fig 5 CET winter record with late century warming superimposed on early century warming
Extrapolations into the future may be tricky, especially when pulling some 20-year trend into year 2100, which seems to be a favorite practice in modern climatology. Observing the European climate record of the early part of 20th century and understanding its causes gives us much more predictive skill when forecasting climate for the next decades. All climate indicators today point to cooling, and not only in the European region.
Juraj Vanovcan (juraj.vanovcan@gmail.com)
26 November 2010


Great work! Thanks!
But there’s one difference: The extremely weak sun. I wouldn’t be surprised if we experience a rapid plunge, and the similarity with the 1880-1920 period ends. Worldwide. I think it has already begun, and it already shows in the red line of your last figure.
I count four potential major factors of impact – all going south.
1. PDO
2. AMO
3. NAO (probably AMO or PDO-driven)
4. Solar
Could be the wamists have bet the entire kitty on the wrong horse.
Pierre, I am 100% sure they have.
You forgot to list El Ninjo/La Ninja and the wild card, volcanic eruptions.
The big question however is what mechanism is steering the cooling/warming trends.
I really think John Daly and Prof. Dr. Theodore Landscheidt were on the right track.
http://www.john-daly.com/sun-enso/sun-enso.htm
We are very close to solving the entire scheme.
Just keep a very big bin at hand to dispose of the gigantic pile of BS (bad science) and concentrate on the real stuff.
That last graph is uncanny.
The CET record is fascinating, especially if individual months are observed. May, June, July, August and September show almost no warming from 1700 with a bit of a blip starting 1990 (hardly the start of AGW but ties in with many records that show a leap at the same time). Combined there is no rise between 1700-1995. The blip is more due to a lack of cold years than a burst of excessively hot ones. February and March show more warming but not excessive amounts. January, April, October, November and December show the most warming. These months show steady warming from the start of the records and no obvious AGW boost.
Illuminating, very illuminating.
Naturally!
Big respect Juraj Vanovcan!
So, here’s my new theory: Mankind unconsciously remembers these patterns, and knows that The Cold is coming, but invented Global Warming to try and make it all go away. And to top it off, added the Magic Thermostat to gain control over the planet’s climate forever!
That explains all the wishful thinking and desperate urgency.
We’re all going to wish for that Thermostat soon enough!
LOL
😀
Interesting points, but it might be necessary to stress that the three warm summers 1940, 1941 & 1942 followed in each case one of the extreme cold winters, 1939/40, 1940/41, and 1941/42. Maybe the posting means the same when saying: “However, warm summers in this period were combined with cold winters, like those of 1939/40/41”. Does this clarification matters? Presumably yes. The more cold the Baltic Sea is after a cold winter, the more continental influence prevails the maritime, at least for some weeks during spring and the early summer. ·
AND: The hottest summer in Germany during the last century was 1947 , and not 1946: http://www.waldwissen.net/themen/umwelt_landschaft/co2_klimaschutz/lwf_sommer2003_wetternachhersage_2004_DE, ·
Concerning England: The summer of 1947 is the 6th warmest on record in records dating back to 1659. Only the summers of 1976, 1826, 1995, 1846 and 1983 have been hotter: http://www.dandantheweatherman.com/Bereklauw/Weather1947.htm
Hi Arnd, you understood it well; 40ties were all hot summers and cold winters.
1947 was hot and dry in Czechoslovakia, but 1946 was even worse. Soviet Union sent us their crop that time despite they were lacking it too, to promote the political situation which resulted in 1948 communist coup.
Tsonis’ “Synchronized Chaos” is looking better all the time.
UHI may have contaminated CET regardless of all the effort to remove it.
Gee, & reading the first 3 comments, about other potential factors I think there is a new cause just awaiting for the alarmists to latch on to, as AGW was just a means to an end . The same doom mongers will soon be preaching the opposite direction to catastrophe
Yeah but…
Trends are all very well, but isn’t the more recent (1970 – 2010) trend on a warmer base, by ~ 3/4 dgrees ?
Problem is, that the 1970-2000 trend itself is presented as the AGW itself. If we agree that there is some cyclical natural cycle, let’s compare lows or highs of the cycle. Doing that for North Atlantic SSTs, there is just 0.2 deg C increase in 65 years (between 1940 and 2005, or comparing the lows of 1910 and 1975). Overall trend behind is then 0.3 deg C/century, mere 10 to 25 times less than IPCC predicts for 2000-2100.
On the other hand, the slope of both warming periods is the same and there is no indication of steepening the linear trend behind, so CO2 hardly may be the culprit.
I have studied the IPCC AR4 concerning the NAO/NAM a bit. In the expert articles, there is often quite good overview of known physical processes, while admitting that observed post-1975 warming could be “partially” explained by these natural phases.
For example, cyclical AMO/NAO is told to be a natural pattern tracked back 400 years via proxies (even “some scientists suggested that the last positive phase might be anthropogenic”). Then there is a remark, that we do not know about underlying mechanisms. But! models predict these climatic modes will stay in the warm phase forever.
Result for policymakers – CO2 is very likely causing warming and European mild winters.
Betting against the models seems to beat the odds in the long run. IOW: Supercomputer powered GCMs perform worse than a toin coss.
We have an enemy that always sets himself up for losing.
I suspect James Hansen and his colleagues will be trying to explain this winter to congress in the near future without the usual friendly moderators. I would not be surprised if he is asked to comment on the NAO vs CET graph and to put on record where he thinks the climate is now heading.
At some point the Met and prominant climate scientists will have to own up to the likelhood of thirty years of cooling. I fear that with the declining AMO and solar activity we will not have the luxury of the 1940’s warm summers.
Dr Hansen will almost certainly in the future look back to this years El Nino as the
good old days.