Hardly! Ed Caryl brings us a classic example of GISS temperature data “adjustment”.
====================================================
Urban Heat Island at Providence Rhode Island
By Ed Caryl
A recent paper by Ping Zhang and Marc Imhoff of NASA Goddard Space Flight Center (NASA materials found here), pointed out the incredible heat island around some eastern U.S. cities, including Providence, Rhode Island, and Buffalo, New York. This author decided to examine this data, and compare it to the GISSTemp data for the same location.
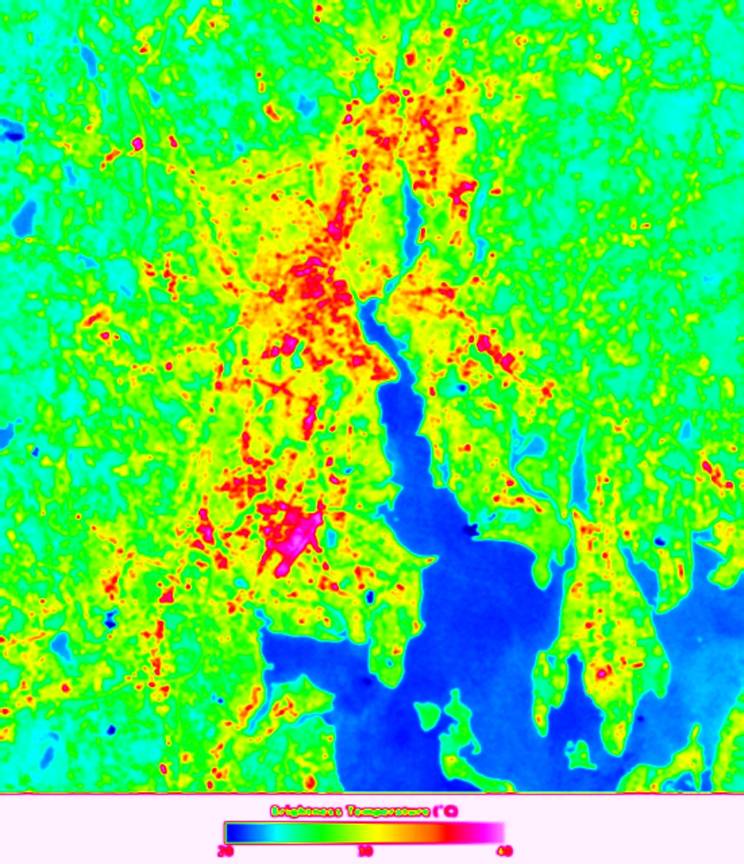
First, here is the image from the NASA paper, and below it, a heat map image derived from it. Note the temperature scale on the bottom of both images. The temperature scales are from 20 to 40 degrees C. Find the airport in these images.
and
The airport should the easy to find, it is the hottest place on the map, about 15 degrees hotter than the cool countryside at the edges of the images. This is the Warwick/Providence TF Green State Airport.
Now, where do you suppose the temperature is being measured at this airport?
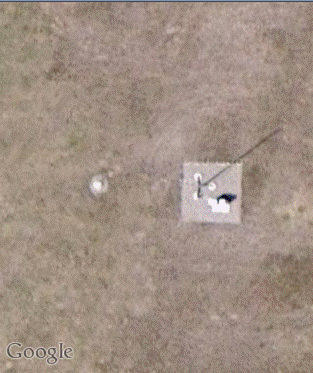
As at most airports, it is in between the main runway and the taxiway in front of the terminal. Right next to that purple spot on the heat image, the hottest place on the map. After all, the pilots want to know the runway temperature when they plan their landings and takeoffs.
Look at the 2 images below from the U. S. Geological Survey, and Google respectively. The weather instruments are near the navigation beacon (the dark spot, at the arrow, near the center of the USGS photo):
What does GISSTemp say about this location? There are two records in the GISS database: a raw data file, and a corrected file that they use for further processing, such as the U.S. and the global average temperature. The default file is the uncorrected raw data. The URL looks like this:
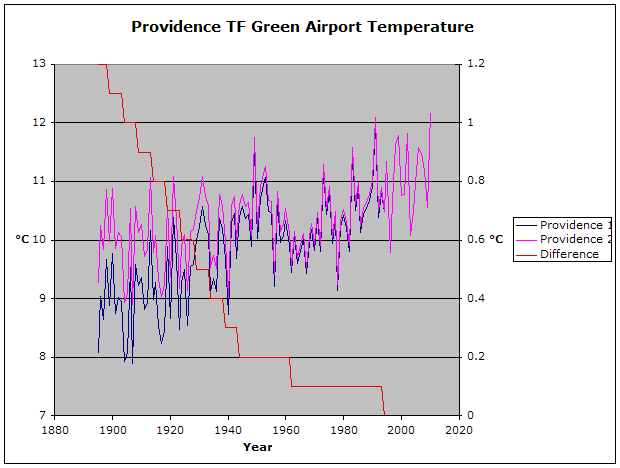
If you change the digit after the “set=” to a 2, you get the corrected data. Both sets of data are available as text files from a link below the resulting chart. Both sets of data were downloaded and charted below, along with the mathematical difference, the “correction”.
Both sets of data show a warming trend, but the uncorrected data (Providence 1) shows much more warming than Providence 2. The difference is a stepwise correction, warming the past by as much as 1.2 degrees C.
One would think that any correction should be to cool the more recent temperatures to correct for the increasing UHI, but that isn’t what they have done. And, most of the correction was done to data before 1940. This doesn’t make sense either, as most of the infrastructure and population buildup around the airport didn’t happen until WWII and after. Also, the correction amount doesn’t approach the UHI temperature rise measured by Dr Zhang.
Will Drs Hansen and Zhang get together?
Most of the surface temperature data that goes into the averages, whether world-wide, or here in the U. S., come from airports. In the U. S., the number is 121 out of 134 stations. Each of the airports in the images in the NASA paper can be clearly seen as a hot spot. Clearly, some work needs to be done to correct the surface temperature record in light of this information.
When will GISS get around to that?


Ed, thanks for this interesting article. I note that on the corrected graph at the GISS site the raw data points are indicated as ‘0 km’, while the ‘corrected’ line is shown as ’17 km’. Any idea what these distances mean?
That is the distance to a supposed “rural” station from which the “correction” is calculated. That station is Quonset Point Naval Air Station. The north end of the runway at Quonset Point is just visible as the red dot at the bottom center of the heat map.
To add insult to injury, the Quonset Point temperature record only runs from 1945 to 1973. ???
Hi, have just put a panel with more links about UHI ….worth a read too.
regards,
http://itsfaircomment-climategate.blogspot.com/2011/01/urban-heat-island.html
Thank you. One of the things I’m wondering is if the satellites are seeing UHI in their global measurements. If 3% of the globe is urbanized, and these urban areas are as hot as these NASA images indicate, what is the affect on global lower troposphere temperature? A back of the envelope calculation says it might be as much as 3% of 10 degrees or 0.3 degrees. Not insignificant.
Properly corrected historical temperature records would show global cooling since the 30s. What they are showing and recording is warming Micro climates that equal less than 1% of the global surface. They would be blind not to see all of this but it would result in less funding for their research to admit what is happening.
Ed you ask when will GISS get around to fixing that? Why would they want to do that, it is temp. readings like this example that allows them to say”2010 is the hottest year recorded”.
That’s a laughable adjustment. I suppose it wasn’t an airport before 1900. What would John Cook say, Dana?
Oh. He says it’s all righty right…
http://www.skepticalscience.com/microsite-influences-on-global-temperature.htm
“Good” and “bad” stations actually report the same stuff…
Marvelous website, marvelous, couldn’t make it up… Thanks Dana, for reminding us of this laughable website.
I went to the first graph, downloaded the data, and then set the digit = 2 and downloaded the second set of data and both sets of data are exactly the same. What am I doing wrong?
I don’t know. It still works for me. Try again.
I got it. I was changing the last number in the neighbors=x link.
I said it will fail one way or the other. Europe is so broke that feed in tariffs for renewables are slashed left, right and centre. Huge new oil finds. Bill Gates moves into oil. Bad day for Connie, the Crazy Climate Commissioner IMHO.
http://www.suite101.com/content/investors-abandon-green-energy-in-wake-of-huge-new-gas-and-oil-fi-a335451
As to the comment “One would think that any correction should be to cool the more recent temperatures to correct for the increasing UHI” I agree but I don’t think they should be using any temperature data at all from any urban area where UHI is a factor. They should only be using strictly rural (and unadjusted) data from wherever they can get it.
That would reduce their station count to 13 in the US!
I hate to say it but I’d trust the temperature trend those 13 stations would give us over what they have been presenting to us.
I attempted to scrape the records for USHC-M, but so far have come up empty. The records aren’t long, but should be publicly available regardless.
The defenders of the surface station network apparently aren’t aware it was well known over 13 years ago it was unreliable and not intended for such high resolution necessary to diagnose long term (no there need not be 30 years to identify break points) temperature change.
http://www.ncdc.noaa.gov/crn/programoverview.html
“One of the principal conclusions of the 1997 Conference on the World Climate Research Programme was that the global capacity to observe the Earth’s climate system is inadequate and deteriorating worldwide and “without action to reverse this decline and develop the GCOS, the ability to characterize climate change and variations over the next 25 years will be even less than during the past quarter century” ( National Research Council [NRC] 1999). In spite of the United States being a leader in climate research, we do not have, in fact, an observing network capable of ensuring long-term climate records free of time-dependent biases. Even small biases can alter the interpretation of decadal climate variability and change.”
A ground view of the measuring site at the Providence airport is here:
http://gallery.surfacestations.org/main.php?g2_itemId=11907
This is at Anthony Watts’ SurfaceStations.org web site. The building in the background is the airport terminal.
The station history doesn’t match the length of the record. It was in downtown Providence from 1831 to 1953 in various locations, then moved to the airport. But there was a station at the airport beginning in 1932. For a full read of the site description go to:
http://gallery.surfacestations.org/main.php?g2_itemId=52728&g2_imageViewsIndex=3
According to Joe Bastardi we’re going to need our urban heat island effect:
http://www.accuweather.com/video.asp?channel=vbbastaj
And what can heat up also can cool down.
http://wattsupwiththat.com/2011/01/21/new-record-cold-tempertures-in-minnesota/
We shale overcome.
Joe was at his best in that one. 8+ minutes of education.
[…] and this author have written about urban warming here and here. It is clear from the infrared satellite photos by NASA that urban heat islands are both more wide […]
[…] Have you heard of UHI? Here is an excellent compendium of the problem. Even NOAA knows the truth about that, and has known it for over 20 years, read here. There is also the increased reporting phenomenon; blame the Internet. This, and satellites, are responsible for much of the recent extreme weather reporting. NASA also knows. […]