By Ed Caryl
There have been multiple studies of solar influence on global and regional temperature changes. Just of few of them are here, here, here, and here. This author made a contribution to the question here. Many of these studies show a some correlation of the sun’s output versus temperature, but most researchers think that this relationship is a weak one, contributing from one third to one half of the observed warming. So, from where is the remainder coming?
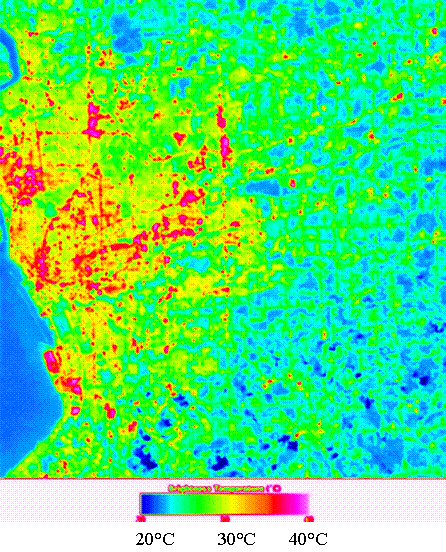
Pierre and this author have written about urban warming here and here. It is clear from the infrared satellite photos by NASA that urban heat islands are both more wide spread and warmer that previously known. Particularly in the eastern half of the U. S., the heat islands are blending together, raising the temperature of the whole region. How much?
No one (to my knowledge) has researched what part of the global temperature rise is due to energy use. All energy use ultimately goes to heat. This is what causes the heat islands. Much of energy usage is immediately wasted as heat: cooling towers at power plants, automobile radiators, heat loss through home insulation, heat loss up the chimney, electric motor heat loss, heat from electric lights, are just a few examples of heat losses. Even energy used to transport things is ultimately lost as heat. Just moving something through the air, heats the air. For this reason, we can convert all the energy used into watts and calculate the temperature rise. In these calculations, the energy used will be considered over particular land areas.
The first area considered is the U.S.A. There are figures for the energy consumption in the U. S. in 2005, 29 Pwh (Petawatt hours, a PetaWatt is 1015 watts. That is 1 with 15 zeros. The area of the contiguous U. S. (the lower 48 states) is 8,080,464 km2. If we divide the energy used by the area, we get 3,589 Wh/m2. Divide that by 8766 hours in a year we get 0.409 W/m2, or 9.826 Wh/m2/day, as the average energy dumped into the environment in the U. S. in 2005.
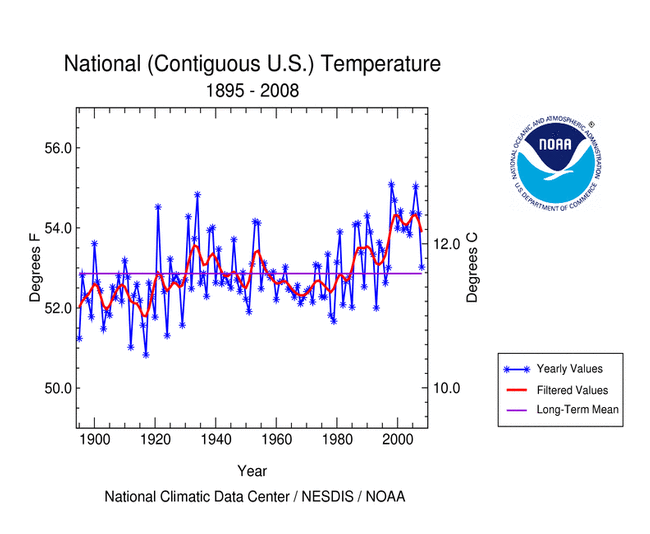
The sun provides about 4.5 kW/m2/day on a horizontal, flat, black, surface at the average latitude of the U.S. The average albedo of the earth’s surface is 0.3, which means that on average, the surface will absorb 70% of the insolation (solar energy) that strikes it. This means that the effective heating will be 70% of 4.5 kW/m2/day, or 3,150 W/m2/day. The energy dumped into the environment by every American’s energy use is 0.312% of the sun’s energy. This will raise the temperature by 0.312%. The average temperature in the U. S is 11.6°C or 284.75°K. The temperature rise will be about 0.89°C.
As you can see on the temperature chart below from NOAA, this will neatly take care of the temperature rise seen in the last 25 years.
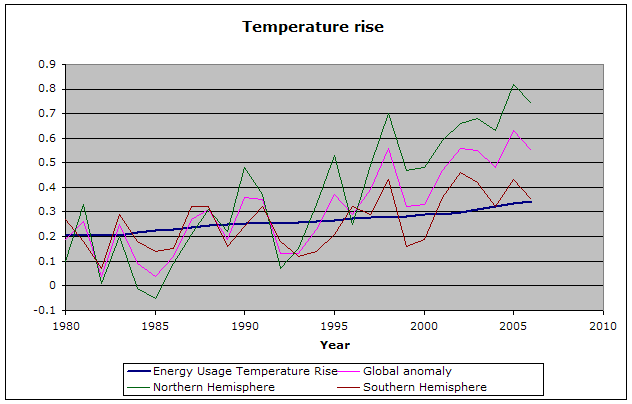
What about the global picture? Figures are available for global energy consumption for 1988 through 2006. As most of this consumption is in the northern hemisphere, and that is where we see the most warming, the calculation uses the northern hemisphere land area, 100,228,500 km2. The same average insolation value will be used as in the U. S. example above, 3150 W/m2/day. Figure 3 is a chart of global and hemispheric temperature trends and the calculated temperature rise in the land area of the northern hemisphere due to energy usage. The temperature anomaly data comes from GISS/NASA here. The chart may underemphasize the temperature rise due to energy use because energy use is localized to a limited local areas in few countries: the US, Europe, including Russia, and China. The temperature data may also be overemphasized because the surface temperature measuring sites are at airports and other urban settings that are even warmer than the average location.
Dr. Richard C. Wilson states that 50% of the temperature anomaly is due to total solar irradiance changes (TSI). Drs. Judith Lean and David Rind make predictions based on TSI along with ocean cycles. Neither mentions any influence from energy usage.
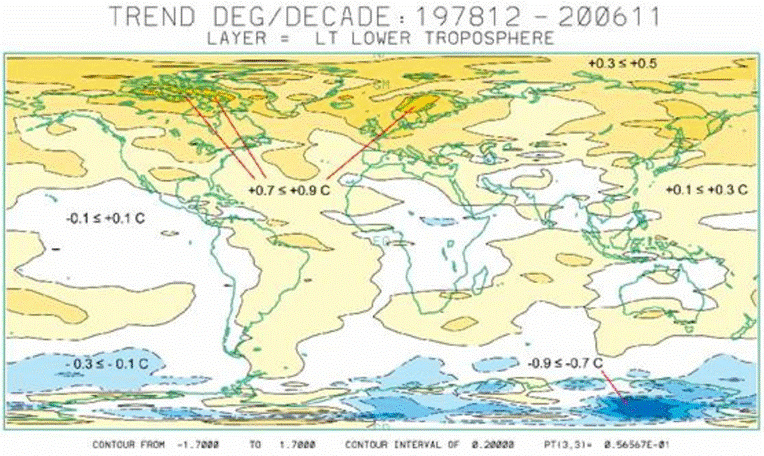
Here are two maps. The first is the lower troposphere temperature rise over the period 1978 to 2006, much the same period as the chart above.
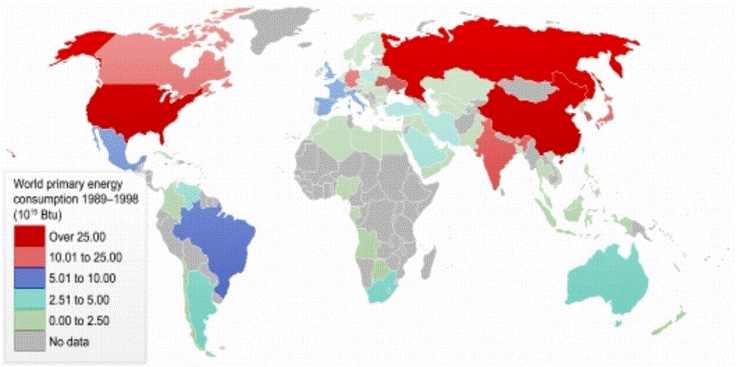
The second map is of energy usage by country.
Though the energy usage map is very coarse, one can see that the maximum energy usage area roughly coincides with the same areas as the northern hemisphere temperature rise.
The planet has been heating in the last two hundred years. Some of that change in temperature comes from ocean cycles, some from the sun and its various influences, and some from man. Much of the anthropogenic (man caused) portion is simply energy use that has dramatically increased in the last fifty years. A thorough, honest, investigation needs to be done before we blame it all on CO2.


Please check your units, Ed.
“or 9.826 Watts/m2/day”
Do you mean Watt-seconds here? You have to have energy here, not power, when you divide by days. In this case you should write Ws to avoid confusion with the plural of Watt.
And then:
“This means that the effective heating will be 70% of 4.5 kW/m2/day, or 3,150 W/m2/day.”
Again – Ws? (I’m too lazy to compute it myself, i could probably find out, sorry…)
I think you need to drop the “/day” in your results…
No, not Watt-seconds. It seems wrong and awkward to me to write 9.826 Watt/m2/day.
Ok, but in that case you still have a problem with the units. W/m^2 is the right unit for the insolation; but the “/day” makes no sense.
It should all be Wh (Watt-hours). So it should read 9.862 Wh/m2/day. This is the unit the insolation maps use.
http://rredc.nrel.gov/solar/old_data/nsrdb/redbook/atlas/serve.cgi
Ok.
O/T Kretschmann, new Green MP of Baden-Württemberg (that’s where Porsche and Daimler have their HQ’s!), starts his reign by announcing that we need to get by with less cars in the future that consume “much less fuel”. “„Wir wollen grüne Produkte und Dienstleistungen exportieren. ” – “We want to export green products and services.” ATM, one out of four employees in BW work for the car industry.
http://www.focus.de/politik/deutschland/auto-kretschmann-regt-weniger-autos-fuer-baden-wuerttemberg-an_aid_621133.html
This is starting to get funny. Greens, meet reality.
Sorry, mixed up numbers – “about every 5th of the industry emplpoyees in BW works in the automotive sector”
Kretschmann is one of the old communists in the German Green Party.
http://en.wikipedia.org/wiki/Winfried_Kretschmann
“From 1973 to 1975 he was active in the Communist League of West Germany”
Ed,
Well I had a go, but then I found it had already been done by Prof Bo Nordell, Lulea University, Sweden (http://www.ltu.se/shb/2.1492/1.5035?l=en)
“Nordell published a controversial explanation to global warming in 2003 (Thermal Pollution Causes Global Warming, Global and Planetary Change. Vol. 38, Issue: 3-4, p. 305-312.). Since it has not been possible to get external funding for this idea most of the work was carried out during a long time as a “hobby research” with the assistance of helpful and interested students.”
Photovoltaics will, ironically, increase the effect. And Desertec-style solar thermal power even more.
Nordell missed the total energy use idea. And DirkH is correct about solar. Even Bird Blenders increase the heat, especially if there are thousands of them.
To be honest I think there is a lot in this, but proving it needs some detailed subjective work:
– there are stations (even urban ones) in which there is no temperature rise – why?.
– there are urban stations with huge rises – why?
Unfortunately there is no one formula for all, and this is where the current climate data analysis fall down.
“All energy use ultimately goes to heat. This is what causes the heat islands”.
That’s not true Carl.
The heat island is simply caused because the concrete, steel and glass buildings absorb the heat of the sun.
A city heats up quickly but cools down slowly.
The most prominent effect of the UHIE is the rise in night temperatures.
The energy use in a city is only a very small effect, let alone the effect of CO2.
What play’s a big role is convection and water vapor and the temperature gradient of the air column over the city.
During periods where a city is under the regime of a high pressure area, winds lay down and an inversion (a layer of air where the temperature rises instead of decline at an increase in altitude). As the air in the city heats up, it expands and starts to rise like a hot air balloon. This process is blocked by an inversion.
Under these ‘stable’ conditions temperatures in the city sky rocket as the heat is trapped. That’s also the reason why visibility declines and smog builds. All the air is trapped under the inversion.
Under unstable atmospheric conditions, in the afternoon, a big cloud builds over the city. The heated air warmed by the surface is transported into higher and cooler parts of the atmosphere where it cools down and the water vapor at a level where saturation is established and a cloud builds.
These clouds which dissolve at the end of the day keep the town relative cooler because they reflect the sun.
This process of convection, cloud building and the is a very essential part to understand why in some cities the UHIE effect is relative small and big in other cities.
Convection, cloud building and the vertical temperature gradient/inversion are not represented in the models but it is the biggest factor to understand the heat transport in our atmosphere.
As an experienced glider pilot I read the clouds and the landscape, flying distances over 300 km in a single flight without the use of an engine..
If I am in need of a thermal, a rising air current, and I am over a city I always look for a railway emplacement or a big asphalt parking lot near a shopping maul because I know these are the heat sources that produce the rising air currents that carry me and a 1000 lbs glider to higher altitudes with climbing speeds between 2.5 up to 6 meters per second. Yes, the energy released by rising air currents is incredible but every day is different all depending on wind direction, the characteristic of the air coming in, if there is higher cloud cover, a passing cold front, so many variables to be taken into account.
What is rule however is that the sun heats the air by heating the earth surface and heated, expanded air goes up where it cools down again.
That process goes on every day.
Ron,
All true. And all that just adds to the problem. If a city is darker, a lower albedo, it gets hotter. Concrete and asphalt absorb more solar energy, and retain it. I’m not completely satisfied that energy use is secondary. Cities are very complicated machines.
Cities are very complicated machines?
No Carl, I don’t think so, at least not in regard to the heating and cooling problematics. These are simple principles.
The sun doesn’t heat up the air directly. It heats the surface and the surface heats the air. That’s how the heat is transfered.
The heated air forms a bubble which is blown over the surface by the wind. It is in need of an impulse, a passing car, a tree line to start it’s travel up into the air. A surface station measures the temperature of the air at a fixed hight, less than 2 meters from the ground level so it measures the effect of the surface heat.
But If you have an engine running things are a bit different. An engine heats up the surrounding air at much higher temperatures, via it’s engine block, the hood, the exhaust which can get terribly hot and the exhaust gasses which if the engine is warm can reach temperatures over 100 degree Celsius. This heat is immediately dispersed to higher altitudes where it cools off instantly. A surface station is not affected by that kind of heat simply because it goes high into the sky right away.
So although burning oil by running an engine generates heat, it doesn’t contribute to the surface temperature.
As for your remark “Concrete and asphalt absorb more solar energy, and retain it”. I can tell you that this idea is wrong.
As soon as a the sun heats up the surface the heat transfer from the surface to the air takes off. The problem we have is that the density of our air is so low that it will take until deep in the night for asphalt to cool off again. But the ‘destruction’ of solar heat takes starts the moment the sun appears above the horizon and it stops when the day ends.
The heat of the sun absorbed by the forests is released by the end of the day when the surrounding air cools. During the day time you will never find a thermal (unless the forest is on fire), a rising air current over forests, but at the end of the day forests feed slow rising thermals that give you just the needed altitude to get home.
Moist area’s like irrigated lands and swamps don’t produce any thermals.
We have mapped the rising air currents over most of Europe and the USA by tapping the glide computers and turning the data in a programmable d-base. Today before you make a flight you program the glide computer and feed it with the track you want to fly and the wind speed and wind direction. The computer display’s the locations where under the programmed parameters thermals can be found.
The biggest and most reliable source for thermals are the big cities but also sand plates, especially when they are located near a lake (how bigger the difference in temperature, the stronger the thermal) and rock formations that are on the sun side.
Ron, make up your mind! You just said “The heat island is simply caused because the concrete, steel and glass buildings absorb the heat of the sun.
A city heats up quickly but cools down slowly.”
Now you say that’s wrong. ???
There is now a solid grass roots effort by the masses of former climate change believers to have the leading scientists and leading news editors subjected to criminal charges for knowingly sustaining the false CO2 death threats to billions of children for the last 25 years of the climate blame mistake. This false war against a false enemy of climate variation was no different from Bush and his false war.
And keep in mind that it was the scientists themselves that made environmental protection necessary in the first place when they supposedly polluted the planet with their evil chemicals and cancer causing pesticides and so how ironic is it that we bowed like fools to our Gods of science for 25 years of “unstoppable warming”?
Scientists are not gods and don’t forget that scientists also produced cruise missiles, cancer causing chemicals, land mine technology, nuclear weapons, germ warfare, cluster bombs, strip mining technology, Y2K, Y2Kyoto, deep sea drilling technology and now climate control. Proof of consensus not being real is the fact that scientists did not march in the streets when IPCC funding was pulled, the EPA was castrated and Obama’s not even mentioning the “crisis” in his state of the union speech. Consensus was a myth because if it were true, the consensus scientists declaring a climate emergency would act like it was an emergency and demand their CO2 mitigation be taken seriously. We believed a handful of lab coat consultants who said we could CONTROL the planet’s temperature and prevent it from boiling. Pure insanity as history will call this modern day witch burning. The new denier is anyone still believing voters will vote YES to taxing the air to make the weather colder. Not going to happen.
REAL planet lovers don’t hold scientists as Gods and bow to politicians promising to make lower the seas and scare kids with such doomsday glee.
Stay tuned. We missed getting Bush for his false war and a wave of former believer rage will get this one right. Call the courthouse.
An interesting post Ed. It’s interesting to see some dimension put on this as one of the many and varied factors influencing temperature. You have mentioned that there is a lot of energy wasted i.e.
“Much of energy usage is immediately wasted as heat: cooling towers at power plants, automobile radiators, …..”
I’m not clear on whether the figures you have adopted for consumption represent total fuel from all sources (including nuclear) converted to heat, or in the case of electricity just the actual energy delivered to users. If the consumption figures don’t include these types of losses then the actual energy converted to heat would be very much greater than that adopted?
I presume the inclusion of electrical energy produced by windmill or solar voltaic generation, although it’s only a very small component, would not be appropriate in your calculations.
Flow chart of energy production and use in the US
http://geology.com/news/2011/energy-sources-and-uses.shtml?utm_source=feedburner&utm_medium=feed&utm_campaign=Feed%3A+Geologycom+%28Geology.com%29
94.6 quadrillion BTU = 2.77245232 × 10^16 watt hours (says Google);
or 27 PetaWh
So Ed has included the losses already, i think…
Yes thanks Dirk.
This chart confirms the proportion of the energy input from wind, solar and hydro to be small. I’m unsure how these forms of energy should be considered in this kind of calculation.
Take hydro generation for instance, we are converting the potential energy of elevated water to electrical energy but the water is not losing any more energy than it would otherwise in more gradually in flowing down the river and stream system from the highlands to the lowlands. So if we consider the electricity generated by hydro generators as heat should we also consider the energy given up by all the worlds wild undeveloped rivers to be heat?
With coal the situation seems to be more straight forward, it can reasonably be considered as a release of prehistorically stored chemical energy and so it fits better with transient radiation balance requirement of the current day calculation.
I don’t seek to cast doubt on the validity of Ed’s approach, maybe I’m missing some simple fundamentals underling this aspect?
I think you are right about the rivers. With wind power, it’s different because we extract energy that would otherwise not be extracted, produce heat through friction and electricity that is converted into heat at the load.
Solar power is different still – PV panels are endothermic like plants with regard to the fraction (about 5 to 18% depending on technology) they convert into electricity; that’s a cooling effect, but nevertheless they become pretty hot due to their low albedo. The energy extracted is converted back to heat at the electric load. So maybe PV’s main influence can be seen in a reduction of Earth’s albedo – not a big influence that, but locally, a huge PV farm could have a significant influence on the microclimate. Something like land use change.
Thanks again Dirk. I follow with the PV cells, but not with windmills.
For instance I would expect that wind would not differentiate between say a forest of windmills and a forest of large palm trees. Air friction with trees would produce heat just as it does in passing over the sails of a windmill. I know things aren’t that simple but presumably if you had an appropriately placed large forest all the kinetic energy could be removed from the wind and converted to heat. So if a windmill was to be placed in that forest and converted part of the wind energy to electricity, wouldn’t the release of that electrical energy as heat just be returning that heat component which would have been available initially to the infinite forest as friction? Should it be concluded that when an increased number of obstructions (like windmills) are placed in the path of the wind (ignoring albedo change and latent heat effects) we are significantly increasing the amount of heat energy released to the atmosphere?
I know this is a simplified reasoning, but I find it difficult get my head around what is going on. But I’m sure that quantitatively windmills will make no difference one way or the other to Ed’s radiation balance calculations (just as they make no useful contribution to electricity generation).
Consider this:
http://www.newscientist.com/article/mg21028063.300-wind-and-wave-energies-are-not-renewable-after-all.html
@Ed Carl
“Ron, make up your mind! You just said “The heat island is simply caused because the concrete, steel and glass buildings absorb the heat of the sun.
A city heats up quickly but cools down slowly.”
Now you say that’s wrong. ???”
Ed Carl, read my comment again and don’t behave like an ass.
You made a comment which I agreed with, the one quoted above. You then made a comment which in part contradicted the first comment saying my comment (where I thought I was agreeing with you) was wrong. I don’t understand your hostility! And my name is Ed Caryl, with a y.
Ed, I simply explained the process of convection that takes place under different circumstances.
There is no contradiction in that.
If you claim that Anthropogenic warming is real and also state that the burning of fossil fuels is the cause of the Urban Heat Island Effect I say BS (Bad Science)
Thanks for your help Dirk.
Kleidon’s comments are certainly interesting. But the old BS detector starts twitching a little when I read comments such as this:
“but we certainly use more of the free energy than [is used by] all geological processes.”
“The magnitude of the changes was comparable to the changes to the climate caused by doubling atmospheric concentrations of carbon dioxide”
There is nothing wrong with our climate.
Just have a look at this publication from Joe Bastardi
http://www.weatherbell.com/jd/?p=1102
Also have a read at this article from E.W Smith, Two Airports
http://chiefio.wordpress.com/2011/04/27/two-airports/
Same subject, different conclusions.
And also have a look at the updated Central England Temperature data set from 1659 which doesn’t show any change at all since the record began.
http://www.weatherbell.com/jd/?p=1102
As for the CO2 playing any role, please read this article from hans Schreuder: http://www.slayingtheskydragon.com/en/blog/137-ten-physics-facts-setting-the-record-straight
I think that none of the warming is due to carbon dioxide. To the contrary, carbon dioxide is responsible for some cooling due to photosynthesis. I believe it is presently all due to the amount of energy used (which all becomes heat). For the year 2008 I have calculated the amount of heat generated and carbon dioxide produced and compared these expected values to the averages for the period 1980-2000. The expected rise was 0.17*F compared to the average of 0.04*F. (24% to atmosphere, 76% elsewhere). Likewise the expected carbon dioxide rise was 4.1 ppm compared to the average of 1.25 ppm (30% to atmosphere, 70% elsewhere). There are many possible ways to adjust or explain the results. I took the approach that the rest of the carbon dioxide was taken up through photosynthesis to produce cellulose in trees. This then absorbs a calculable amount of energy in the process with the resulting heat distribution as follows: (all numbers multiplied by ten to the sixteenth power). Atmosphere 11.6 BTUs, photosynthesis 25.3 BTUs, Glacial melting 12.0 BTUs, for a total of 48.9 BTUs. These are interesting calculations and while speculative, show (a) carbon dioxide can provide some cooling, maybe as much as 25E16 BTUs per year, (b) global warming is caused by energy consumed.