By Matti Vooro
After years of being ignored by AGW climate scientists and modelers, the Atlantic Multidecadal Oscillation (AMO) has more recently been recognized as a factor in climate forcing.
The Met Office at the December 5-9, 2011 presentation at the Fall AGU Meeting reported that they now use AMO unfiltered in their interannual and decadal climate forecasts. I have been writing about AMO since 2009 (see below) along with other writers. Some of the articles have appeared on WUWT and ICECAP blogs. More recently Bob Tisdale has done some fine in-depth analysis of AMO [see below]. It is not the intention of this brief article to repeat all that material nor to explain what AMO is, or is not, other than just to summarize as follows:
The AMO is an ongoing series of long-duration changes in the sea surface temperature of the North Atlantic Ocean, with cool and warm phases that may last for 20-40 years at a time and a difference of about 1°F between extremes. These changes are natural and have been occurring for at least the last 1,000 years.
The AMO index is calculated at NOAAPSD by using the Kaplan SST data set (5×5), determining the area-weighted average over the North Atlantic over 0-70N and then detrending this data. The AMO has affected air temperatures over much of the Northern Hemisphere, in particular Eastern North America and Western Europe. For more information on AMO refer to the references at the bottom of this article.
It is the intent of this brief article to offer some preliminary or early results from my own analysis of AMO and the Canadian East Coast climate correlation. I will leave detail analysis to those who make their living in this field.
The AMO seems to be a significant climate factor affecting Canadian East coast surface temperatures, including the air temperatures of the four Maritime provinces, Labrador and Quebec air temperatures and even sometime reaching as far west as Ontario. These areas represent about 20% of Canada’s total surface area.
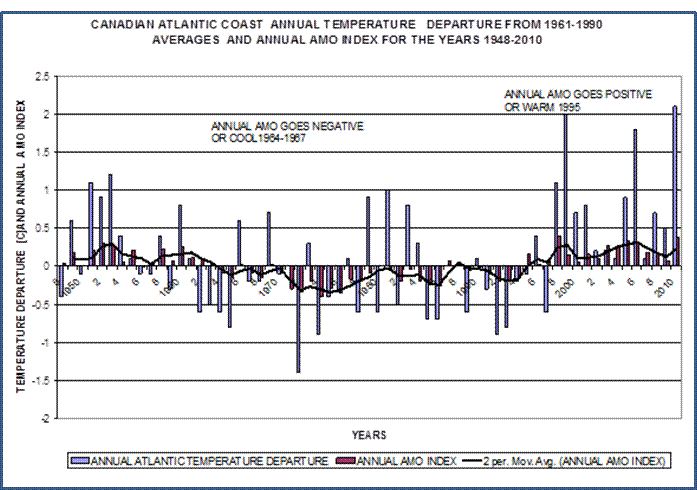
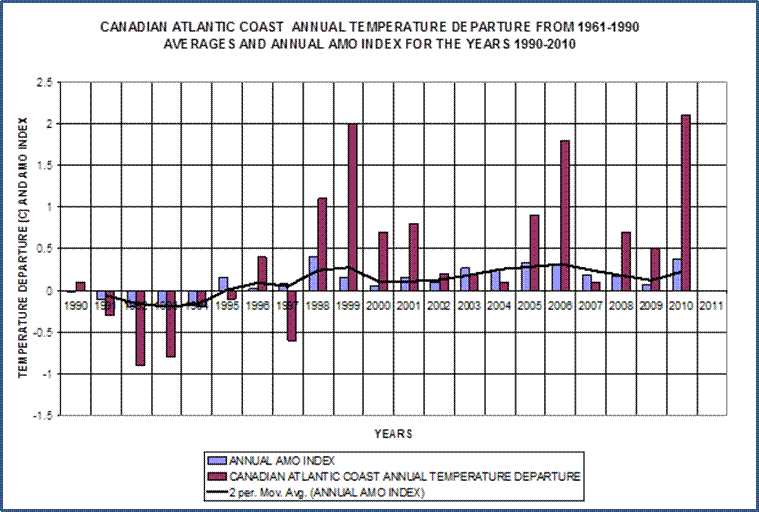
The first graph shows the Canadian Atlantic Coast Annual Temperature Departure from 1961-1990 averages and the Annual AMO index for the years 1948-2010. This period was picked because it was the only period for which Environment Canada provides temperature data summaries. The graph shows that the Atlantic Coast annual temperature departures seem to fluctuate with the cycles of AMO. The warm cycle when AMO was positive 1926-1964, a cool cycle when AMO was negative or cool 1965-1994, and finally another warm cycle 1995 to the present when AMO has been mostly positive. The year 2010 was the warmest annual year for the Atlantic Coast post 1948 with a departure of 2.1°C.
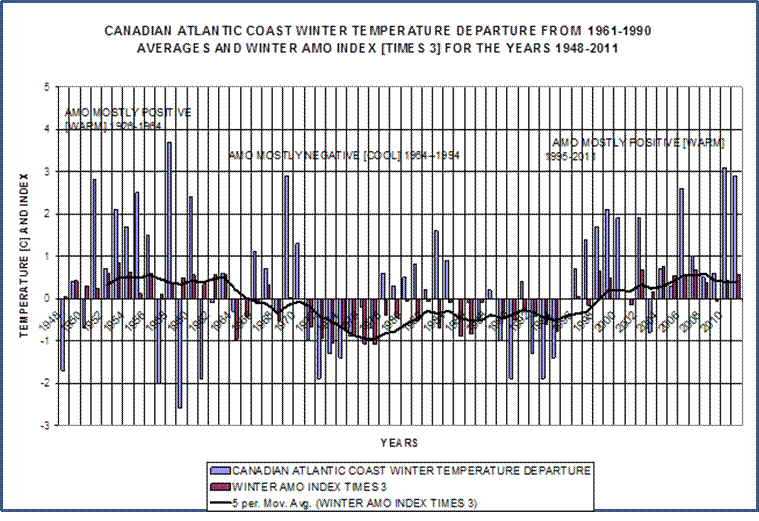
Figure 2 below shows a similar pattern for the Atlantic Coast but for the winters. Note that the winter AMO index has been scaled up by a factor of 3 for better visibility.
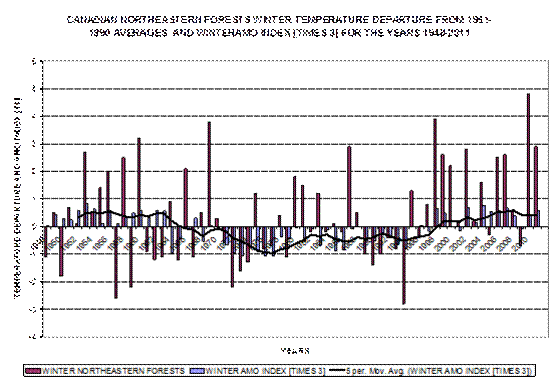
Figure 3 below shows a similar pattern for the winters of Northeastern forests area which includes areas like Labrador, Northern Quebec and Ontario.
Figure 4 below is for the period 1990-2010 and illustrates in detail how the annual Atlantic temperatures went up as AMO went positive or warm in 1995.
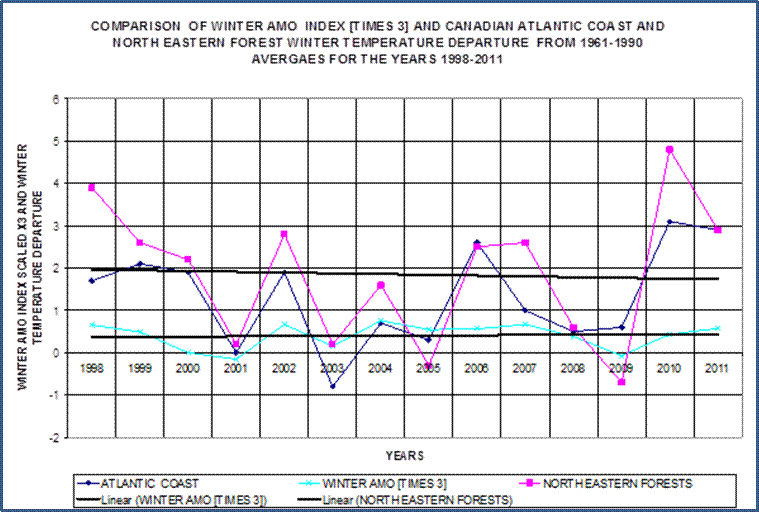
Figure 5 below illustrates the post 1998 period and how the Winter Atlantic Coast and Northeastern Forests temperature departures both seem to follow the winter AMO pattern. Both are relatively flat or slightly declining. One can clearly see the temperature drop in 2009 when AMO went briefly negative during early part of 2009 for about 5 months. This may happen again during early 2012.
The sixth and final graph below shows the monthly trend of the AMO index since 2005. As of November it had gone negative for the first time since 2009 at -0.035.
Final comments
Temperature departures in Eastern Canada seem to follow the AMO index as we saw above. I tend to think that the current negative AMO level is temporary and seasonal only. I think the durations of negative and positive AMO cycles are variable and the next sustained negative or cool phase for the AMO may not start for few years more (possibly 2015). In my opinion a cooling will be first observable in the Arctic Ocean SST and in the Arctic atmosphere caused by more high altitude cold atmosphere transferred to lower levels in the Arctic region. The cooler Arctic together with a negative AO will in turn cool the North Atlantic Ocean and the AMO via currents and atmosphere links and eventually cool the land areas of the Eastern Coast of North America and Western Europe.
The predictive value of the negative AMO is that once AMO starts to go negative for a more sustained period (and it can be as long as 60 years and as little as 6 years), it can foretell of sustained global cooling (especially Northern Hemisphere) and adds to the cooling already caused by the cooler SST pattern in the North Eastern Pacific. Such a period existed 1964 -1976 (and to the late 1980’s for Europe) when both PDO and AMO were negative. A stronger negative PDO index is typically a result of both more negative SST anomalies in the NE Pacific in combination with more positive SST anomalies in the Central North Pacific. During the last cooler period for Europe, namely 1962-1987, a period of 26 years, 21 (80%) years had a negative or cool AMO. AMO was last negative from 1964 to 1995 or 31 years and prior to that it was negative from 1902 -1926 or 24 years.
References
– http://wattsupwiththat.com/2009/07/14/the-atlantic-multidecadal-oscillation-not-quite-cool-yet/
– http://wattsupwiththat.com/2011/12/09/the-november-amo-index-goes-negative-first-time-since-1996/
– http://icecap.us/images/uploads/amoarticlel.pdf
– http://bobtisdale.blogspot.com/2010/08/introduction-to-enso-amo-and-pdo-part-1.html


While looking around for live AMO data, I found this on WUWT’s ocean oscillation page:
South Atlantic Sea Surface Temperature – 1979 to Present
http://www.climate4you.com/images/NOAA%20SST-SouthAtlantic%20GlobalMonthlyTempSince1979%20With37monthRunningAverage.gif
Dropping like a stone!
Last time this happened before the Super El Nino 1998, it seems (I do not want to imply that we are headed for a repeat of that. I think the deep Solar minimum will interfere with that this time.)
found here:
http://wattsupwiththat.com/reference-pages/oceanic-oscillation/
In a previous post I noted that cold weather was around the corner. Just take look at these predicted tempertaures for Canada in another seven days .
http://www.eldoradocountyweather.com/canada/Hi-Low-Forecast/7dayforecast.html