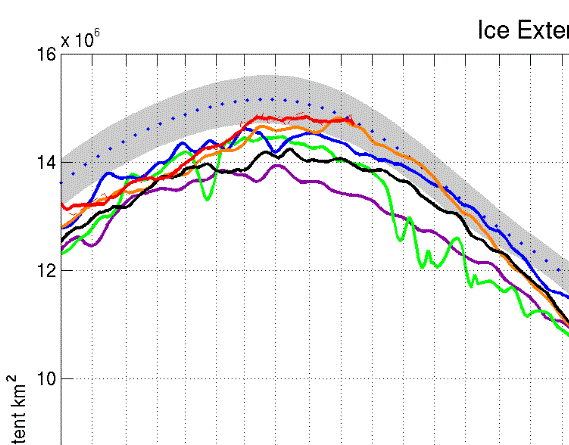
Strange how often we keep hearing headlines of “dramatic drops”, but never hear headlines of “dramatic rises”.
With all the “dramatic drops” we’ve witnessed over the years, you’d think we would be ice-free by now. But we aren’t – global sea ice levels are back up to normal.
There’s only one explanation for that: There had to have been an equal amount of “dramatic rises” to offset all the “dramatic drops”. Strange how we never hear about those, isn’t it?
If the description “dramatic” applies when sea ice falls from normal levels, then it also has to apply when it goes back to normal levels, as it obviously keeps doing. Last July when the sea ice extent fell, the media screamed everywhere “dramatic drop”!
How many headlines of “dramatic rise” have we heard this month? Do we ever hear any headlines of a “dramatic rise”? Strange how going from 0 to -2 is dramatic for the media, but going back from -2 to 0 is not even worth mentioning.
With all the headlines of “dramatic drops”, logically there has to be an equal magnitude of “dramatic rises”, otherwise it would be mathematically impossible to be at a normal sea ice level today. Proof of media bias.
Figure 2: NORSEX Arctic sea ice extent dramatically back to normal levels (red curve).
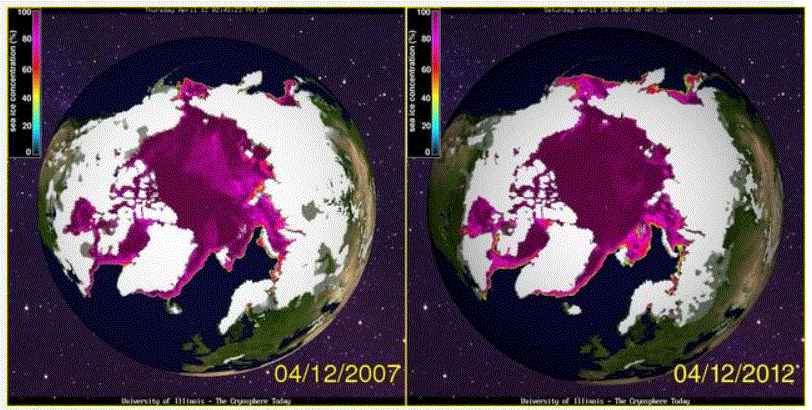
Not only has sea ice extent risen dramatically, it has also thickened “dramatically” too. See Figure 3.
Figure 3: Cryosphere Today. Note how sea ice concentration today is much more solid than 5 years ago, after it had “dramatically” dropped.
But listening to the media, always announcing “dramatic thinning”, you’d thick the sea ice would be paper thin by now. Well it aint. In fact it’s thicker than it has been in a long time. Thanks to the “dramatic” thickening that occurs almost every year.


Do you remember this article:
Arctic summers ice-free ‘by 2013’
http://news.bbc.co.uk/2/hi/7139797.stm
Well, it would be ice-free by 2013…were it not for all the darn “dramatic ice increases” that keep cancelling the “dramatic” ice melts.
Even if Shakun’s hypothesis is true, what I don’t believe, the nice S shaped curves indicate that the CO2 supposed amplifying effect reached a saturation point long ago and is now ineffective. The slight temperature decrease at the end of the curve when CO2 concentration increase, confirm that CO2 concentrations are no longer, if they were ever, a controlling factor for temperatures.
Franz Asbeck, solar millionair and boss of SolarWorld, criticizes subsidy cuts. “Our enemies want to destroy us. They want to stop solar enery before it is too late for them.”
Enemies are EON, RWE, EnBW and Vattenfall for him, the electricity providers of Germany.
Also demands protection against Chinese imports via tariffs. Announces lawsuit in Brussels against Chinese “dumping”.
http://wirtschaft.t-online.de/solarworld-chef-man-will-uns-kaputtmachen-/id_55612080/index
SolarWorld’s stock quote looks as expected.
http://www.comdirect.de/inf/aktien/detail/chart.html?timeSpan=5Y&ID_NOTATION=142944
“SolarWorld AG Inhaber-Aktien o.N.”
Ha. Ein Witz.
Mirrors Continental and British Isle land temperatures since 2008.
It’s clever you began your graph at 2003 — including all the data shows that there’s been a long-term drop in total global sea ice extent. According to NSIDC data the decline is 39 Kkm2/yr…. The last 10 years has been 3.0% lower than the decade before, and the last year is 4.8% below the 1979-2000 average.
Why didn’t you show your readers a plot of the entire data?
Why didn’t you provide a link, David?
http://arctic.atmos.uiuc.edu/cryosphere/IMAGES/global.daily.ice.area.withtrend.jpg
[…] » So much for global warming – global sea ice area back up to normal (again and again) Dramatic Sea Ice Increase! Why So Many “Dramatic Drops”, But Never “Dramatic Rises”? notrickszone.com – April 15, 2012 “Strange how often we keep hearing headlines of […]
Why didn’t you show your readers a plot of the entire data?
You guys might want to revisit the NORSEX sea ice extent data again….
Interesting how quickly the picture changes, huh?
http://arctic-roos.org/observations/satellite-data/sea-ice/ice-area-and-extent-in-arctic
And it can change the other way just as quickly. It’s mid-June after all, the period of max melt. Look at 2008 as an example of variability. You are looking at weather, not climate.