 An honest look at the data allows us to conclude only one thing: The path to protecting the planet is paved with energy and human prosperity. A shortage of either would mean big trouble for the environment.
===================================
How Much Power Should We Consume?
By Ed Caryl
There have been many suggestions here on this blog, and elsewhere, that the aim of the CAGW hoax is population control.
It is obvious that the poor people of the world produce more babies; witness Africa with a birth rate much higher than the rest of the world but a very low GDP. The Africans would seem to be the model for what the Greens want the world to be: a low carbon footprint. But with their high birth rate and low production, most of Africa teeters on the brink of famine. Unable to afford energy and sanitation, many burn forests and dump their waste untreated into the environment. This would suggest that the “low carbon footprint” model is only a recipe for disaster.
On the other hand, countries with well developed economies have low birth rates but high carbon footprints. If we are to reach a stable population, one that can be sustained far into the future, a world-wide well developed economy will be required.
A well developed economy requires energy. Producing food, goods, keeping people warm or cool, assuring hygiene, and providing transportation for people, food, and products, require energy.
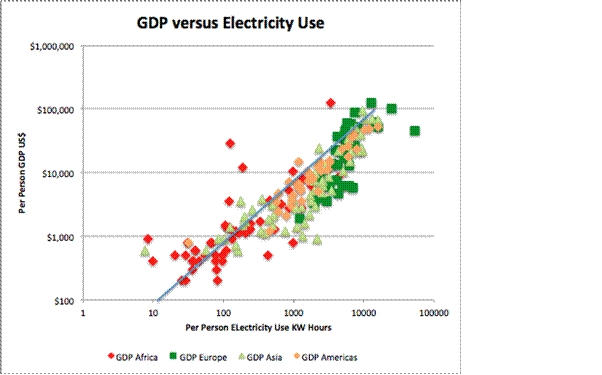
What are the relationships between population growth, energy consumption, and production? First, here’s a chart of electricity consumed versus GDP (Gross Domestic Product) per person for 202 countries. (Source for all the numbers in these charts is the CIA World Factbook.) Electrical power consumption can be considered a proxy for all energy consumption.
Figure 1: Per person GDP as a function of electricity use.
It is clear from Figure 1 that to have a well developed economy with a high GDP, energy consumption must also be high. A rough trend can be seen: each KW hour produces about $10 GDP per person. The average GDP per kilowatt-hour for all countries is $8.31. The ten highest electrical power users per person are: Iceland, Norway, Kuwait, Canada, Finland, Sweden, United Arab Emirates, Luxembourg, United States, and Australia. Oil production in Africa and the Middle East distort some of the GDP numbers.
What does a high GDP do to birth rate?

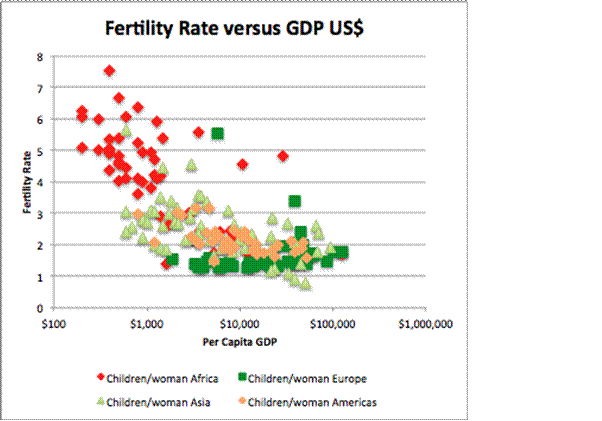
Figure 2: As per capita GDP rises, fertility rates (children per woman) fall.
In Figure 2, a fertility rate of 2 is the replacement level. Fertility rates below 2 indicate a declining population. Above 2 there is an increasing population. As you can see, most of Africa is poor and pregnant. African countries that are not poor are oil producers like Libya and Nigeria. Most European populations are in decline. The exceptions are Andorra and Gibraltar. Asian countries with thriving economies are below the replacement value. Singapore is the bottom point on fertility with a rate of 0.78 children per woman. South Korea, Taiwan, Hong Kong, and Macau are just above that number.
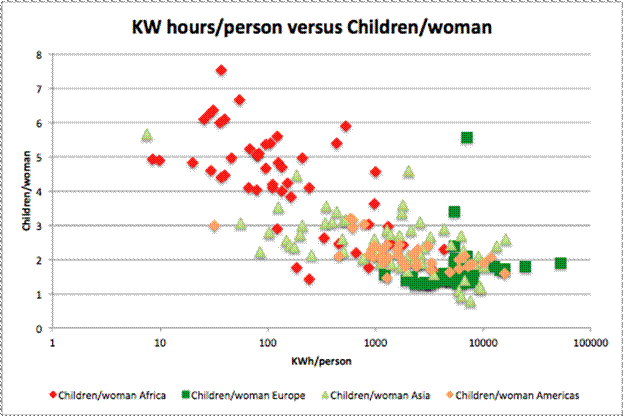
There is a third leg to our stool: the relationship between fertility rate and electrical power. The next chart shows that relationship.
Figure 3. The more power people consume, the less children they have.
Again, most of Africa, and some of Asia, is pregnant and powerless. It should be clear by now that there is an optimum electrical power and GDP necessary to result in a sustainable, stable population. Those numbers would appear to be about 3,000 KW hours and a GDP of about $30,000 annually per person. The total population is about seven billion. Therefore:
7 billion X 3,000 KWh = 21 trillion KWh.
21 trillion kilowatt-hours would seem to be a reasonable target. The world currently produces 19 trillion kilowatt-hours of electricity. It appears that about 10% more electrical energy, with the accompanying improvement in GDP, primarily in Africa and some parts of Asia, would go a long way toward improving the quality of life and stabilizing population in those areas.
Energy drives civilization. This fundamental should be obvious to all, but apparently has not penetrated the consciousness of Greens, Progressives, and warmist zealots. Man builds cities to concentrate people, jobs, markets, and energy use into more efficient areas. Energy allows more efficient production, including food, technology, housing, and transportation. Cities and energy encourage creativity and innovation. More energy means a higher Gross Domestic Product.
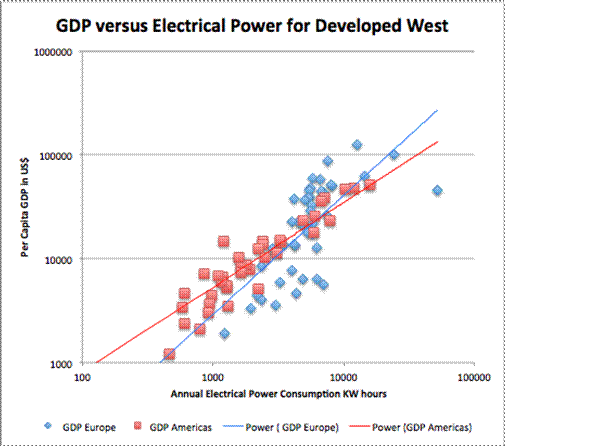
Figure 4: GDP as a function of electrical power usage, for Europe and the Americas.
Figure 4 shows a clear relationship between GDP and electrical power consumption. If less electricity is generated, the cost of electricity will go up (due to the economic law of supply and demand), less will be used, and GDP will go down. The converse is, of course, more desirable: more power and reducing the cost, will result in a higher GDP. High priced wind and solar is not the answer. Let the market decide how to generate more power efficiently.
For those that are screaming “what about carbon footprint!”, the market will very soon take care of that non-problem. We are currently passing the “peak oil” point. Fossil fuels, in the long term, will be a declining portion of our power production. Barring governmental stupidity, nuclear power will be an increasing percentage of energy production.
Due to the fact that carbon dioxide is a vital plant food, as well as a minor greenhouse gas, sometime in the not too distant future we will be developing schemes to keep the atmospheric CO2 level above 400 ppm or higher.


Good essay, Ed.
But why waste a dime trying to stay below the 400 ppm target? Even 600 ppm wouldn’t have any real impact on the planet. Screw CO2 levels. It’s only a trace gas and nothing more. Maybe if anything it’ll make the planet a bit warmer, and a lot greener.
Of course, in addition to energy, a big factor in reaching global prosperity are that we ensure education and liberty.
Excellent article, which tallies with these presentations.
http://www.economist.com/blogs/babbage/2010/12/data_visualati
Should be
http://www.economist.com/blogs/babbage/2010/12/data_visualation
Thanks!
Also, this one, wonder how the BBC people who filmed it could stomach it.
http://www.youtube.com/watch?v=jbkSRLYSojo
Good article, Ed. A minor remark. You write ‘ Fertility rates below 2 indicate a declining population. Above 2 there is an increasing population’. This would be true with hermetically closed borders. Immigration makes a big difference. In the seventeenth century many Dutch cities had a fertility rate below 2 (mainly due to child mortality). Because of immigration these cities expanded during our Golden Age. Immigration means prosperity.
One country’s immigration is another country’s emigration. People do move to where life is better. This will speed up the necessary changes if there is sufficient energy to support the increasing population.
California has found a means against that.
Yeah, Interstate 10 is now three lanes eastbound through Arizona and New Mexico to Texas. U-Haul sends drivers by air to Texas to return empty trucks. (kidding about the first part; the second part is true!)
Thanks, Ed – an enjoyable read; great graphs. I do quibble with a throw-away comment you make near the end about “passing the ‘peak oil’ point”. With the recent finds of enormous quantities of shale oil and gas (“thank you fracking!”) cheap energy will be available for a long time to come. And as that begins to fade hydrates will likely phase in. Somewhere in the mix nuclear will hopefully arise again. But we seem to have several hundred years of carbon based energy available even without further discoveries.
http://www.bgr.bund.de/EN/Home/homepage_node_en.html
Short Study of the German Federal Institute for Geosciences and Raw Materials:
457 EJ yearly global consumption of energy resources.
39,794 EJ of known economic reserves.
613,180 EJ of known resources, uneconomic at todays prices and technology.
1 to 87 to 1,342.
This does not include uranium or thorium derived from seawater, nor deuterium or other fusion-related stuff.
We discover about 40,000 EJ of resources per year.
And that is just on-planet resources.
See
http://www.bgr.bund.de/EN/Home/homepage_node_en.html
Here is a graph of most of the current predictions on peak oil.
http://peakoil.com/geology/trendlines-peak-oil-depletion-scenarios/
We may not be at the peak this year, but the peak is not far off. The easy, cheap, oil has already been pumped. From here on, it gets tougher. Fracking is pushing prices for gas down in the short term, but the life of a “fracked” well is just a few years. (The pressure starts to drop immediately.) That technology will make gas cheap now, but gas fueled turbines are already replacing coal fired plants, and natural gas prices are already starting to go up again.
ISTR similar graphs showing GDP/capita, energy consumption, standard of living and birth rates being published in the 1980’s.
Will we ever be able to solve the problem of societal amnesia?
Here’re several recent references to Tim Garrett’s work on the economy as a heat engine.
Ooooo! Here’s some dirty language: “Traditional macroeconomic models may be popular, but they are not falsifiable because their production functions can always be “tuned” to match observations”
===
http://www.inscc.utah.edu/~tgarrett/Economics/Economics.html
===
http://www.advisorone.com/2012/03/26/complexity-theorist
Physicist Tim Garrett perceives parallels between the global economy and the atmosphere.
===
http://www.declineoftheempire.com/2012/01/wealth-and-energy-consumption-are-inseparable.html
Wealth And Energy Consumption Are Inseparable
===
The first to study an economy as a thermodynamic system was Nobel Prize chemist Soddy in the 1920s:
http://en.wikipedia.org/wiki/Frederick_Soddy
He also concluded the root cause of booms and busts was due to fractional reserve banking making it possible to grow the economy faster than energy growth would support. Backing a currency with gold has no benefit because fractional reserve banks will always lend more currency than deposits anyway.
===
Molten salt nuclear reactor:
http://www.thoriumapplications.com/
===
All the actinide elements contain about one terawatt-day of energy per metallic ton. This is a 40 cm cube of metal. The earth’s total electrical production capacity is now about 1.5 terawatts.
Uranium is ubiquitous: 300,000 tons of dirt contains a ton of uranium – about 150,000 cubic meters. This is not a lot on a civil engineering scale; about twenty soccer fields, excavated to a depth of one meter. Divide this by six billion population = 25 cc/person-day.
Uranium is concentrated in coal; the heat value of the coal is roughly 1/10th of the heat value of the trace amount of the uranium in it; so it’s already been mined and partially separated.