By Ed Caryl
By now, well informed people are aware that there has been no warming for the last 16 or so years. Why should this be if CO2 has increased by 8% in that time? We are told by 97% of climate researchers, that CO2 doubling must warm us by 2 to 4.5 degrees C, so that 8% increase should have resulted in something like 0.2 to 0.3° C warming in the last two decades. Despite the best efforts of the data manipulators, that hasn’t happened. What is going on?
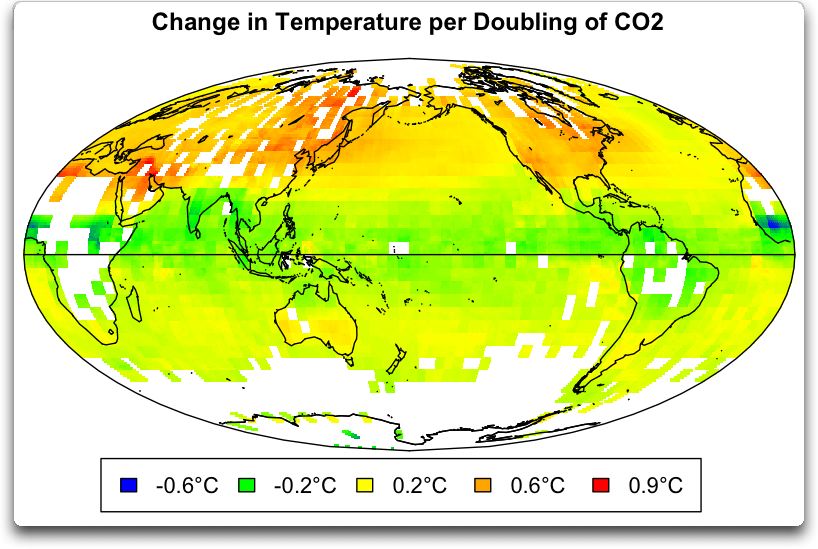
It has not occurred to many researchers that climate sensitivity to CO2 is not a constant. As Willis Eschenbach has pointed out in several articles, here, here, here, and most importantly, here, climate sensitivity is variable over short times, long times, and areas. It varies by time of day, being high in the morning when the sun is warming the atmosphere at the highest rate, and lower in the afternoon when rising air results in cumulus clouds and thunderstorms. It varies by latitude, being low or even negative in the tropics, where there are more thunderstorms, and higher at mid-latitudes. It is generally higher over land than over oceans, though there are extremely negative local spots over some tropical rain forests.
Figure 1 from Willis Eschenbach here.
Climate sensitivity also seems to be variable over long time scales. We know that both CO2 and water vapor are involved in the process, and we know that the effect of both is logarithmic. For CO2, as it increases in the atmosphere, the effect becomes less and less. Most of the greenhouse effect takes place at concentrations less than 200 ppm.
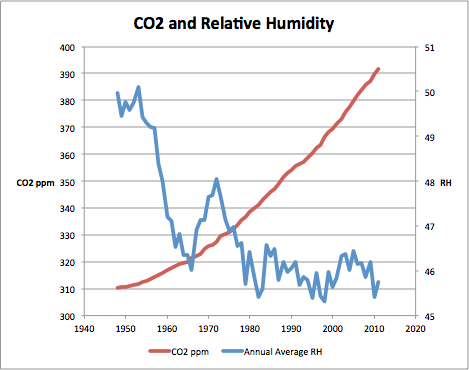
We also know that atmospheric humidity has been decreasing as CO2 is increasing, offsetting CO2 warming with water vapor cooling.
Figure 2: CO2 and humidity over time (600 mbar altitude).
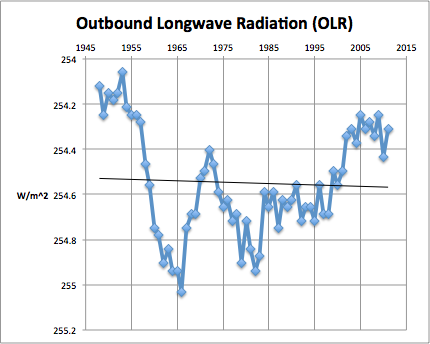
If we let MODTRAN calculate the resulting outbound long wave radiation (OLR) we see why we had cooling in the 60’s and 70’s and warming in the 80’s and 90’s. We also see the leveling in the last decade.
Figure 3: Computed OLR inverted so that warming is upward and cooling downward.
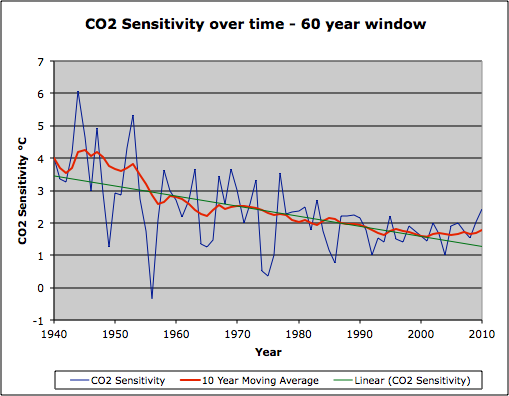
This decrease in humidity has more than offset the increase in CO2 and has decreased the climate sensitivity due to CO2 over time. This is also seen in computations of climate sensitivity versus temperature.
Figure 4: Computation of climate sensitivity from CO2 change and temperature change over 60-year time intervals to bridge AMO/PDO cycles.
Figure 4 shows that climate sensitivity has dropped from the 3 to 4°C per CO2 doubling range in the mid-20th century to below 2°C in the 1980’s, and to the 1.6 to 1.7°C range seen today. This explains the range and decreasing values seen in recent attempts to measure climate sensitivity. Water vapor is the thermostat, not CO2.


Hi Ed and Pierre, I’ve been interested in looking at the ‘missing heat’ too. Last weekend I downloaded some global, monthly average, 2.5 degree by 2.5 degree, OLWIR files and integrated them to a time series of overall global average OLWIR. The graph covers the period Jan 1975 to Mar 2013. I don’t know how to add it here, but if you’d like a copy, and/or the data, feel free to drop me an email.
Oh. I forgot to say, the data came from NOAA.
yes please
“If we let MODTRAN calculate the resulting outbound long wave radiation (OLR) we see why we had cooling in the 60’s and 70’s and warming in the 80’s and 90’s. ”
I’ve never used MODTRAN. you have to take into account that IR emissions from the surface vary with temperature. If you assume a constant temperature and only vary the atmospheric composition you don’t get realistic results. Does MODTRAN include that?
AND; as cloud droplets are blackbodies; cloudiness also affects spectral composition and intensity of outgoing radiation… so I fear your MODTRAN diagram is a purely theoretical exercise and does not reflect real outgoing LWIR (the only measurement I would accept is Earthshine but I haven’t found data anywhere).
What you say is true, but the correct way to judge the outcome of an experiment is to change one variable at a time, or one variable against a second. There is a measured data set of OLR for part of that time interval. It shows a similar shape.
Doesn’t CAGW say that ‘humidity’ should rise along with co2?
Yes, CAGW says the water vapor feedback is positive and humidity should rise along with CO2. That premise is clearly wrong.
If you plot the results of medical experiments about a phenomenon that proves to be fake, you will get something like Fig. 4. It’s called the decline effect. Do you agree, Ed, that the trend of CO2 sensitivity over seventy years, converges to zero about 2050? Thanks, for the article. very well written.
Yes, Mindert, that is the date the trend line crosses zero. That might even be real, because Willis found that transient sensitivity in the tropics was negative, and very low everywhere else, in the recent period that he examined. My 60-year window is close to equilibrium sensitivity averaged over the previous 60 years, so it is quite reasonable that we are close to reaching zero sensitivity for CO2.
Sorry Ed, but the climate sensitivity of CO2 is zero because it’s used as the working fluid to control atmospheric temperature.
Did you miss a “not” in there?
You may find this interesting,
Who is Willis Eschenbach?
http://www.populartechnology.net/2013/10/who-is-willis-eschenbach.html
As of 2012 Mr. Eschenbach has been employed as a House Carpenter.
He is not a “computer modeler”, he is not an “engineer” and he is certainly not a “scientist” (despite all ridiculous claims to the contrary).
“A final question, one asked on Judith Curry’s blog a year ago by a real scientist, Willis Eschenbach…”