Can We Expect Extreme Weather?
By Ed Caryl
The latest rallying cry from the catastrophic AGW crowd is that we can expect more heat waves, roaming heat waves, popping up unexpectedly and unpredictably. We hear this from Kevin Trenberth here (and refuted by Willis Eschenbach here), and from the PIK here. What about this? Is there any trend toward more heat waves and extremes?
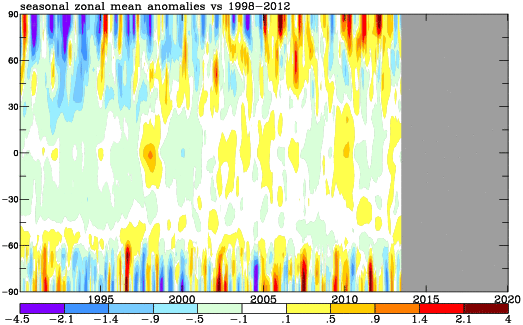
Figure 1: Plot of zonal mean temperature anomaly versus the average over those same years. The 1998 and 2009 El Niños are clearly visible.
Above is a plot with three-month resolution of temperature trend by latitude and time from 1990 using GISS figures. This plot illustrates increasing volatility as one moves from the tropics to the poles. One problem with this plot is that there are few weather stations in the Arctic and Antarctic, so weather at one station represents a rather large area, so one storm system in the Arctic will have more weight than a similar system in the mid-latitudes or tropics. Another problem is that the Arctic had a series of warm periods in 2005 to 2007, and 2009 to 2012, resulting in a warm decade. The warm blobs north of 60 degrees north represent fewer than 10 stations.
A more realistic view will be that of satellites. The satellite coverage, especially in the Arctic and Antarctic, is total compared to surface stations. Here is a plot of tropical, northern hemisphere mid-latitude, and Arctic temperature anomalies over the satellite era.
Figure 2 is a plot of RSS satellite temperature anomaly for three latitude bands, tropical, from -20° to +20°, 20° to 82.5°, and 60° to 82.5°. The Arctic latitude band is offset downward by 1.5°C for clarity (scale on the right). The resolution is one month.
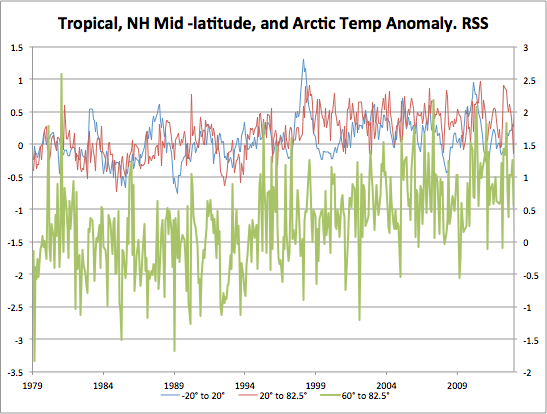
Figure 2: It is easy to see that the Arctic has much more temperature volatility than either the tropics or mid-latitudes, even though the mid-latitude plot includes the Arctic.
One can also see this volatility in Figure 1. But the question of the day is: Is that volatility increasing? To see that, I plotted the absolute value of the differential, the month to month difference, of the data in figure 2. These are plots of the temperature extremes, both cold and hot. The results are Figures 3, 4, and 5.
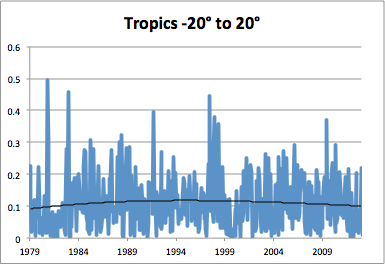
Figure 3: Plot of the absolute value of the extremes, month to month, for the tropics, 20° each side of the equator. The trend line is an order-3 polynomial.
As one can see in Figure 3, the temperature extremes have nearly no trend at all, just a slight rise in the 1980’s, and a very slight fall in this century. There are peaks around the time of El Niños, followed by calm weather after them.
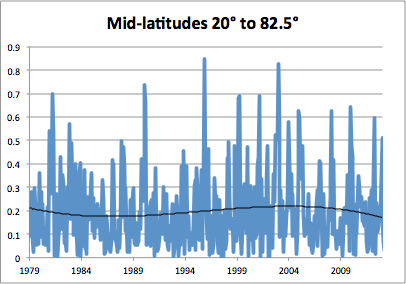
Figure 4: Plot of the absolute value of the temperature differences, month to month, for the mid-latitudes, 20° to 82.5° north. The trend line is an order-3 polynomial.
In the mid-latitudes, extremes are larger than in the tropics because the arctic extremes are included. The trend was down in the 1980’s, up in the 1990’s, and down in this century.
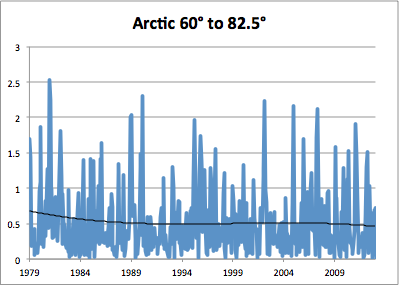
Figure 5: Plot of the absolute value of the temperature swings, month to month, for the Arctic. The trend line is an order-3 polynomial.
In the Arctic, extremes are much larger. But the trend was down in the 1980’s, then flat with a slight recent reduction since 2007.
No evidence of a trend in increasing extremes
Is there any evidence in the past for an increase in extreme events in the future? A big, round, resounding NO. In fact, the evidence suggests the future may have fewer extreme events. This makes sense from the fact that as the Arctic warms, the temperature differential between the Arctic and the tropics becomes less. It is temperature difference that drives storms. The PIK and Kevin Trenberth are ignoring observations and playing out their climate catastrophe fantasies in computer models.


To have more heat waves in a climate where the mean temperature is stagnant, you would also need to see more corresponding cold waves to offset the heat. Clearly Ed’s charts of month-to-month extremes show this is not the case.
There’s is one trend out there that’s clear: More and more bumper cherry harvests by climate scientists year after year.
LOL – “roaming heat waves”
~~~
And speaking of “bumper cherry harvests”:
We have 7 cherry trees – some years we get cherries. This year we did not. It was cold, wet, and windy when flowering and fruit set should have been going on. The 2 plum trees are doing well. Slightly different growth-habit timings of plum and cherry trees. “Climate scientists” should be looking at plums and not cherries!
Nice work Ed. Good to see the ‘climate scientists’ corrected as soon as they make their unfounded proclamations of doom. Well done.
Might I suggest one more graph, 25-60 north, where most people live, the temps have been DECLINING since 1998
https://sphotos-b-iad.xx.fbcdn.net/hphotos-frc3/996594_630419600336384_355490402_n.jpg
Where did you get that, KNMI?