Is Cyclone Activity Increasing?
By Ed Caryl
In the aftermath of the sole very strong tropical cyclone we experienced this year, all the catastrophists have since piled on claiming it was all caused by a warming world. They conveniently forget that one of their claims is that the polar regions are warming faster than the tropics. Of course temperature differences are what drive weather.
This is true of both tornadoes and cyclones. If the northern and southern temperate regions are warming faster than the tropics, then temperature differences should be falling, and storms should be decreasing in strength and number, not increasing.
So what is really happening?
Monthly accumulated cyclone energy (ACE) data were downloaded from Ryan Maue’s WeatherBell site here, and cyclone energy was totaled for the years from 1970 to the present. Next average annual cyclone energy was graphed by decade. Figure 1 is the result:
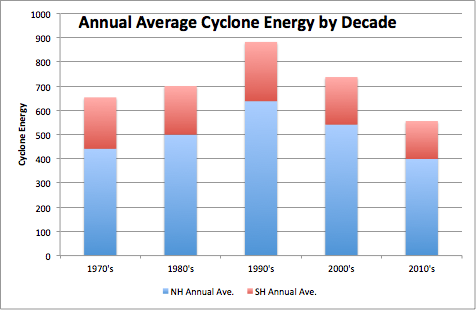
Figure 1 is the annual average Northern and Southern Hemisphere ACE for the decades since 1970 including the partial decade from 2010 to the present.
Both northern and southern hemisphere ACE increased from the 1970’s through the 1990’s, then decreased after 1999. What were temperatures doing?
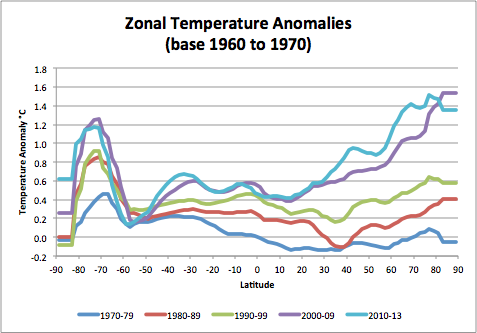
Figure 2 is the zonal warm season (May to October) temperature anomalies downloaded from GISS here, for the same five decades as in Figure 1.
In Figure 2, for the first three decades, the mid-northern and southern latitudes lagged the tropics, warming faster only in the last two periods. If we chart the tropical temperatures minus the northern and southern mid-latitude temperatures, Figure 3 results.
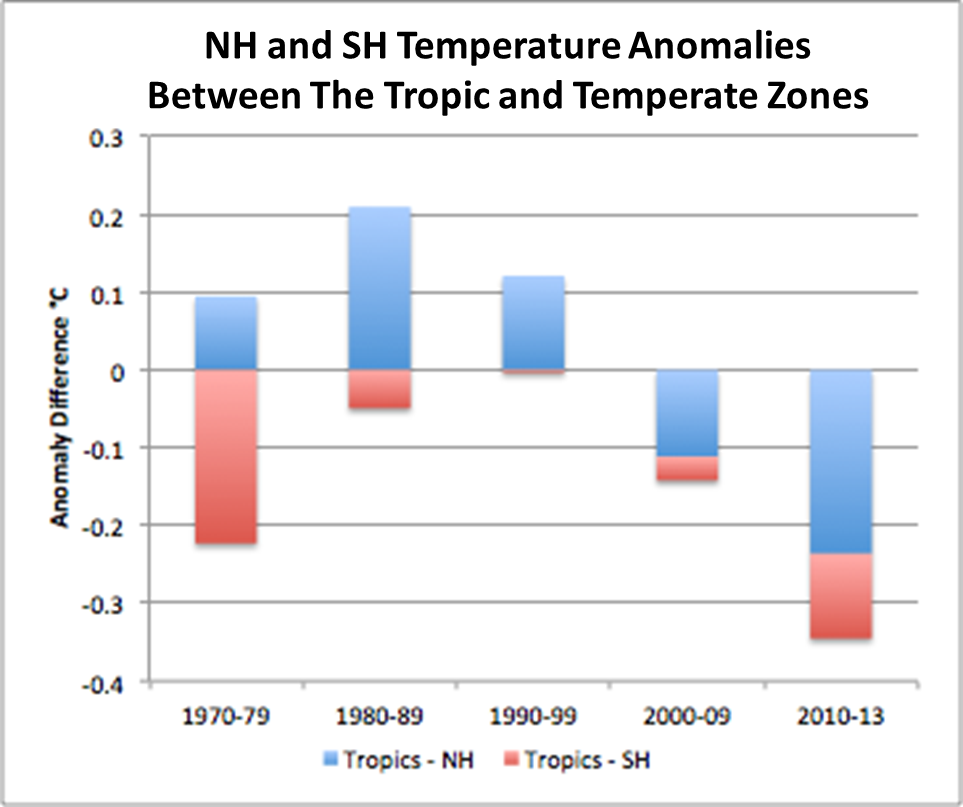
Figure 3 is a chart of tropical temperatures from Figure 2 (from -19° to +19° latitude) minus the temperate zone temperatures from -21° to -45° and +21° to +45° latitude for each decade. The temperature anomalies between the two zones have been declining since 2000, just as ACE has.
In both hemispheres, ACE follows the temperature difference between the tropics and the temperate zones. Compare Figure 1 and Figure 3. Since 2000, both temperature difference and ACE have been falling. In the southern hemisphere the temperature difference has always been negative, and so not surprisingly ACE has been low. It peaked in n the 1990’s when the temperature difference was highest. If the doomsayers had only looked at the data, they would have known they were wrong.
In fact, the doomsayers should be hollering that lower cyclone activity is real evidence of a warming planet. Of course that would be good news, but the doomsayers just don’t want any of that. No wonder the latest IPCC report claims there’s now data showing a link between extreme weather and warming. There is, but they don’t want you to see it.
What will happen in the future? The trends point to the tropics not warming further, the mid-latitudes continuing to warm, and the poles to cool. The trend is for ACE to decrease. And with the current 15-year warming pause showing no signs of abating, expect cyclone activity to stay at relatively low levels. Good news for every one!
Scream all you want, but the data tell the real story.


“In fact, the doomsayers should be hollering that lower cyclone activity is real evidence of a warming planet. Of course that would be good news, but the doomsayers just don’t want any of that.”
Yeah, too funny; their own campaigning strategy forces them to state that storms are getting worse even while the ACE data shows the opposite. So they’re anti-scientific in a very demonstrable sense.
Not good news for everyone – not for the scaremongers who want climate extremes to get worse.
Your moniker made I larf!
“…the data tell the real story.”
Amen, brother, amen. This statement identifies the cornerstone, essence and foundation of science. All theories propounded must be subservient to the confirmed and verified data accumulated.
Thus it has ever been and thus it will ever be.
you can already guess what warmists will say…
this was old time (!), we are in a new era and now ocean is warmer …everything is different…
…sites useful to dendrochronology can be identified and selected based on criteria that will produce tree-ring series sensitive to the environmental variable being examined. For example, trees that are especially responsive to drought conditions can usually be found where rainfall is limiting, such as rocky outcrops, or on ridgecrests of mountains. Therefore, a dendrochronologist interested in past drought conditions would purposely sample trees growing in locations known to be water-limited. Sampling trees growing in low-elevation, mesic (wet) sites would not produce tree-ring series especially sensitive to rainfall deficits. The dendrochronologist must select sites that will maximize the environmental signal being investigated. In the figure below, the tree on the left is growing in an environment that produced a complacent series of tree rings.
… GISS’s computerised temperature maps seemed to show readings across a large part of Russia had been up to 10 degrees higher than normal. But when expert readers of the two leading warming-sceptic blogs, Watts Up With That and Climate Audit , began detailed analysis of the GISS data they made an astonishing discovery. The reason for the freak figures was that scores of temperature records from Russia and elsewhere were not based on October readings at all. Figures from the previous month had simply been carried over and repeated two months running.
This tipped me off that they have gone into full cheating, damn the torpedoes mode. Check out the level of tampering they achieved for September US temperatures. NCDC shows a strong warming trend for September in the US.