By Ed Caryl
The recent Cowtan and Way paper attempting to fill gaps in the Arctic surface temperature records by in-filling with satellite data has triggered many reactions in the blogosphere. Cowtan and Way claimed that the coverage gaps in the surface data resulted in a cooling bias that they attempted to correct with satellite derived data. Others have pointed out many failings in this paper, but have failed to note the biggest failing of all:
HUGE warming adjustment bias
The authors managed to identify a coverage bias without noting a HUGE warming adjustment bias in the surface temperatures. It is difficult to believe that they did not notice this as they were comparing the HADCRUT4 data to the satellite data. This failure totally falsifies their findings.
Here is a comparison of the GISS data for land and ocean for the region north of 60° latitude (very similar to HADCRUT4 data, but more accessible), compared to the RSS Satellite land and ocean data for the same latitudes.
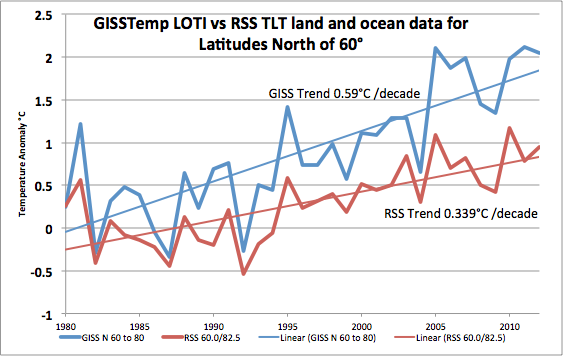
Figure 1 is a plot of GISSTemp land and ocean temperatures and RSS TLT land and ocean data for latitudes north of 60°.
Others have pointed out that GISS data, and indeed all the surface temperature data bases, suffer from “homogenization” and “correction”, cooling the past and warming the present. There has been much less criticism of the satellite data because those measurements are derived in a completely different way. The surface temperature data from GISS, HADCRUT, and GHCN suffer from the same problem, a limited number of polar measurement stations (they all use the same ones). Because these stations are in very cold climates, they all suffer from varying degrees of Urban Heat Island (UHI) effects – with Arctic stations being located located near buildings, air strips, etc. The satellites suffer much less from this problem because the polar regions are so thinly populated.
Note that in Figure 1 GISSTemp is warming about 75% faster than the satellite measurements. The divergence was small in the 1980’s, mostly confined to warm years, with less difference in cold years. But in the last decade, the difference has widened to more than a degree. Figure 2 is the bias in the GISS annual temperature data relative to the satellite data.
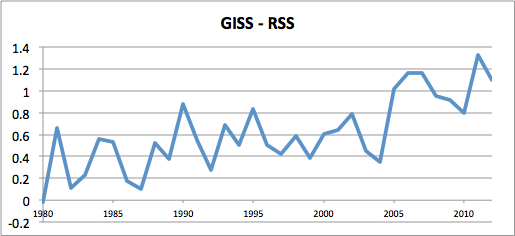
Figure 2 is the difference between the GISS data and the RSS data in Figure 1.
So why didn’t Cowtan and Way notice this warming bias? Rhetorical question – they didn’t want to!


Reminds me of what a Swiss journalist recently said, something like: “As there is little data to show warming, they now have to use data that doesn’t exist to show warming”.
The more GISS deviates from reality, the higher the output of the Kowtan-Way method becomes. Liars referring to each other.
O/T BBC has a graphic that shows where to expect Comet Ison if you want to look.
Best visibility 30 min before sunrise they say.
http://www.bbc.co.uk/news/science-environment-25052236
There is a useful web app here that indicates its position by date WRT the solar system and also has a button to select the Earth view perspective.
http://www.solarsystemscope.com/ison/
Mick.
Thanks—excellent!
What actually happened during the great dying of the thermometers, is the following. Let there be N thermometers in a certain region. Obtain for each thermometer a time series and compute a time series of the mean of all thermometers. Compute over time the correlation between each thermometer series and the mean series. Drop the thermometer showing the lowest correlation and repeat the procedure for N-1 thermometers till about eighty percent of the thermometers is gone. You may call this homogenisation but the time series correlation is the most significant predictor of drop-out in the surface station record (you will find 20 sigma effects). By this procedure the natural variance is reduced and an artificial signal is created of which Ed showed how it began to diverge from the satellite signal.
The proof that man-made CO2 is causing global warming is like the chain of evidence in a court case. CO2 keeps the Earth warmer than it would be without it. Humans are adding CO2 to the atmosphere, mainly by burning fossil fuels. And there is empirical evidence that the rising temperatures are being caused by the increased CO2.
What is that evidence??? Ummm?
“CO2 keeps the Earth warmer than it would be without it.”
Even that is not as evident as it is made out to be. First, water vapor has similar greenhouse properties, so CO2 and H2O compete for the same parts of the spectrum.
Second, IR-active (triatomic) gas molecules do not only absorb and re-emit upwelling IR but also incoming IR from the sun, and deflect half of the incoming IR on their absorption spectra back to space.
And if you are one of those who think that these molecules absorb IR but not re-emit it: That would violate Kirchhoff’s Law.